ISSN: 0970-938X (Print) | 0976-1683 (Electronic)
Biomedical Research
An International Journal of Medical Sciences
Research Article - Biomedical Research (2017) Volume 28, Issue 15
Study of different spectral parameters to measure depth of anesthesia
Department of Electronics and Instrumentation, Vimal Jyothi Engineering College, Kannur, Kerala, India
- *Corresponding Author:
- Elizabeth George
Department of Electronics and Instrumentation
Vimal Jyothi Engineering College, Kerala, India
Accepted date: April 7, 2017
The EEG is a valuable tool because it reflects cerebral physiology, it is a continuous and non-invasive measure, and it changes markedly on the administration of anesthetic drugs. The objective of this project is to find the excellent features to discriminate between different anesthesia states. Spectral Edge Frequency (SEF), spectral entropy and bicoherence can be used to differentiate different states. Analysis of EEG is typically performed using Fourier analysis, which is useful for detecting frequency components that correspond to the mental state of a patient. The parameters are calculated from power spectral density using appropriate formulas. From power spectrum of EEG, it’s observed that, the awake state active frequency range is 1.5-11 Hz. During the induction state the active frequency range is 1.5-9 Hz and during the deep state the active frequency range is around 1.5-7 Hz. Also, it’s observed that there is a decrease in EEG entropy as the anesthesia progresses. For the different stages of anesthesia no specific bicoherence values could be calculated. The awake state indicates the activity of α, β, δ and θ waves and later on during the deep state there occurs the presence of δ and θ waves. EEG entropies measure the uncertainty, or regularity, of a signal and correlate with cortical activity. With increasing concentrations of an anesthetic drug that depresses cortical activity there is a decrease in EEG entropy. The bicoherence measures the proportion of the signal energy at any bifrequency that is quadratically phase coupled. It was observed that, the magnitude of the coherence or coupling varies for all the cases. No specific pattern was observed, when different cases were observed.
Keywords
Anesthesia, Spectral edge frequency, Spectral entropy, Bicoherence.
Introduction
Electroencephalograph (EEG) gives complex irregular signals that may provide information about underlying neural activities in the brain. Electroencephalograms are recordings of the tiny electrical potentials (generally less than 300 μV) produced by the brain, the most complex part of human body and the one that is poorly understood [1].
EEG waveforms are generally classified according to their frequency, amplitude, and shape, as well as the sites on the scalp at which they are recorded. The most familiar classification uses EEG waveform frequency. Patterns observed in human EEG could be classified into Alpha, Beta, Theta and Delta waves. Alpha waves have frequencies between 8 and 13 Hz [2]. They appear over the occipital lobes in the awake, mentally relaxed state with the eyes closed. When a person opens his eyes, the synchronized alpha rhythm gives way to the desynchronizing lower amplitude pattern called Beta waves in which the higher frequencies in the range 13 to 32 Hz can be detected. As a person becomes drowsy and drifts off to sleep, slow waves appear in the EEG record. Waves in the frequency range 4 to 8 Hz called theta waves appear in the adults during light sleep [3]. During deep sleep waves in the frequency range 4 to 3.5Hz appear in adults and these are called Delta waves. The transition from a state of wakefulness to a state of general anesthesia is accompanied by profound changes in the brain’s spontaneous electrical activity recorded from electrodes placed on the scalp (an electroencephalograph or EEG).
The Entropy Module was introduced in 2003 by the Datex- Ohmeda Company. The product is based on many studies, which shows that entropy could be used to characterize the EEG and the depth of general anesthesia. The main idea is that increasing depth of anesthesia causes increase in regularity of the EEG, which can then be inferred by the entropy and used to estimate the depth of anesthesia [4]. Bispectral analysis makes use of phase information by detecting whether the phase of signal components at frequencies f1, f2 and f3 are interdependent or not. The bispectrum can be used to identify phase coherence between any three sinusoids that are components of a signal [5].
Methodology
Analysis of EEG is typically performed using Fourier analysis, which is useful for detecting frequency components that correspond to the mental state of a patient. The test took place in Operation Theatre (OT) of National Institute of Mental Health and Neuro Science (NIMHANS), Bangalore. ECG and EEG were simultaneously recorded; the leads chosen for EEG was FP1-T3 and FP2-T4 in accordance with the 10-20 lead system and lead1 for recording ECG. The test was performed on 8 subjects. Anesthesia used was propofol, with a dosage of 4 μg/ml, kept consistent throughout the process. Propofol is intravenously administered; initially its concentration level in blood (Cp) is 0 μg/ml, and gradually it increases to the set level that is 4 μg/ml. Through circulation, it reaches the brain, due to which concentration level in the brain (Ce) increases from initial 0 μg/ml to 4 μg/ml the individual. The interval between the initial injection of an anesthesia and the time to reach the maximum Ce is called induction period.
Data Acquisition
The EEG dataset used in the analysis was collected from lead1 for ECG, FP1-T3 and FP2-T4 scalp electrodes placed according to 10-20 system. There are three types of data sets used, namely case1 (awake state), case 2 (induction period) and case 3 (deep state). The ECG and EEG waves were simultaneously recorded. Data recorded was stored in ASCII format (Figure 1).

Figure 1: Data acquired.
Case 1. Awake state data
• The sampling rate for EEG data (FP1-T3 and FP2-T4) is 100 Hz.
• The data was recorded for about 5 min.
Case 2. Induction period
• The sampling rate for EEG data (FP1-T3 and FP2-T4) is 100 Hz.
• The recording time varies from 2-3 min
• No much artifact is present except few motion artifacts at the beginning of the recording.
• Motion artifact and baseline shift was present in EEG-initial stages
Case 3. Deep state
• The sampling rate for EEG data (FP1-T3 and FP2-T4) is 100 Hz.
• Artifacts were nearly nil.
Details of Programming
The software platform used to implement different analysis method is MATLAB. To reduce the effect of noise and artifacts, the recorded signals are pre-processed before analysis. Power spectral analysis for both leads FP1-T3 and FP2-T4 is done separately using filtered data. The Power spectrum is obtained and the predominant frequency is noted (Figure 2). Also, the SEF=50 is found out. Followed by the power spectrum analysis, the spectral entropy is figured out for frequency up to 13 Hz using the appropriate formulas.

Figure 2: Input EEG.
1. Spectral edge frequency/median frequency
At first, the power spectrum of EEG signal is obtained and then the spectral edge frequency or the median frequency, SEF=50 is calculated. The frequency below which 50% of EEG power spectrum is distributed is called the median frequency [6].
2. Spectral entropy
The spectral components X (fi) obtained from the Fourier transformation can be evaluated using an effective computational technique called the Fast Fourier Transform (FFT) [3].
X (f)=Σx () -j2πtifi → 1
The following steps are required to compute the spectral entropy for a particular epoch of the signal within a particular frequency range (f1, f2).The power P (fi) is found from the Fourier transform X (fi) of the signal x (ti), by squaring the amplitudes of each element X(fi) of the Fourier transform [3]:
P (f)=X (fi) X* (fi) → 2
Where X* (fi) is the complex conjugate of the Fourier component X (fi). The power spectrum is then normalised. The normalized power spectrum Pn (fi) is computed by setting normalization constant Cn so that the sum of the normalized power spectrum over the selected frequency region (f1,f2) is equal to one [3].
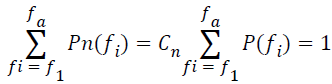 →(3)
→(3)
In the summation step, the spectral entropy corresponding to the frequency range (f1, f2) is computed as a sum [3].
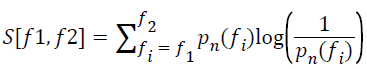 →(4)
→(4)
Thereafter, the entropy value is normalized to range between 1 (maximum irregularity) and 0 (complete regularity). The value is divided by the factor log (N (f1, f2)) where N (f1, f2) is equal to the total number of frequency components in the range (f1, f2).
SN(f1, f2)=(f1, f2) log (N (f1, f2)) → (5)
Bicoherence
The bicoherence of the signal is found using the instruction bicoher( ) from HOSA toolbox. The auto bicoherence value using this instruction doesn’t lie between zero and one due to the formula used for finding it [7].
When the component frequency f1 and f2 come from the same time series (channel electrode), the results are auto bispectrum and auto-bicoherence. When they come from different channels (different brain sites) the results are cross-spectra (f1 and f2 from one channel and f3 from another) [7].
Results
Power spectrum of EEG
The plots show the power spectrum plots of EEG of the subject. From the power spectrum plots, predominant frequency and the active frequency bands are noted (Table 1 and Figure 3).
| Subject | Predominant frequency (Hz) | Active frequency range (Hz) |
|---|---|---|
| 1 | 9 | 1.5-11 |
| 2 | 4 | 1.5-10 |
| 3 | 9 | 1.5-10 |
| 4 | 2.5 | 1.5-11 |
| 5 | 2 | 1.5-9 |
| 6 | 4.5 | 1.5-10 |
Table 1: Predominant frequency of EEG-case 1a.

Figure 3: Power spectrum (FP1-T3) (Awake state).
Case 1a: Awake state (FP1-T3 lead)
From the Table 1, and power spectrum it’s observed that in both cases the predominant frequency is 9 Hz and in the other two cases, it’s around 4 Hz and 2 Hz.
The active frequency range is 1.5-11 Hz, which indicates the activity of α, β, δ and θ waves. This shows that subjects are either relaxed or alert.
Case 1b: Awake state (FP2-T4 lead)
From the power spectrum plots predominant frequency and the active frequency bands are noted, which are shown in the Table 2 and Figure 4.
| Subject | Predominant frequency (Hz) | Active frequency range (Hz) |
|---|---|---|
| 1 | 2 | 1.5-10 |
| 2 | 7.5 | 1.5-10 |
| 3 | 2 | 1.5-10 |
| 4 | 7 | 1.5-10 |
| 5 | 2 | 1.5-10 |
| 6 | 8 | 1.5-10 |
Table 2: Predominant frequency of EEG-case 1b.

Figure 4: Power spectrum (FP2-T4) (Awake state).
From the Table 2 it can be seen that the predominant frequency lies around 2 Hz for two of the cases and 7 Hz for some of the cases. The active frequency range is 1.5-10 Hz, which indicates the activity of α, β, δ and θ waves. This indicates that subjects are either relaxed or alert.
Case 2a: Induction period (FP1-T3 lead)
Table 3 gives the predominant frequency and the active frequency. It can be observed that the predominant frequency is around 1.5 Hz for some cases and around 3 Hz for others. The active frequency range is 1.5-9 Hz which indicates activity of α, δ and θ waves, mostly the δ and θ bands are active (Figure 5). This indicates slow sleep state or drowsiness.
| Subject | Predominant frequency (Hz) | Active frequency range (Hz) |
|---|---|---|
| 1 | 1.5 | 1.5-9 |
| 2 | 4 | 1.5-9 |
| 3 | 1.5 | 1.5-9 |
| 4 | 1.5 | 1.5-9 |
| 5 | 3 | 1.5-9 |
| 6 | 1.5 | 1.5-10 |
Table 3: Predominant frequency of EEG-case 2a.

Figure 5: Power spectrum (FP1-T3) (Induction period).
Case 2b: Induction period (FP2-T4 lead)
From the power spectrum plots predominant frequency and the active frequency bands are noted, which are shown in the Table 4. From the table below it can be seen that the predominant frequency lie around 4 Hz. The active frequency range is 1.5-9 Hz which indicates activity of α, δ and θ waves, Mostly the δ and θ bands are active. This indicates slow sleep state or drowsiness (Figure 6).
| Subject | Predominant frequency (Hz) | Active frequency range (Hz) |
|---|---|---|
| 1 | 4.5 | 1.5-9 |
| 2 | 4 | 1.5-9 |
| 3 | 3.5 | 1.5-9 |
| 4 | 4 | 1.5-9 |
| 5 | 3.5 | 1.5-9 |
| 6 | 4.5 | 1.5-9 |
Table 4: Predominant frequency of EEG-case 2b.

Figure 6: Power spectrum (FP2-T4) (Induction period).
Case 3a: Deep state (FP1-T3 lead)
From the power spectrum plots predominant frequency and the active frequency bands are noted, which are shown in Table 5 and Figure 7.
| Subject | Predominant frequency (Hz) | Active frequency range (Hz) |
|---|---|---|
| 1 | 1.5 | 1.5-7 |
| 2 | 2 | 1.5-7 |
| 3 | 1 | 1.5-7 |
| 4 | 4 | 1.5-7 |
| 5 | 3 | 1.5-7 |
| 6 | 2.5 | 1.5-7 |
Table 5: Predominant frequency of EEG-case 3b.

Figure 7: Power spectrum (FP1-T3) (Deep state).
1. The predominant frequency lie around 2 Hz except for one case which is 4 Hz. The active frequency range is 1.5-7 Hz which indicates activity of δ and θ waves. This indicates that the subject is asleep or under anesthesia.
2. The active frequency range from power spectrum below is observed between 1.5-7 Hz, which indicates activity of δ and θ waves. This indicates that subjects are asleep. The red line indicates the predominant frequency in all the cases which varies around 1-2 Hz except for two cases which are around 3 Hz.
Case 3b: Deep state (FP2-T4 lead)
The predominant frequency and the active frequency bands are noted, which are shown in Table 6 and Figure 8. The predominant frequency lies around 4 Hz for two cases and is around 2 for the remaining. The active frequency range is 1.5-6 Hz which indicates activity of δ and θ waves. This indicates that the subject was asleep.
| Subject | Predominant frequency (Hz) | Active frequency range (Hz) |
|---|---|---|
| 1 | 1.5 | 1.5-4 |
| 2 | 2 | 1.5-6 |
| 3 | 1 | 1.5-6 |
| 4 | 4 | 1.5-6 |
| 5 | 3 | 1.5-6 |
| 6 | 2.5 | 1.5-7 |
Table 6: Predominant frequency of EEG-case 3b.

Figure 8: Power spectrum (FP2-T4) (Deep state).
SEF, spectral entropy and bicoherence
Table 7 shows the different values of spectral edge frequency at 50 for the three different cases of measuring the depth of anesthesia. We can see that the edge frequency decreases from 7 Hz to around 3 Hz as the stage progresses. When the edge frequency reaches around 3 Hz we can conclude that the patient has come to a deep state.
| Subjects | Case 1: Awake State | Case 2: Induction period | Case 3: Deep state | |||
|---|---|---|---|---|---|---|
| LEADS | LEADS | LEADS | ||||
| FP1-T3 | FP2-T4 | FP1-T3 | FP2-T4 | FP1-T3 | FP2-T4 | |
| 1 | 7 | 7 | 4 | 4 | 3 | 3 |
| 2 | 8 | 7 | 4 | 5 | 3 | 3 |
| 3 | 7 | 7 | 4 | 4 | 3 | 3 |
| 4 | 6 | 5 | 5 | 4 | 4 | 3 |
| 5 | 7 | 8 | 4 | 4 | 3 | 3 |
| 6 | 8 | 8 | 4 | 4 | 3 | 3 |
Table 7: SEF for all the case.
A similar relation between median frequency and blood concentration of anesthetics was observed in different studies. The awake median frequency was around 9 Hz, loss of consciousness occurred at around 5 Hz and corneal reflex was lost around 2 Hz. That is when the median frequency is above 5 Hz or 4 Hz the patient is responsive and conscious. The table below gives the values for spectral entropies for different cases. The spectral entropies decrease from around 0.8 to 0.6 as the case progresses. The value of entropy is around 0.6 when the patient reaches deep state. There exist some correlation with hypnotic drug concentration, EEG and levels of patient’s consciousness. Concentration of anesthetic agents results in more regular EEG which has less high frequency components. Both the approximate entropy and the spectral entropy decrease in a monotonic fashion [8-14].
Table 8 gives the bicoherence values for the different cases. Bicoherence between single signals is called auto bicoherence. The bicoherence measures the proportion of the signal energy at any bifrequency that is quadratically phase coupled. But the magnitude of the coherence or coupling varies for all the cases. No specific pattern is observed, when different cases were observed.
| Subjects | Case 1: Awake State | Case 2: Induction period | Case 3: Deep state | |||
|---|---|---|---|---|---|---|
| LEADS | LEADS | LEADS | ||||
| FP1-T3 | FP2-T4 | FP1-T3 | FP2-T4 | FP1-T3 | FP2-T4 | |
| 1 | 3.35 | 2.66 | 3.19 | 3.58 | 2.51 | 2.24 |
| 2 | 1.88 | 2.12 | 2.8 | 2.64 | 2.1 | 2.47 |
| 3 | 2.1 | 1.94 | 2.25 | 1.93 | 2.2 | 2.8 |
| 4 | 2.1 | 1.53 | 3.49 | 2.83 | 3.11 | 2.86 |
| 5 | 3.21 | 3.03 | 2.23 | 2.01 | 2.18 | 2.31 |
| 6 | 1.95 | 1.74 | 1.78 | 1.67 | 2.08 | 2.49 |
Table 8: Autobicoherence values for all the cases.
Conclusion
Pre-processing of EEG helped in keeping desired wave components and removing artifacts which helped in further processing of the signals. The objective of this project was to find the excellent features or combination of them that can discriminate between different anesthesia states. Power spectral analysis for leads FP1-T3 and FP2-T4 was done separately and the predominant frequency, as well as the SEF=50 was noted. The spectral entropy and bicoherence was calculated by taking a window of 10 s (1000 samples). Following the power spectrum analysis, the spectral entropy is found out for frequency up to 13Hz using the appropriate formulas. The bicoherence of the signal is found using the instruction bicoher( ) from HOSA toolbox. From the power spectrum of EEG, it’s observed that in the awake state the active frequency range is 1.5-11 Hz, which indicates the activity of α, β, δ and θ waves. During the induction state the active frequency range is 1.5-9 Hz and during the deep state the active frequency range is around 1.5-7 Hz which indicates activity of δ and θ waves. Also there is a decrease in the predominant frequency.
EEG entropies measure the uncertainty, or regularity, of a signal and correlate with cortical activity. We see that with increasing concentrations of an anesthetic drug that depresses cortical activity there is a decrease in EEG entropy. Correct interpretation of EEG entropy in the setting of clinical anaesthesia requires an understanding that some anesthetic agents do not reduce cortical activity and therefore have no consistent effect on entropy. The bicoherence measures the proportion of the signal energy at any bifrequency that is quadratically phase coupled. No specific pattern is observed, when different cases were observed.
References
- Grover VK, Neerja B. Measuring depth of anaesthesia - an overview on the currently available monitoring systems. Ind Anaesth Forum 2008; 3: 22-27.
- Brain DS. Computing Fourier transform and power spectrum using MATLAB. Fourier Series 2000.
- Viertio-Oja H, Maja V, Sarkela M, Talja P, Tenkanen N. Description of the Entropy algorithm as applied in the Datex-Ohmeda S/5 Entropy Module. Acta Anaesthesiol Scand 2004; 48: 154-161.
- Schneider G, Sebel PS. Monitoring depth of anaesthesia. Eur J Anaesthesiol 1997; 14: 21-28.
- Wong D, Clifton DA, Tarassenko L. An introduction to the bispectrum for EEG analysis. Biomed Signal Proc Inst Biomed Eng Oxford UK 2009; 61-62.
- Baik SW, Ye SY, Park MJ, Park SM, Jeon GR. Development of anesthesia depth index using SEF, BDR and BTR. Proc 2nd WSEAS Int Conf Biomed Electr Biomed Inform 2009; 34-36.
- Swami A, Mendel JM, Nikias C. Higher-order spectral analysis toolbox. Mathworks Inc. 1995.
- Satoshi H, Masaki T, Takahiko M, Hiroshi U, Takashi M. What we can know from bispectral analysis of EEG? Int Congress Series 2005; 1283: 239-242.
- Satoshi H, Masaki T, Takahiko M, Takashi M, Ikuto Y. Pract Issues Bispectral Anal Electroencephalograph Signals 2001.
- Schwender D, Daunderer M, Mulzner S, Klasing S, Finsterer U, Peter K. Spectral edge frequency of electroencephalogram to monitor the depth of anesthesia with isoflurane or propofol. Br J Anesth 1996; 77: 179-184.
- Chandra S. Manipal manual of physiology. Human Physiol CBS Publ Dist New Delhi 2006; 612.
- Musizza B, Ribaric S. Monitoring the depth of anaesthesia. Sensors (Basel) 2010; 10: 10896-10935.
- Quan L, Yi-Feng C, Shou-Zen F, Maysam FA, Jiann-Shing S. EEG signals analysis using multiscale entropy for depth of anesthesia monitoring during surgery through artificial neural networks. Comp Math Meth Med 2015; 2015.
- Miller A, Sleigh JW, Barnard J, Steyn-Ross DA. Does bispectral analysis of the electroencephalogram add anything but complexity? Br J Anaesth 2004; 92: 8-13.