ISSN: 0970-938X (Print) | 0976-1683 (Electronic)
Biomedical Research
An International Journal of Medical Sciences
Research Article - Biomedical Research (2016) Health Science and Bio Convergence Technology: Edition-I
Simple mathematical operations based classification of the light color values of the images for skin cell detection
Osmaniye Korkut Ata University, Bahce Vocational School, Osmaniye, Turkey
- *Corresponding Author:
- Selahaddin Batuhan Akben
Osmaniye Korkut Ata University
Bahce Vocational School
Turkey
Accepted date: July 09, 2016
Skin disorders are identified visually by expert medical doctors before the detailed examination stage. In addition, some automatic computer-aided diagnostic methods have been developed to help the doctor at the visual examination stage. These methods are mostly based on skin color classification because the color change in skin is important for medical doctors. However, proposed classification methods are based on complex mathematical equations. Therefore, methods proposed in the literature are difficult to understand by medical doctors and these methods cannot be used without a computer. In this study, a new classification method that based on simple mathematical operations and can be used without a computer is proposed. In the first stage of the study, relation between the primary light color values of the images was inspected visually and visibly obvious differences were determined to create new attributes. Then the classification was made in the following way If primary light color order is R>G>B and then the R/G ratio is between the determined range, the image sample was classified as skin image. Determined ratio (R/G ratio range of skin samples) was determined by the method of decision trees. Finally, the obtained new attributes were classified by using well-known classifiers again and the classification accuracy (99.2%) of the proposed method was approved.
Keywords
Skin segmentation, Image color classification, Skin color classification, Skin disorders, Automatic detection of skin.
Introduction
Since a small disorder in skin functions might affect other parts of the body the skin functions have great importance [1]. Skin disorders can be primarily identified by expert medical doctors by inspecting visually at the skin [2]. Then the further diagnostic techniques such as the biopsy scraping, wood light and etc. are used [3]. Expert medical doctors pay attention to the size, shape, color, and location characteristics of the skin during the visual inspection [4]. In addition, automatic computer-aided diagnostic methods have been developed to help medical doctors in recent years [5-7]. Main aim of the computer-aided diagnostic methods is the skin segmentation. Skin segmentation is primarily used to the large area of skin such as the face, hand and etc. [8-10]. However, the search area can be reduced for objects of interest and then the objectionable skin regions can be detected [11]. In the skin segmentation process, geometric, color, image transformation attributes based various skin image features are used to examine the skin [12]. However, most used feature is the skin image colors. Especially the classification of primary colors of light of the images (Red, Green and Blue) is most used method for skin segmentation [13-15].
The aim of the light color classification is to determine whether image belongs to skin. This process is determined by the combination of primary colors of light. So value of each primary color of light is used to classifiers as inputs. In the classification process, many different classifiers have been used in the literature [16-18]. Also quite successful results were obtained by using classifiers. However classifier algorithms consist of highly complex mathematical equations. Therefore, it is difficult to understand the operation logic of the system by expert medical doctors. Moreover, diagnosis of disease by using classifiers without computer assistance is not possible.
In this study, a new classification algorithm based on simple mathematical operations and light color of skin images was proposed. Thus, by using only color values of skin images, the medical doctors can easily diagnose mathematically the skin diseases without computer support. In the first stage of the study, new attributes were created by using the relationship with each other of the light-color values. Then, depending on the value of new attributes, images of skin samples were distinguished (classified) from the others. Then, to evaluate the success of the proposed method, the attributes created were classified with well-known classifiers. After all the findings and evaluations, method has been proposed to assist the expert medical doctors to diagnose the skin diseases with high success rate as 99.2%.
Materials and Methods
Dataset used in the study consist of primary light-colors (Red, Green and Blue) of image samples of faces. These image samples were obtained from the skin textures of people from various ages (young, middle, and old), gender and race (white, black, and Asian). Image processing methods were not used since the aim is to propose the simple and easy to use method. The number of samples is 245057 which 50859 are skin samples and 194198 are non-skin samples. So dataset is the matrix that 245057 × 4 dimensional. Each row is has an image sample and first third column have a light color values of the image samples. First column has blue color values, second column has green color values, third column has red color values and the fourth column has class labels. Class labels represent the skin and non-skin images. "1" means skin image and "2" means non-skin image. The color values range from 0-255. Also this dataset is publicly available at UCI Database [19]. Some samples of facial images can be seen in Figure 1.

Figure 1: Some image samples used in this study.
In this study, data were examined visually, first. In this way, it tried to determine the significant characteristics of the dataset. Visually distinguishing characteristics of dataset can be seen in Figures 2 and 3.

Figure 2: Graphical representation of image samples.

Figure 3: Statistical Graphics of color values.
As seen in the Figures 2 and 3, the magnitude order of color is the red, green, blue for skin samples, from larger to smaller. However, in non-skin samples, there is no particular order. Furthermore, the RED/GREEN, RED/BLUE and GREEN/ BLUE ratios are the distinguishing attributes for skin samples. So the order and ratio can be used as a classifier feature. Only the "R/G" was selected to provide implementation easiness and high processing speed in practice.
Here, the important thing is to determine the distinguishing R/G ratio. This obstacle was also solved with the decision-tree method because the decision-tree method can be identified the limit values of classes [20]. Therefore, by using the decision tree method the distinguishing R/G ratio range was identified for skin samples. Consequently, the classifier features are as follows:
For a test image,
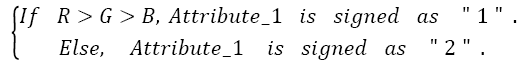 →(1)
→(1)
Then
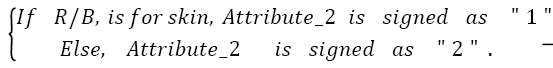 →(2)
→(2)
Then the test image is determined as,
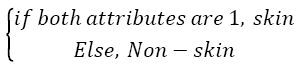 →(3)
→(3)
Also, graphical representation of these equations can be seen in Figure 4.

Figure 4: Graphical representation of the proposed classification method.
In fact, this method also determines the new attribute matrix (245057 × 2 dimensional) characteristically related with the data set. Rows are image samples and the columns are attribute values that determined by the proposed method. This matrix was used as the inputs to some well-known most used classifiers. Thus the accuracy of the method proposed was tested and verified. Well-known classifier methods used are: Support Vector Machines (SVM), Naive Bayes and K-Nearest Neighbor (KNN) [21-24]. Furthermore, the well-known ROC method was used to measure the classifiers success (accuracy) [25]. In addition, 10-fold cross-validation method was used for more reliable result [26].
In the experiment stage, the samples having R>G>B feature were represented as "1". Meanwhile, samples having other RG- B order were represented as "2". Thus, the first attribute values were created because "1" represents the skin samples and "2" represents the non-skin samples. Created first attribute values can be seen in Figure 5. Note that the number of samples is too much so, spaces between the different labels are may not be seen clearly.

Figure 5: Created first attribute values.
As shown in the Figure 5, attribute values are the same at the rate of 97.27% with known class labels. So the first attribute created is quite enough to distinguish the difference between the skin samples and others. However the success can be further improved. For this aim, the second attribute can be created to increase the classification success. Thus the second attribute can compensates the incorrectly classified samples according to the first attribute.
In the second attribute creation phase, R/G ratio was used as attribute. Distinguishing R/G ratio was also identified by using decision-tree method. According to the dendrogram generated by the decision tree method, R/G ratios between 1.15 and 1.9 represent the skin samples. Samples within this range were represented as "1" while other samples were represented as "2". Thus, the second attribute values were created because "1" represents the skin samples and "2" represents the non-skin samples, again. R/G ratio can be seen in Figure 6 and the second attribute values created can be seen in Figure 7.

Figure 6: R/G ratio of samples.

Figure 7: Created second attribute values.
As shown in the Figure 7, second attribute values are the same at the rate of 98.08% with known class labels. So, again the second attribute created is quite enough to distinguish the difference between the skin samples and others. However two attributes should be used together since the aim is to increase the success. Thus, an attribute can compensate the lack of another attribute. If so the sample should be identified as skin image if both attribute values are "1". Classification success rate obtained from use of both attributes is 99.2%. This success rate was calculated as follows: Segmentation (Labeling or classification) was identified by the proposed method. Then the obtained classification (segmentation) labels were compared with known class labels. Also, increased success with use of both attributes can be seen when Figure 8 is compared with Figures 5 and 7.

Figure 8: Classification result with the use of both attributes.
Subsequently, the matrix (245057 × 2 dimensional, rows are samples and columns are attribute values) consisting of the both attribute values was used as inputs to classification methods. At the same time, the raw data were classified by using same classifiers. The classifier accuracy with using attributes proposed by this study and the classifier results for raw data can be seen in Table 1.
| Classifiers | Accuracy with using proposed attributes | Accuracy with using raw data |
|---|---|---|
| Naïve Bayes | 99.20% | 92.39% |
| Support Vector Machines | 99.23% | 93.17% |
| K Nearest Neighbor | 99.21% | 93.48% |
Table 1: Accuracy rates of classifiers.
As seen in the Table 1 column 2, accuracy rate of the method proposed is almost same with classifiers success. However, these classifier successes (Table 1, column 2) are thanks to attributes obtained by the proposed method. The accuracy rates of the classification of raw data are lower if compared to proposed method.
In addition, the classification algorithms are complex and it is difficult to understand by expert medical doctors but proposed method is very simple because it is based on basic mathematical operations (+, -, × and ÷ ). This simplicity allows the using of proposed method without a computer. If so, the following can be said with the findings:
1. Classifiers have confirmed the success of the proposed method.
2. The proposed method can be used without the classifier because accuracies are almost same.
3. The proposed method is based on simple algorithm compared with classifiers. It also provides ease of use for medical doctors.
4. Proposed method is also available with a single attribute, because the success rate is high.
5. Success can be increased using the “R/B” and/or “G/B” features. However, in this case, the processing speed may be decreased.
Finally, the proposed method was compared also with some previous studies. Comparison results can be seen in Table 2.
| Proposed Methods | Accuracy |
|---|---|
| Proposed Method In This Study | Average99.21% |
| Hoeffding Tree Classifier [27] | 97% |
| A Novel Method for Imbalanced Data [28] | 96% |
| Logisitic regression [29] | 91.92% |
Table 2: Comparision of proposed method with previous studies.
As seen in Table 2, proposed method is superior also to previous methods proposed in literature.
Conclusion
In this study, a new skin segmentation method can be applied easily is proposed for expert medical doctors to diagnose the skin disorders. The proposed method is based on the relationship of color components of images. If order of color components is R>G>B and then the R/G ratio is within the requested range (between the 1.15-1.19) it can be said that the test sample is skin image. The most important advantage of the method is applicable with simple mathematical operations. Also, the success rate of the proposed method is 99.3%. Moreover, it also provides high success with using only one of the proposed feature extraction processes.
The use of the proposed method is as follows:
1. The photo of the skin area to be identified is taken.
2. If order of value (magnitude) of the image color components is R>G>B and then the R/G ratio is between the 1.15-1.9 ranges, the image is determined as skin.
3. Else the image is determined as skin disorder.
Note that the process can also be accomplished by providing only one of the R>G>B or R/G ratio conditions.
References
- Glogau RG. The risk of progression to invasive disease. J Am AcadDermatol2000; 42: 23-24.
- Braun RP, Rabinovitz HS, Oliviero M, Kopf AW, Saurat JH.Dermoscopy of pigmented skin lesion. J AmAcadDermatol2005; 52: 109-121.
- Sardana K, Mahajan S, Sarkar R, Mendiratta V, Bhushan P, Koranne RV, Garg VK. The spectrum of skin disease among Indian children. PediatricDermatol2009; 26: 6-13.
- Henning JS, Dusza SW, Wang SQ, Marghoob AA, Rabinovitz HS, Polsky D, Kopf AW. The CASH (color, architecture, symmetry, and homogeneity) algorithm for dermoscopy. J Am AcadDermatol2007; 56: 45-52.
- Di Leo G, Liguori C, Paolillo A, Sommella P. An improved procedure for the automatic detection of dermoscopic structures in digital ELM images of skin lesions. In Virtual Environments, Human-Computer Interfaces and Measurement Systems, (VECIMS 2008) IEEE Conference on, 2008.
- Taouil K, Romdhane NB. Automatic segmentation and classification of skin lesion image. In Distributed Frameworks for Multimedia Applications, The 2nd International Conference on IEEE, 2006.
- Al-Tairi ZH, Rahmat RWO, Saripan MI, Sulaiman PS. Skin Segmentation Using YUV and RGB Color Spaces, JIPS 2014; 10: 283-299.
- Kurmi US, Srivastava HS, Agrawal D, Baghel RK. Performance Evaluation of RGB Skin Color Segmentation Based Face Detection Technique. Int J EngUnivSci Res Manage 2014.
- Casati JPB, Moraes DR, Rodrigues ELL. SFA: A human skin image database based on FERET and AR facial images, In IX workshop de Visao Computational, Rio de Janeiro. 2013.
- Neshat M, Sepidname G, Eizi A, Amani A. A new skin color detection approach based on fuzzy expert system. Indian J SciTechnol2015.
- Yu JJ, Han SW. Skin detection for adult image identification, In Advanced Communication Technology (ICACT), 2014 16th International Conference on IEEE, 2014.
- Plataniotis K, Venetsanopoulos AN.Color image processing and applications. Springer Science & Business Media, 2013, Germany.
- Saini HK, Chand O. Skin Segmentation Using RGB Color Model and Implementation of Switching Conditions. Skin 2013; 3: 1781-1787.
- Severino OJ, Gonzaga A. A new approach for color image segmentation based on color mixture. Machine Vision Appl2013; 24: 607-618.
- Kaur G, Kaur P. Analysis of Face Recognition using YCbCr and CIElab Skin Color Segmentation Methods.Int J Adv Res ComputSci2015.
- Ibraheem NA, Khan RZ, Hasan MM. Comparative study of skin color based segmentation techniques.Int J Appl Info Syst2013.
- Chen W, Wang K, Jiang H, Li M. Skin colormodeling for face detection and segmentation: a review and a new approach. Multimedia Tools Appl2016; 75: 839-862.
- Lingala M, Stanley RJ, Rader RK, Hagerty J, Rabinovitz HS, Oliviero M, Stoecker WV. Fuzzy logic color detection: Blue areas in melanoma dermoscopy images.Comput Med Imag Graphics 2014; 38: 403-410.
- Abhinav D, Gaurav S, Bhatt R, Khan GM. Adaptive Digital Makeup.ProcInt Symposium Visual Comput 2009; 5876: 728-736.
- Kevric J, Subasi A. The Effect of Multiscale PCA De-noising in Epileptic Seizure Detection. J Med Syst2014; 38: 1-13.
- Akben SB, Alkan A.ÖzniteliklerArasıKorelasyonunDüşükOlduğuVeriKümelerindeSınıflandırmaBaşarısınıArtırmakİçinYoğunlukTemelliÖznitelikOluşturma. J Faculty Eng Arch GaziUniv2015; 30: 597-603.
- Akben SB. A New Method for Selection of Neighborhood Parameter in Distance-Weighted K-Nearest Neighbors Classifier (DWKNN): Circular Attribute Neighbors. J Elect ElectEng2016; 16: 2021-2026.
- Akben SB. Automatic Detection of Seed Quality and Varieties by Classification Methods. Global J Res Anal 2015; 4: 36-37.
- Shabat AM, Tapamo JR. A comparative study of Local directional pattern for texture classification, In Computer Applications &Research (WSCAR), 2014 World Symposium on IEEE, 2014.
- Akben SB, Tuncel D, Alkan A. Classification of multi-channel EEG signals for migraine detection. Biomed Res 2016; 27: 743-748.
- Akben SB. Automatic Detection of Seed Quality and Varieties by Classification Methods. Global Res Anal 2015; 4: 36-37.
- Lyon RJ, Brooke JM, Knowles JD, Stappers BW. A Study on Classification in Imbalanced and Partially-Labelled Data Streams. In Systems, Man, and Cybernetics (SMC), 2013 IEEE International Conference on IEEE, 2013.
- Di Martino M, Fernández A, Iturralde P, Lecumberry F. Novel classifier scheme for imbalanced problems. Pattern RecognLett2013; 34: 1146-1151.
- https://github.com/madhrajan91/Skin-Segmentation