ISSN: 0970-938X (Print) | 0976-1683 (Electronic)
Biomedical Research
An International Journal of Medical Sciences
- Biomedical Research (2015) Volume 26, Issue 3
Seizure detection by classification of EEG signals based on DWT reconstruction error and CWT using a Novel Wavelet.
1Sathyabama University, Jeppiaar Nagar, Rajiv Gandhi Salai, Chennai 600 119. Tamilnadu, India
2St.Peters College of Science and Technology, Konicalla Camp Road, Avadi, Chennai, Tamil Nadu 600054, India
3Sree Balaji Medical College & Hospital, #7, Works Road, Chromepet, Chennai, Tamil Nadu 600044, India
- *Corresponding Author:
- P. Grace Kanmani Prince
Sathyabama University
Jeppiaar Nagar, Rajiv Gandhi Salai
Chennai 600 119. Tamilnadu
India
Accepted date: April 19 2015
The analysis of EEG signals plays a vital role in the detection of Seizure. The EEG signal of a normal person varies when compared to that of a seizure affected person. A new wavelet is created which closely represents a normal EEG wave. The discrete wavelet transform using the new wavelet family is applied to the input EEG signals. Since the new wavelet represents the normal EEG wave pattern the reconstruction error is very less when a normal EEG signal is applied as an input when compared to that of a seizure EEG signal. This marked difference in the reconstruction error is used to classify the normal and seizure EEG signals. When continuous wavelet transform is applied to the input EEG signal using the new mother wavelet, the wavelet coefficients are higher in seizure EEG when compared to that of the normal EEG signal.
Keywords
EEG, Seizure, continuous wavelet transform, discrete wavelet transform, reconstruction error, wavelet coefficients
Introduction
There is a worldwide concern about the growing number of people with epilepsy. Around 50 million people around the world are affected by Epileptic seizure of which 80% of them are living in developing countries. The four major causes of a seizure are head injury, head trauma, stroke and brain tumor [1]. Children who get high fever also get seizure which in the latter stages may become epileptic. For proper diagnosis long hours of EEG signals has to be obtained from the patients and reviewed by the doctor. Automatic detection of seizure using EEG signals has become a notable area of research. The automatic seizure detection helps in detecting subtle seizures even when the patient is unaware of the occurrence of seizure. False positives in automatic detection are also present but novel techniques aid in the reduction of false alarms [2]. Among the methods that are being used in automatic seizure detection Wavelet transform has gained its popularity since it gives both time and frequency details of the signal. The computational time is also improved by using wavelet when compared to other methods [3]. There are two types of wavelet transform. They are continuous wavelet transform (CWT) and discrete wavelets transform (DWT). In CWT the continuous time input signal is divided into wavelets for detailed time based frequency analysis using a mother wavelet [4]. The DWT uses filter banks to segregate the signals into specific range of frequencies using high pass and low pass filters. The output of high pass filter gives detailed coefficients and output of the low pass filter gives approximation coefficient. The signal can be reconstructed by adding the detailed and approximation coefficient. The error value can be calculated by obtaining the difference between the original signal and the reconstructed signal. The error has to be very closer to zero [5].
The section 2 of this paper deals with creating a new wavelet. Section 3 deals with the application of DWT for decomposition and reconstruction of the signal using the new wavelet. Section 4 gives details of CWT when the new wavelet is applied as mother wavelet. Section 5 gives the concluding remarks of this study.
Creating a new mother wavelet
The new wavelet is constructed based on the morphological features of an EEG signal which has sharp peaks and troughs. Hence a cycle of the EEG signal is considered and a similar pattern is taken into consideration to develop a mother wavelet which in turn aids to achieve better correlation with the input EEG signal.
A novel wavelet family ‘eeg wave’ has been created using MATLAB which can perform both CWT and DWT. In future, the orders of the wavelet can be increased under this family. The families of wavelets can belong to one of the five wavelet types. They are orthogonal wavelets using FIR filters, biorthogonal wavelets using FIR filters, orthogonal wavelets without using FIR filters but using a scaling function, wavelets not using FIR filters and not using a scaling function and complex wavelets not using FIR filters and without using a scaling function. The wavelet that is used in this paper is an orthogonal wavelet with filter.
The wavelet is named as eegwav which is defined by the filter allied with it. The basic filter described by equation 1 is associated with this wavelet. It helps to construct the four filters used by the Discrete Wavelet Transform eegwav = [(1+e(.2)) (1.5+ e(.2)) (1.5- e(.2)) (1- e(.2))] (1)
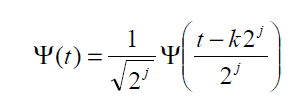
When using discrete wavelet transform the filters associated with this wavelet are first calculated. The filter bank realization is the wavelet coefficients of discrete child wavelets of a given mother wavelet Ψ (t) which is expressed in equation 2. The mother wavelet is scaled by powers of 2 and shifted by powers of 2.
 (2)
(2)
In the above equation the scaling parameter is denoted by j and shifting parameter is denoted by k. The wavelet and scaling function of the new wavelet ‘eegwav’ is given in Figure 1.

Figure 1: The scaling and wavelet function
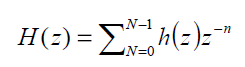
There are four filters. Two low-pass filters are calculated.
One is for decomposition and the other is for reconstruction.
Similarly two high pass filters are computed for
decomposition and reconstruction purpose. The low pass filter is denoted by G (z) and high pass filter is denoted by
H (z) [6].It is represented by equation 3 and 4. 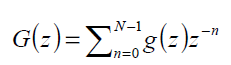 (3)
(3)  (4)
(4)
The decomposition and reconstruction filters are shown in Figure 2

Figure 2: Decomposition and Reconstruction filters
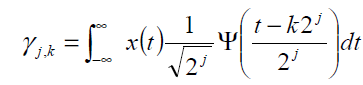
The signal under analysis is x (t). The wavelet coefficient is denoted by γ which is expressed in equation 5. The input signal length is 2N.
 (5)
(5)
Hence γj,k is the convolution of the signal with the mother wavelet which has undergone dilation, reflection and normalization [7]. The new wavelet is formed in such a way that it closely represents a normal EEG wave.
Application of DWT using the new wavelet for classification of seizure EEG
The normal EEG and Seizure EEG signals are obtained from the database given by Epilepsy Centre present in the University of Bonn [8]. The DWT uses filter banks which segregates the input signal into approximation and detail components [9]. The approximation gives the low frequency content of the signal and details give the high frequency contents. The new mother wavelet ‘eegwav’ closely resembles the normal EEG wave pattern. Hence using this mother wavelet discrete wavelet transform is performed on the input signal. The input signal is decomposed into approximation and detail components. These components are then added to get the reconstructed signal.
The input signal is shown in figure 3 which gives the details of how it is subdivided into low frequency and high frequency components. Low frequency component (approximation) is A2 and high frequency components (detail) are denoted by d1 and d2. Then finally the reconstructed signal is also displayed in the last row.

Figure 3: Decomposition and reconstruction of an EEG signal
The error between the original and reconstructed signal is calculated. If the error is less it indicates that the reconstruction is proper. If the input signal is a normal EEG signal then the reconstruction error is less since the eegwav closely represents normal EEG signal. If the input signal is a seizure EEG signal then the reconstruction error is comparatively higher. The reconstruction error is calculated using the formula given in equation 6.
error = max (abs(x1-(A2+D1+D2))) (6)
The reconstruction error values for normal and abnormal signals are plotted in figure 4. It clearly indicates that the reconstruction error for normal EEG signal is mostly lesser than 1 and error for seizure signals are greater than 1.

Figure 4: Plot showing the wavelet reconstruction error
Application of CWT using the new wavelet for classification of seizure EEG
The novel mother wavelet ‘eegwav’ is also used to study the EEG signal using continuous wavelet transform. The continuous wavelet transform gives the details of time at which the frequencies occur [10]. The wavelet coefficient of a seizure affected EEG is much higher when compared to normal EEG signal which indicate that higher frequency signals are produced at the time of seizure[11]. EEG signals are generally low frequency signals. Hence Figure 5 shows the output when a continuous wavelet transform is applied to a seizure affected EEG and a normal EEG signal. The axes which represent the scale give the details of frequency. The higher scale values represents low frequency components and vice versa. EEG signals are generally low frequency signals. Hence it can be seen in the higher values of scale and are present throughout the entire time scale. The CWT of seizure affected wavelet has a higher wavelet coefficient when compared to normal EEG signal [12] as highlighted in the figure given below. The highest wavelet coefficient for a seizure affected EEG signal is usually more than 900 where as the highest value of the wavelet coefficient is usually lesser than 900.

Figure 5: CWT of Seizure EEG and normal EEG using the ‘ EEG wav’ mother wavelet
The EEG signal of a person when a tonic seizure had occurred is shown in Figure 6. The pre ictal (before the occurrence of seizure), ictal (at the time of seizure) and post ictal stages can be vividly seen in the given signal. Figure 7 shows the CWT of the above EEG signal. The lower values of the scale axis indicate higher frequency components. Hence during the Ictal stage the wavelet coefficients are higher at lower scale values when compared to pre-ictal and post-ictal stages

Figure 6: EEG signal during the occurrence of Tonic seizure

Figure 7: CWT using ‘eegwav’ of EEG signal during the occurrence of Tonic seizure
Conclusion
The novel wavelet which is named as ‘eegwav’ which closely represents the normal EEG has been successfully used to classify the seizure EEG and normal EEG signals. The EEG signal was decomposed using discrete wavelet transform into approximations and detail components. Then reconstruction is done by adding approximation and details. The reconstruction error is calculated by subtracting the sum of the approximation and details from the original signal. Since the mother wavelet represents normal EEG, the reconstruction error was very less when compared to Seizure EEG signals. The ‘eegwav’ wavelet was also used in continuous wavelet transform. The wavelet coefficients are higher for seizure EEG when compared to the wavelet coefficients of normal EEG.
References
- Kimberly Holland, “Epilepsy by the Numbers: Facts, Statistics,and You”, October 20, 2014, Healthline.
- J. Gotman, “Automatic seizure detection: improvements and evaluation”, Electroencephalography and Clinical Neurophysiology,Volume 76, Issue 4, October 1990
- M. Sifuzzaman, M.R. Islam and M.Z. Ali, “Application of Wavelet Transform and its Advantages Compared to Fourier Transform”, Journal of Physical Sciences, Vol. 13, 2009, 121-134 ISSN: 0972-8791
- Walker, James S, “A primer on wavelets and their scientific applications” ,2nd ed., Updated and fully rev. Published/ Created Boca Raton : Chapman & Hall/CRC, 2008
- ShihuaCai&Keyong Li, “Matlab Implementation of Wavelet transform”, http://eeweb.poly.edu/iselesni/WaveletSoftware/top.html
- K. K. Shukla, A. K. Tiwari, “Efficient Algorithms for Discrete Wavelet Transform”, Springer Briefs in Computer Science, 2013
- RobiPoliker, “The Wavelet Tutorial”, 1999
- Andrzejak RG, LehnertzK, Rieke C, Mormann F, David P, Elger CE (2001), “ Indications of nonlinear deterministic and finite dimensional structures in time series of brain electrical activity: Dependence on recording region and brain state”, Phys. Rev. E, 64, 061907.
- Ali N. Akansua, Wouter A. Serdijnc, Ivan W. Selesnick, “Emerging applications of wavelets: A review”, Physical Communication, ELSEVIER, 2010.
- Ralph Meier, Heike Dittrich, Andreas Schulze-Bonhage and Ad Aertsen, “Detecting Epileptic Seizures in Long-term Human EEG:A New Approach to Automatic Online and Real- Time Detection and Classification of Polymorphic Seizure Patterns”, Journal of Clinical Neurophysiology , Volume 25, Number 3, June 2008.
- O. Blanke, G. Lantz, , M. Seeck, L. Spinelli, R. Grave de Peralta, G. Thut, T. Landis, C.M. Michel, “Temporal and spatial determination of EEG-seizure onset in the frequency domain”, Clinical Neurophysiology ,763 to 772, 2000.
- P. Grace Kanmani Prince, R. Rani Hemamalini, “Seizure Detection Using Parameter Estimation and Morlet Wavelet Transform”, Communications in Computer and Information Science, Volume 270, pp 674-679, 2012.