ISSN: 0970-938X (Print) | 0976-1683 (Electronic)
Biomedical Research
An International Journal of Medical Sciences
Research Article - Biomedical Research (2017) Volume 28, Issue 22
RNA sequencing reveals the differences between chemical and chronic constipation induction of intestinal tumor
1School of Life Science, Southwest Forestry University, Kunming, Yunnan, PR China
2School of Big Data and Intelligence Engineering, Southwest Forestry University, Kunming, Yunnan, PR China
3School of Civil Engineering, Wuhan University, Wuhan, Hubei, PR China
4Key Laboratory for Forest Resources Conservation and Use in the Southwest Mountains of China, Ministry of Education, Southwest Forestry University, PR China
- *Corresponding Author:
- Yong Cao
School of Big Data and Intelligence Engineering
Southwest Forestry University, PR China
Accepted date: September 24, 2017
Constipation is a common clinical symptom and it is a highly frequent complication in patients with chronic gastrointestinal disorder and intestinal tumor. The chemicals such as DMH (Dimethylhydrazine) can also induce intestinal tumor. Loperamide-induced constipation model was established to verify that chronic constipation can increase the risk of intestinal tumor. 128 Kunming mice were divided into four groups, namely, healthy, chronic constipation, intestinal tumor induced by chronic constipation and intestinal tumor with constipation after DMH (Dimethylhydrazine) induction. Our experiments are conducted to evaluate the effects of chemical and chronic constipation induction of intestinal tumor for understanding their different mechanisms. High-throughput analysis methods (RNA-seq) are used to sequence the transcriptome of mouse intestinal tissue. GO and KEGG database are used to identify metabolism pathways and related genes. Through the comparison among the different experimental groups the Differentially Expressed Genes (DEGs) are identified, respectively. The metabolic pathways and DEGS about DMH and chronic constipation induction are very different. According to the analysis of different metabolic pathways and related genes the different tumorigenesis and modulation mechanisms of chemical and chronic constipation induction are revealed.
Keywords
Chronic constipation, Intestinal tumor, Kunming mice, RNA-seq, GO, KEGG.
Introduction
Constipation is a common clinical symptom that affects more than 10% of the world's population [1]. Clinically, constipation is defined by standard clinical symptoms, such as reduced frequency of defecation, hard fecal matter, extended defecation time, overexertion during defecation, and sense of unfinished defecation [2]. Constipation have been a world wider problem [2,3]. In China, the incidence of colorectal cancer has been significantly increasing, and ranks the fourth place among malignant tumors at present. In coastal areas the incidence rate of colorectal cancer has been close to the level of developed countries [1].
Some significant risk factors for colorectal cancer include alcohol consumption, chronic inflammation of the gastrointestinal tract, chronic constipation and etc. [4,5]. An enormous amount of researches have been focused on transcriptome of intestinal tumor. Anna et al. have found that high-fat consumption perturbs both the intestinal microbiome and metabolome, and each has the potential to induce protumorigenic changes in the epithelial transcriptome [6]. The many studies focused on transcriptome are related to differentially expressed genes and metabolic pathways. Baoku et al. present a systems analysis of KEGG pathways in colorectal cancer using Genome-wide association study method to highlight new biological pathways in colorectal cancer [7]. Liu et al. demonstrate that gene Fermitin Family Member 1 (FERMT1) is significantly overexpressed in Colon Cancer (CC) and associated with poor metastasis-free survival and they reveal modulation mechanism of beta-catenin transcriptional activity [8]. Sakuma et al. provide evidence that ST3GAL1/3/4 and FUT3 are transcriptionally up-regulated by c-Myc with probable involvement of Ser62 phosphorylation, and that FUT2 is transcriptionally down-regulated through the attenuation of CDX2 [9]. With the in-depth study of the physiological function and mechanism of action of noncoding RNA in recent years, making it gradually realized extensive regulation of non-coding RNA gene expression, which occurs in tumor development, invasion and metastasis, drug resistance and other processes plays an important role. Non-coding RNA has the potential to explore gastrointestinal tumors pathogenesis and resistance mechanisms to provide new ideas and direction [10].
Loperamide acts on opioid receptors in the intestinal wall to inhibit the release of acetylcholine and prostaglandin, resulting in inhibition of intestinal peristalsis and prolonging of the retention time of intestinal contents, which lead to constipation [4]. This study to research the relation of constipation and intestinal tumor established a chronic constipation model by using loperamide, and induced an intestinal cancer model in Kunming mice with DMH (Dimethylhydrazine) induction, in order to provide a reference for the prevention of intestinal cancer and the rapid establishment of intestinal cancer model. Currently, commonly used chemical inducers for colon cancer include Dimethylhydrazine (DMH), Ethylnitrosourea (ENU), Azoxymethane (AOM), hydrazine derivatives and aromatic amines, all of which can be administrated by feeding, injection and anal suppository placement. Different routes of inducers and medications will result in differences in the final type of tumor and the rate of tumor formationm [5].
Materials, Reagents and Methods
Materials
Experimental mice were provided by Kunming Medical University.
128 Kunming mice were provided by Kunming Medical University. Main equipment for experiments included Leica stereomicroscope (Leica Company, Germany), optical microscope (Nikon Company, Japan), and microscopic imaging system (Nikon Company, Japan). Loperamide hydrochloride (Xian-Janssen Pharmaceutical Ltd., performance standard: YBH04562010, specifications: 2 mg/tablet, batch number: 141111266); DMH (TCI Company, Japan), and all other needed regents were analytical reagents (Xilong Chemical Co., Ltd.).
Preparation of experimental reagents and related drugs
(1) Preparation of loperamide suspension: Commercially available loperamide hydrochloride (2 mg/tablet) was prepared into 0.25 mg/ml physiological saline suspension, namely, a tablet of loperamide hydrochloride was dissolved in 8 ml physiological saline, with pH value adjusted to about 7.0. This solution was mixed well for further use.
(2) Preparation of DMH physiological saline solution: 1 g DMH hydrochloride was weighed and dissolved in 100 ml physiological saline, then, filtration and sterilization were performed using an organic-phase bacteria filter with a bore diameter of 0.22 μm, followed by preservation in a 4°C refrigerator for further use
Experimental methods and procedures
Procedures: the experimental flow chart is shown in Figure 1.

Figure 1: Experimental flow chart. can stands for the experimental group injected with DMH to induce intestinal tumor after the successful establishment of constipation model; cob stands for the rest mice group in coa (n=44); cocan stands for the group of chronic constipation model injected with 1/2 original dosage of loperamide (n=22); co stands for the rest mice injected with sterile saline in cob (n=22).
Establishment of constipation model: A total of 128 healthy Kunming mice with same age were screened and randomly divided into experimental group (coa, n=88) and control group (vac, n=40). The coa group was treated with intragastric administration according to the intragastric volume per unit of body weight of 2.5 mg/(Kg*d) for 2 consecutive weeks; the vac group received intragastric administration with equal volume of sterile physiological saline. Two weeks later, the constipation model was established successfully [5].
Establishment of intestinal tumor model based on constipation model: After the successful establishment of constipation model, the coa group was randomly divided into can group and cob group. The can group were injected with DMH to induce intestinal tumor [5] and the cob group was divided into cocan group and co group. Then the 22 mice with constipation in cob group, namely, cocan group were continuously administrated based on 1/2 original dosage loperamide, which lead to chronic constipation. Stereomicroscope was used to observe lesion morphology, and lesions were fixed by 10% formalin solution and sliced into 5 μm sections according to the paraffin section method.
Based on the constipation model, DMH was injected to induce intestinal cancer model. Anatomy showed that the mice with chronic constipation had sarcoma in the intestines. Visible sarcoma under naked eyes was firstly found in the intestines of the can group at the 7th week, which was followed by the cocan group at the 9th week. No abnormalities were detected in the vac group and co group (Table 1).
| Week 5 | Week 7 | Week 9 | Week 11 | Week 13 | |
|---|---|---|---|---|---|
| can | 0 | 3 | 5 | 8 | 12 |
| cocan | 0 | 0 | 2 | 4 | 6 |
| co | 0 | 0 | 0 | 0 | 0 |
| vac | 0 | 0 | 0 | 0 | 0 |
Table 1: Changes in the number of visible sarcomas in the intestines of mice by anatomy (the number of sarcomas/mouse).
After the lesions in the intestines were fixed by 10% neutral formalin solution, sarcomas under the stereomicroscope presented uneven surface and abundant blood vessels in staggered and irregular arrangement (Figure 1). Observation of pathological sections under high-power microscope revealed that cells showed irregular shape, inconsistent size, irregular nuclear shape, nuclear hyperchromatism, prominent nucleolus and nuclear division at lesion sites, which were confirmed as tumor cells when compared with relevant data (Figures 2 and 3).

Figure 2: Sarcoma morphology in the external and internal wall of the intestine (arrows in above images indicate visible sarcomas under naked eyes, below images present visible sarcomas under naked eyes in the internal wall of the intestine under stereomicroscope after fixation by 10% neutral formalin solution).

Figure 3: Intestinal tumors under 40X microscope (HE staining).
RNA extraction, library preparation, and next-generation sequencing: next-generation sequencing is rapidly becoming the method of choice for transcriptional profiling experiments. Total RNA was isolated from snap-frozen colonic tissue from the control group and tumor samples from the experimental groups using the AllPrep DNA/RNA Mini Kit (Qiagen, Valencia, CA, USA). The quality and quantity of the extracted RNA samples were determined with bioanalyzer and ultramicro spectrophotometer, respectively. The library was constructed using the Illumina TruSeq RNA preparation kit (Illumina, San Diego, CA, USA) according to the manufacturer’s manual. The next generation sequencing platforms most frequently used for RNA-seq are the Illumina HiSeq. Samples were sequenced on the Illumina instrument with 50-75 bp paired-end reads.
Analysis of RNA-seq: Raw Illumina fastq files were adapterremoved by software cutadapt [10], Pollution-assessed by blast + [11] and quality-controlled by Prinseq [12]. The reads were aligned to the mouse genome with TopHat v2.0.10 [13] and The Cufflinks [14] program cuffdiff was used to calculate expression levels. Gene Ontology classification and enrichment analysis was performed base on the genes. KEGG PATHWAY is a collection of manually drawn pathway maps representing our knowledge on the molecular interaction and reaction networks for metabolism, genetic Information Processing, human Diseases etc. [15]. KEGG was used to annotate the genes.
Statistical analysis: Results were obtained by a variety of statistics and graphic software. The statistical analysis was performed with R packages and Sam tools [16]. Welch’s t-tests were conducted to compare the phenotypes of the different group mice and statistical significance was set at P<0.05. To determine the role of the chronic constipation and chemical carcinogen in the development of colon tumorigenesis , the well-established model of constipation recapitulates the progression from chronic constipation to intestinal tumor in humans.
Results
Sample clustering based on gene correlation of RNA in different group mice
The gene correlation heatmap of sample clustering can directly reflect the similarity and difference among the samples. According to the distances between different samples the clustering graph was generated. From the graph it can be found that the sample v1 and c2 were classified in same cluster and v2 and c1 were classified in another cluster but v1 and v2 were blank group and c1 and c2 belonged to chronic constipation group. These clusters were different from our groups. The rest sample clusters were consistent with our groups (Figure 4). This shows that the expression of the transcriptome was not enough to discriminate healthy and chronic constipation.

Figure 4: The gene correlation heatmap of sample clustering. The more similar the two samples are, the nearer the distance is. Each color box represents the distance between different samples. The greater the distance, the deeper the blue and the closer the distance, the deeper the red. v stands for vac group, c stands for co group, ca stands for can and co stands for cocan.
Annotation of COG and KOG database
COG and KOG are database for alignment of protein sequences. COG is for prokaryotic species and KOG is for eukaryotic species. Based on the alignment results the number of genes in each function classification was calculated. The statistics on the number of functional genes are shown in Table 2.
| Code Name | Name | Gene_num | Gene_ratio |
|---|---|---|---|
| T | Signal transduction mechanisms | 7418 | 20.66 |
| R | General function prediction only | 4883 | 13.6 |
| K | Transcription | 3915 | 10.9 |
| 0 | Posttranslational modification, protein turnover, chaperones 2609 | 2609 | 7.27 |
| S | Function unknown | 2514 | 7 |
| Z | Cytoskeleton | 1954 | 5.44 |
| U | Intracellular trafficking, secretion, and vesicular transport | 1830 | 5.1 |
| A | RNA processing and modification | 1242 | 3.46 |
| J | Translation, ribosomal structure and biogenesis | 1109 | 3.09 |
| E | Amino acid transport and metabolism | 962 | 2.68 |
Table 2: The statistics of functional genes are annotated in KOG.
Differential expression analysis
The correlation between the gene expression of samples is an important indicator to reflect the reliability and the rationality of sample selection. In order to facilitate the comparison of different experimental groups the letter A was used to indicate vac group, B indicated co group, C indicated can group, and D indicated cocan group. The comparisons were executed in A vs. C, B vs. C, A vs. D, B vs. D and C vs. D. The correlation analysis between different samples is shown in Figure 5. The differential gene test method uses cuffdif2 in Cufflink. The software is widely used in the RNA-seq analysis with the reference genome. Filter condition was set to p-value<0.05. The differential expression gene analysis was also shown in Figure 5. The volcanic map of differential gene expression was shown in Figure 6. The relationship between p-value and log2 (foldchange) can be visualized directly by volcanic map. The Venn diagram of different expressed gene comparison was shown in Figure 7.

Figure 5: The correlation analysis between samples. The coordinates are log2 FPKM of the sample 1 and the abscissas are log2 FPKM of sample 2. The red indicates up-regulated gene and the green indicates down-regulated gene. A stands for vac group, B stands for co group, C stands for can group and D stands for cocan group.

Figure 6: The volcanic map of differential expression of genes. The abscissas represent the multiple change of gene expression in different experimental groups. The ordinates represent the statistical significance of changes in gene expression. The smaller the p-value, the greater the -log10 (p-value), namely, the difference is more significant. The scattered points in the graph represent each gene. Blue dots indicate genes with no significant difference and red dots represent genes with significant differences.

Figure 7: The comparison of different expressed gene.
GO enrichment analysis of differential genes
Gene Ontology (GO) is an international standard classification system for gene function. According to the experimental purpose the differential genes were screened out. The study on the distribution of differential expressed genes in Gene Ontology can clarify the difference of gene functions in the samples. GO enrichment analysis method is based on Wallenius non-central hyper-geometric distribution. The method can calculate the probability that GO terms are enriched by differential genes more accurately. The GO enrichment analysis of differential expressed gene is shown in Table 3 and Figure 8.
| GO_ID | Term | Type | DEGs_this_term | UP | Down | Expected | P value | FDR |
|---|---|---|---|---|---|---|---|---|
| GO:0003823 | Antigen binding | molecular_function | 79 | 41 | 38 | 12.5 | 1.00E-30 | 3.07E-27 |
| GO:0006955 | Immune response | biological_process | 117 | 83 | 34 | 35.65 | 1.00E-30 | 3.07E-27 |
| GO:0006952 | Defense response | biological_process | 120 | 81 | 39 | 38.98 | 1.60E-29 | 3.27E-26 |
| GO:0002376 | Immune system process | biological_process | 150 | 97 | 53 | 61.82 | 8.00E-26 | 1.23E-22 |
| GO:0005576 | Extracellular region | cellular_component | 183 | 103 | 80 | 85.14 | 8.20E-25 | 1.01E-21 |
| GO:0006950 | Response to stress response | biological_process | 197 | 109 | 88 | 98.81 | 1.20E-23 | 1.23E-20 |
| GO:0009605 | To external stimulus | biological_process | 129 | 69 | 60 | 59.05 | 4.40E-18 | 3.85E-15 |
| GO:0002682 | Regulation of immune system process | biological_process | 84 | 52 | 32 | 30.63 | 2.00E-17 | 1.53E-14 |
| GO:0051707 | Response to other organism | biological_process | 73 | 48 | 25 | 24.53 | 3.90E-17 | 2.57E-14 |
| GO:0043207 | Response to external biotic stimulus | biological_process | 73 | 48 | 25 | 24.56 | 4.20E-17 | .2.57E-14 |
| GO:0009607 | Response to biotic stimulus | biological_process | 75 | 50 | 25 | 25.8 | 5-.1OE-17 | 2.84E-14 |
| GO:0005615 | Extracellular space | biological_process | 92 | 55 | 27 | 35.96 | 6.60E-17 | 3.37E-14 |
| GO:0002252 | Immune effector process | biological_process | 63 | 41 | 22 | 19.36 | 9.00E-17 | 4.24E-14 |
| GO:0006959 | Humoral immune response | biological_process | 30 | 23 | 7 | 4.76 | 3.10E-16 | 1.36E-13 |
| GO:0050776 | Regulation of immune response | biological_process | 60 | 42 | 18 | 18.27 | 3.40E-16 | 1.39E-13 |
| GO:0044421 | Extracellular region part | cellular_component | 104 | 63 | 41 | 45.11 | 6.80E-16 | 2.61E-13 |
| GO:0045087 | Innate immune response | biological_process | 56 | 36 | 20 | 16.48 | 7.60E-16 | 2.74E-13 |
| GO:0002684 | Positive regulation of immune system process | biological_process | 64 | 44 | 20 | 20.82 | 8.40E-16 | .2.86E-13 |
| GO:0002460 | Adaptive immune response based on somatic | biological_process | 40 | 30 | 10 | '8.91 | 1.10E-15 | 3.55E-13 |
| GO:0002250 | Adaptive immune response | biological_process | 41 | 31 | 10 | 9.44 | 1.50E-15 | 4.60E-13 |
Table 3: The GO enrichment analysis of differential expressed gene in A vs. C.

Figure 8: The GO enrichment analysis of differential expressed gene in A vs. D.
KEGG enrichment analysis of differential genes
In organisms different genes coordinate their biological functions. The most important biochemical and signal transduction pathways of differential expressed genes are identified by pathway enrichment.
KEGG (Kyoto Encyclopedia of Genes and Genomes) is the main public database of pathway [15]. Pathway enrichment analysis uses hypergeometric test and find the pathway in the differential expressed genes. The value of p is calculated by the follow formula.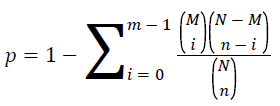
The pathway of p<0.05 was defined as the significantly enriched pathway in differential expressed genes. The KEGG enrichment analysis of differential expressed gene was shown in Table 4 and Figure 9.
| KO _ID | Term | Type | DEGs_this_term | Up | Down | P-value | FDR |
|---|---|---|---|---|---|---|---|
| ko05204 | Chemical carcinogenesis | Human diseases | 22 | 1 | 21 | 1.95E-10 | 5.15E-08 |
| ko00980 | Metabolism of xenobiotics by cytochrome | P450 metabolism | 15 | 1 | 14 | 3.09E-07 | 3.61E-05 |
| ko00140 | Steroid hormone biosynthesis | Metabolism | 17 | 1 | 16 | 4.10E-07 | 3.61E-05 |
| ko00591 | Linoleic acid metabolism | Metabolism | 12 | 4 | 8 | 2.09E-06 | 0.000138 |
| ko00590 | Arachidonic acid metabolism | Metabolism | 15 | 6 | 9 | 1.00E-05 | 0.000529 |
| ko05140 | Leishmaniasis | Human diseases | 12 | 11 | 1 | 2.05E-05 | 0.000902 |
| ko04940 | Type I diabetes mellitus | Human diseases | 11 | 10 | 1 | 4.80E-05 | 0.001649 |
| ko00830 | Retinol metabolism | Metabolism | 14 | 1 | 13 | 5.00E-05 | 0.001649 |
| ko05332 | Graft-versus-host disease | Human diseases | 10 | 9 | 1 | 5.66E-05 | 0.001661 |
| ko00982 | Drug metabolism - cytochrome P450 | Metabolism | 12 | 0 | 12 | 6.96E-05 | 0.001836 |
| ko00920 | Sulfur metabolism | Metabolism | 5 | 0 | 5 | 0.000105 | 0.002509 |
| ko04612 | Antigen processing and presentation | Organismal systems | 12 | 8 | 4 | 0.000155 | 0.002917 |
| ko00480 | Glutathione metabolism | Metabolism | 10 | 2 | 8 | 0.000155 | 0.002917 |
| ko05144 | Malaria | Human diseases | 10 | 6 | 4 | 0.000155 | 0.002917 |
| ko04060 | Cytokine-cytokine receptor interaction | Environmental Information Processing | 26 | 23 | 3 | 0.000259 | 0.00426 |
| ko05164 | Influenza A | Human diseases | 19 | 13 | 6 | 0.000277 | 0.00426 |
| ko05134 | Legionellosis | Human diseases | 10 | 6 | 4 | 0.00028 | 0.00426 |
| ko05146 | Amoebiasis | Human diseases | 14 | 9 | 5 | 0.00029 | 0.00426 |
| ko04640 | Hematopoietic cell lineage | Organismal systems | 12 | 12 | 0 | 0.000354 | 0.004861 |
| ko05321 | Inflammatory bowel disease (IBD) | Human diseases | 10 | 9 | 1 | 0.000368 | 0.004861 |
Table 4: The KEGG enrichment analysis of differential expressed gene in A vs. C.

Figure 9: The KEGG enrichment analysis of differential expressed gene in A vs. D.
Through significant enrichment KEGG p-value of the comparison groups the heatmap was produced. The heatmap is shown in Figure 10.

Figure 10: The heatmap of significant enrichment KEGG p-value of the comparison groups. The yellow is warm color and the yellow boxes point out where the paths are enriched.
Discussion
Through the comparison of A vs. C, A vs. D, B vs. C, B vs. D, and C vs. D 882 DEGs, 2495 DEGs, 674 DEGs, 2131 DEGs and 3093 DEGs are identified, respectively. These DEGs were mapped to 2004 GO terms and 127 KEGG pathways. The types of enriched GO terms of A vs. D involve “cellular_component”, “biological_process”, “molecular_function”, and etc. The top 3 Go terms of A vs. D are “extracellular region”, “single-organism metabolic process” and “small molecule metabolic process”. The types of enriched GO terms of A vs. C involve “molecular_function”, “biological_process”, “cellular_ component” and etc. The top 3 Go terms of A vs. C are “antigen binding”, “single-organism metabolic process” and “small molecule metabolic process”. The types of enriched KEGG pathways of A vs. D involve “Organismal Systems”, “Metabolism”, “Cellular Processes”, and etc. The top 3 KEGG pathways of A vs. D are “Fat digestion and absorption”, “Arginine and proline metabolism” and “Galactose metabolism”. The types of enriched KEGG pathways of A vs. C involve “Human Diseases”, “Metabolism”, “Organismal Systems” and etc. The top 3 KEGG pathways of A vs. C are “Chemical carcinogenesis”, “Metabolism of xenobiotics by cytochrome P450” and “Steroid hormone biosynthesis”. It can be seen that the carcinogenesis mechanisms about DMH and chronic constipation induction are very different. The DMH induction is related to chemical carcinogens and the chronic constipation induction is related to metabolism (Table 5).
| Gene | Fold change | p value | FDR | pathway or term |
|---|---|---|---|---|
| Cyp1a1 | 0.01119 | 0.00005 | 0.0085 | ko00140 |
| Cyp2c55 | 0.00343 | 0.00005 | 0.0085 | ko00140 |
| Cyp2e1 | 0.33676 | 0.02 | 0.036 | ko00140 |
| Myc | 2.0819 | 0.013 | 0.041 | GO:0042474 |
| Wnt3 | 2.1353 | 0.043 | 0.032 | GO:0005110 |
| HK2 | 2.4181 | 0.0014 | 0.046 | GO:0006096 |
Table 5: The selected DEGs about DMH induction (p value<0.05 and FDR<0.05).
Cytochromes P450s (P450s) are a superfamily of enzymes that catalyze the oxidation of organic substances, including the biotransformation of numerous endobiotics (e.g., steroids, fatty acids, and eicosanoids) as well as the detoxification or bioactivation of a variety of xenobiotics. CYPs are the major enzymes involved in drug metabolism. They have the ability to detoxify. Many drugs may increase or decrease the activity of various CYP isozymes either by inducing the biosynthesis of an isozyme (enzyme induction) or by directly inhibiting the activity of the CYP (enzyme inhibition). Obviously DMH inhibited most of the CYP activity. If one drug inhibits the CYP-mediated metabolism of another drug, the second drug may accumulate within the body to toxic levels [17-19]. It's probably one of the causes of tumor.
Myc (c-Myc) is a regulator gene that codes for a transcription factor. The protein encoded by this gene is a multifunctional, nuclear phosphoprotein that plays a role in cell cycle progression, apoptosis and cellular transformation. A mutated version of Myc is found in many cancers, which causes Myc to be constitutively (persistently) expressed. This leads to the unregulated expression of many genes, some of which are involved in cell proliferation, and results in the formation of cancer. Malfunctions in Myc have also been found in carcinoma of the cervix, colon, breast, lung and stomach. Therefore Myc is thus viewed as a promising target for anti-cancer drugs [20]. Myc is activated upon various mitogenic signals such as serum stimulation or by Wnt, Shh and EGF [21]. In our experiments Myc and Wnt3 was upregulated by 2.08 times and 2.14 times respectively. Our results are consistent with these findings (Table 6).
| Gene | Fold change | p value | FDR | pathway or term |
|---|---|---|---|---|
| Myc | 2.0819 | 0.013 | 0.041 | GO:0042474 |
| HK2 | 2.4181 | 0.0014 | 0.046 | GO:0006096 |
| Pfk1 | 2.1614 | 0.015 | 0.037 | ko01200 |
| Tigar | 0.4956 | 0.033 | 0.0384 | |
| Sco2 | 0.2593 | 0.011 | 0.046 | GO:0005743 |
| Gls2 | 0.4573 | 0.048 | 0.033 | GO:0005739 |
Table 6: The selected DEGs about chronic constipation induction (p value<0.05 and FDR<0.05).
It has long been known that most solid tumors utilize aerobic glycolysis/lactic acid fermentation (the Warburg effect) in order to provide sufficient energy for cell metabolism, as well as to synthesize key membrane components and other cellular building materials [22]. Hexokinase 2 also known as HK2 is an enzyme which in humans is encoded by the HK2 gene on chromosome 2 and HK2 is the rate limiting enzyme in glycolysis. Expression of this gene is insulin-responsive, and studies in rat suggest that it is involved in the increased rate of glycolysis seen in rapidly growing cancer cells. HK2 is highly expressed in several cancers, including breast cancer and colon cancer. Its role in coupling ATP from oxidative phosphorylation to the rate-limiting step of glycolysis may help drive the tumor cells’ growth [23]. In literature [24] HK2 expression is enhanced by Myc and our experiment result the HK2 and Myc were up-regulated significantly. It showed that our results agree with literature description.
Phosphofructokinase-1 (Pfk1) is one of the most important regulatory enzymes and it is a key enzyme in glycolytic pathway of tumor cells [25]. TIGAR (TP53-induced glycolysis and apoptosis regulator) inhibits the activity of the rate limiting enzyme (phosphate kinase 1, Pfk1) in glycolysis. Therefore it inhibits glycolysis and promotes the pentose phosphate bypass pathways [26]. In our experiment results TIGAR was downregulated and Pfk1 was up-regulated significantly. It showed that TIGAR was inhibited and Pfk1 was activated.
Sco2 and Gls2 are associated with mitochondrial aerobic respiration. Mammalian cytochrome c oxidase (COX) catalyses the transfer of reducing equivalents from cytochrome c to molecular oxygen and pumps protons across the inner mitochondrial membrane [27]. GLS2 has interesting molecular relationships with tumor progression and cancer. Glutaminase 2 negatively regulates the PI3K/AKT signaling and shows tumor suppression activity in human hepatocellular carcinoma [27]. In our experiment results Sco2 and Gls2 were inhibited and this means that mitochondrial aerobic respiration was inhibited. This conformed to the tumor characteristics.
Conclusion
The chemicals and chronic constipation are causes of intestinal tumor. In order to make clear the differences between them disease model was successfully established. The model was used as a model for evaluating the effects of chemical and chronic constipation induction of intestinal tumor for understanding their different mechanisms. The transcriptomes of mice Intestinal cells were used to sequence through highthroughput analysis. KEGG and GO database were used to identify metabolic pathways and related genes. Through the comparison among different experimental groups the DEGs were identified. These DEGs were mapped to GO terms and KEGG pathways. Our experiment results showed the carcinogenic mechanisms about DMH and chronic constipation inductions are different. But they are both closely related to aerobic glycolysis.
Acknowledgement
National Natural Science Foundation of China (NSFC) (61363061) and Advanced and Characteristic Key Biological Disciplines of Yunnan Province (project serial code: 50097505) and the thesis of "Scientific and Technological Innovation Team Construction Project for Protection and Utilization of Under-forest Biological Resources (project serial code: 51400605)" is completed through joint support.
References
- Wang X, Lyu X, Wang W. The association between constipation and the risk of colorectal cancer: a Meta-analysis. Chinese J Clin 2014; 20: 3634-3639.
- Li G, Wang Y, Tang L. Advances of functional constipation. Chinese J Gerontol 2011; 12: 2372-2375.
- Hameed A, Farooq T, Hameed A. Role of gut probiotic microbiota in the apoptosis of gastrointestinal cancer. Oxid Commun 2016; 1: 214-222.
- Liu J, Ji Y, Chen M. Advances of pharmacological researches in constipation animal model. China J Exp Trad Med Form 2012; 22: 353-356.
- Zackular JP, Baxter NT, Iverson KD, Sadler WD, Petrosino JF. The gut microbiome modulates colon tumorigenesis. M Bio 2013; 4: 00692-00613.
- Luan Y, Mao D, Li Y. Effect of chronic constipation on dimethylhydrazine-induced intestinal cancer in Kunming mice. J Balkan Tribol Assoc 2016; 12.
- Anna CP, Frederick KK, Laurence DP. Interactions between the colonic transcriptome, metabolome, and microbiome in mouse models of obesity-induced intestinal cancer. Physiol Genom 2016; 48.
- Baoku Q, Xingsi Q, Zhihui Y. Pathway analysis of genome-wide association study and transcriptome data highlights new biological pathways in colorectal cancer. Mol Gene Genom 2015; 290: 603-610.
- CC L, DL C, Sun F. FERMT1 mediates epithelial-mesenchymal transition to promote colon cancer metastasis via modulation of beta-catenin transcriptional activity. Oncogene 2016; 9.
- Keiichiro S, Masahiro A, Reiji K. Transcription factors c-Myc and CDX2 mediate E-selectin ligand expression in colon cancer cells undergoing EGF/bFGF-induced epithelial-mesenchymal transition. PNAS 2012; 109: 7776-7781.
- Wang C, Chen J, Shi Y. Research progress of non-coding RNA in gastrointestinal stromal tumor. China Oncol 2015; 25.
- https: //pypi.python.org/pypi/cutadapt/
- http: //blast.ncbi.nlm.nih.gov/ Blast.cgi? CMD= Web&PAGE_TYPE = BlastDocs& DOC_TYPE=Download
- Schmieder R, Edwards R. Quality control and preprocessing of metagenomic datasets. Bioinformatics 2011; 27: 863-864.
- Kim D, Pertea G, Trapnell C. TopHat2: accurate alignment of transcriptomes in the presence of insertions, deletions and gene fusions. Genome Biol 2013; 14: 36.
- Trapnell C. Transcript assembly and quantification by RNA-Seq reveals unannotated transcripts and isoform switching during cell differentiation. Nat Biotechnol 2010; 28: 511-515.
- http: //www.kegg.jp/
- http: //samtools.sourceforge.net/
- http: //www.geneontology.org/
- https: //en.wikipedia.org/wiki/Cytochrome_P450
- Fowler T, Ghatak P, Price DH, Conaway R, Conaway J. Regulation of MYC expression and differential JQ1 sensitivity in cancer cells. PLoS One 2014; 9: e87003.
- Campisi J, Gray HE, Pardee AB. Cell-cycle control of c-myc but not c-ras expression is lost following chemical transformation. Cell 1984; 36: 241-247.
- Perroud B, Ishimaru T, Borowsky AD, Weiss RH. Grade-dependent proteomics characterization of kidney cancer. Mol Cell Proteom 2008; 8: 971-985.
- Peng Q, Zhou J, Zhou Q. Silencing hexokinase II gene sensitizes human colon cancer cells to 5-fluorouracil. Hepato-Gastroenterol 2009; 56: 355-360.
- Kim JW, Gao P, Liu YC. Hypoxia-inducible factor 1 and dysregulated c-Myc cooperatively induce vascular endothelial growth factor and metabolic switches hexokinase 2 and pyruvate dehydrogenase kinase 1. Mol Cell Biol 2007; 27: 7381-7393.
- Yi W, Clark PM, Mason DE. PFK1 glycosylation is a key regulator of cancer cell growth and central metabolic pathways. Science 2012; 337: 975-988.
- Karim B, Atsushi T, Mary AS. TIGAR, a p53-inducible regulator of glycolysis and apoptosis. Cell 2006; 7: 107-120.
- Liu J, Zhang C, Lin M. Glutaminase 2 negatively regulates the PI3K/AKT signaling and shows tumor suppression activity in human hepatocellular carcinoma. Oncotarget 2014; 5: 2635-2547.