ISSN: 0970-938X (Print) | 0976-1683 (Electronic)
Biomedical Research
An International Journal of Medical Sciences
Research Article - Biomedical Research (2018) Computational Life Sciences and Smarter Technological Advancement: Edition: II
Retinal disease diagnosis by morphological feature extraction and SVM classification of retinal blood vessels
DOI: 10.4066/biomedicalresearch.29-16-2320
Visit for more related articles at Biomedical ResearchRetinal vessel segmentation is an important division of automated retinal disease screening systems. The morphological variations of the retinal blood vessels correspond with the chances of cardiovascular and other related diseases. The incorrect detection of the blood vessels because of the misclassifications get reflected in the measurement results and results in the physicians advising incorrect strategies of diagnosis. In the same way, the pharmaceutical experts who prepare the drugs for diagnosis and medicines might be misdirected by this problem of misclassification. The available vessel segment graph doesn’t help in eliminating the Optic Disc (OD) boundary there by causing OD pixels misdetection, which intersects with the blood vessels. Therefore in the earlier work, the OD segmentation is carried outmaking use of discrete anisotropic filter and Particle Swarm Optimization whereas Fuzzy Neural Network (FNN) classifier has been utilized for blood vessel segmentation. But, the morphological variations are not detected accurately without an efficient feature extraction and selection process. Therefore in this work, the extraction of the geometric properties of blood vessel features are carried outmaking use of Grey Level Co-occurrence Matrix (GLCM) and the feature selection is conducted employing Mutual Information and Naive Bayesian Classifier. In this work, the noise elimination is performed applying Modified Kalman filter with image enhancement making use of the Hybrid PCA technique. The OD segmentation process is improved by using the Discrete Anisotropic Filter and Bee colony algorithm. At last, the classification of the true blood vessels is done by making use of SVM classifier. Therefore the retinal blood vessels are accurately classified considering the morphological changes that can be noticed from the experimental results. Therefore this technique yields an effective platform for suitable medicinal preparation and a precise diagnosis of retinal diseases.
Keywords
Retinal vessel segmentation, Optic Disc, Fuzzy Neural Network, Grey Level Co-occurrence matrix, Mutual Information, Naive Bayesian Classifier, Bee colony algorithm, SVM.
Introduction
Retina forms the inner coat of the eye that, in turn, is a lightsensitive layer of tissue. There are several inherited and developed diseases or disorders, which might impact the retina. This can be detected only by the analysis of the retinal images. Retinal images get influenced by every factor affecting the body vasculature generally. In addition, the eye is the very distinct region of the human body in which the vascular condition could be observed directly in vivo. The eye diseases such as choroidal neovascularization [1] and retinal artery occlusion [2], also influence some changes in the retinal vasculature. For the above reasons here, the segmentation of retinal images could be a precious help in the detection and follow-up of different pathological states, in the form of a way of identifying and characterizing any changes in the blood vessels over time. Automated detection and vasculature analysis can help in implementing the screening programs and drug preparation for diabetic retinopathy [3], foveal avascular region detection [4], arteriolar narrowing [5], and computer aided laser surgery. The automated production of retinal maps and the extraction of branch points have been utilized for temporal or multimodal image registration, retinal image mosaic synthesis [6], optic disk identification and fovea localization [7]. Also, the retinal vascular tree is observed to be distinct for every person and could be utilized for biometric identification [8]. Manually segmenting the retinal blood vessels is a time consuming and difficult task, also requiring training and skill. Besides, they need the accurate extraction of unique vessels from a retinal image. In order to resolve this issue in the approach available [9], a new method is introduced, which uses the global information about the segmented vascular structure for the accurate identification of true vessels in a retinal image. This mechanism uses the candidate generation and expertize knowledge for pruning the search space for the identification of true vessels. Nonetheless, this technique carries out vessel segmentation without carrying out OD boundary elimination leading to critical misclassifications owing to OD pixels misdetection, which intersect the blood vessels. Artificial Neural Networks (ANNs) have been widely examined for the segmentation of retinal features like the vasculature [10] rendering classifications on the basis of the statistical probabilities instead of objective reasoning. These neural networks use the mathematical weights to determine the probability of the input data, which belongs to a specific output. This kind of weighting system could be adopted by means of training the network with the data of known output generally with a feedback technique to permit retraining.
Nekovei and Ying [11] suggested an approach employing a back-propagation network for detecting the blood vessels in angiography. The technique uses the neural network to the angiogram pixels directly with no earlier feature detection. Then the ground truth images of manually labeled angiograms are utilized in the form of the training set for setting the weights of the network. A changed version of the general delta-rule is employed forgetting these weights. Marin et al. [12] introduced a supervised methodology based on neural network for the segmenting the retinal vessels. The technique makes use of a 7-D feature vector comprising of gray-level and moment invariant-based features. Then a multilayer feed forward neural network is used for training and classification. One set back in the neural network approach is the amount of time that it consumes to ‘train’ the network to form the training data for the purpose of segmentation.
Niemeijer [13] proposed the extraction of a feature vector for every pixel consisting of the green plane of the RGB image along with the responses of a Gaussian matched filter and its first and second order derivatives on the scales of 1, 2, 4, 8, 16 pixels. Then the k-Nearest Neighbor (k-NN) algorithm is used for estimating the probability of the pixel that belongs to a vessel. Thereafter, the binary vasculature structure is got by means of thresholding the probability map. Staal [14] introduced a ridge based vessel segmentation technique from colored images of the retina that makes the best use of the intrinsic property concerned with the vessels being elongated structures. Feature selection is carried out by employing a sequential forward selection technique whereas a k-NN classifier is utilized for classification. But, the demerits of KNN classifier are its abundant storage needs and computation wise intensive recall, which deteriorates the performance.
An automated hybrid technique consisting of the integration of mathematical morphology and a fuzzy clustering algorithm is shown by Yang et al. [15]. The enhancement of the blood vessels are performed and then the background is eliminated with a morphological top-hat operation and after this, the vessels are extracted by means of fuzzy clustering. Lupascu et al. [16] introduced another supervised technique referred to as the feature-based AdaBoost classifier (FABC) for the segmentation of vessel. The 41-D feature vector is a huge set of measurements at diverse spatial scales, inclusive of the output of different filters like Gaussian, 2-D Gabor wavelet transform, and ridges through the numerical estimation of the differential properties of the intensity surface. This technique does not deal with the problems concerned with the connection of broken vessel segments and few local ambiguities existing because of the convergence of several and differently bent vessels.
Yedidya et al. [17] demonstrated an automated technique for the segmentation of the blood vessels on the basis of the tracking the center of the vessels making use of the Kalman filter. Then a linear model is used for tracking the blood vessels, appropriate for detecting both of the wide and thin vessels in the case of noisy images. Tracking is then performed for all the seed points that are detected, but it retraces the segmentation for seeds with less confidence. The Kalman filtering method has been used in the earlier method [18] for the noise elimination process. However, sometimes the Kalman filter method results in an increase in the computational cost. Therefore the proposed technique employs the Modified Kalman filter for the noise elimination. The proposed technique is described in the section that follows. So in the earlier work [18], automatic vessel segmentation based elimination of OD boundary is presented. This schemeuses Discrete Anisotropic Filter (DAF) with Particle Swarm Optimization (PSO) for OD segmentation when the segmentation of the blood vessels are done utilizing Fuzzy Neural network classifiers.
This work introduces a novel automatic vessel segmentation employing SVM classifier. In this work, the Discrete Anisotropic Filter (DAF) with Bee colony algorithm is applied for OD segmentation. The detection of the morphological changes are done through the analysis of the geometrical characteristics of the blood vessel features that are extracted employing GLCM whilst selecting them is performed employing Mutual Information (MI) and Naive Bayesian Classifier (NBC). At last the segmentation of the true blood vessels are done making use of SVM. This mechanism improves the accuracy involved in detection of the retinal diseases and helps in delivery appropriate drugs for the purpose of diagnosis. The rest of this work is organized as below: section 2 describes the proposed technique elaborately. Section 3 discusses the performance evaluation results when section 4 provides a conclusion of this work.
Proposed Methodology
This section discusses about the newly introduced true vessel segmentation methodology, which is on the basis of the SVM classifier. The overall architecture is illustrated in Figure 1. The approach proposed uses a Modified Kalman filter for the noise elimination process. The image enhancement process is carried out by using Hybrid PCA (Principle Component Analysis). Thereafter the OD boundary detection and segmentation is carried out for eliminating the OD utilizing DAF with Bee colony algorithm. Thereafter the extraction of the features is done applying GLCM whereas the selection is performed utilizing MI and NBC. At last, on the basis of the features selected, the true blood vessel segmentation is carried outmaking use of SVM classifier. This research is performed by making use of the publicly available database referred to as Digital Retinal Images for Vessel Extraction (DRIVE). This process can improve the accuracy of retinal disease identification that are, in turn, are sent to the physicians and pharmaceutical scientists for the purpose of diagnosis and preparation of drug.

Figure 1: Overall architecture of proposed classification approach.
In the pre-processing stage, the image denoising is carried out and then the image enhancement follows.
Modified kalman filtering for noise removal
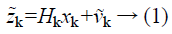
The Kalman filter needs the noise to be either Gaussian or having finite variance [19], and therefore it does not apply to linear systems having non-Gaussian noise with infinite variance. Also the inaccuracy with respect to the Kalman filter for removing the non-Gaussian Levy noise results in the introduction of a modified Kalman filter. The Levy noise can then be approximated by incrementing the respective Levy process for each time step. By means of Levy-Ito theorem [20], a Levy process could be divided into the sum of a Gaussian process and a pure jump process. It is indicated that the small jumps corresponding a Levy process can actually be approximated by means of a Gaussian process [21]. In this modified filtering technique, the actual Levy noise is modified into a Gaussian white noise through the clipping off of its highly big values. Let ṽk indicate the clipped version of the Levy measurement disturbance vk, and let z̃k refer to the respective clipped observation. This way
But, practically, the measurement noise, vk is unknown, and this algorithm clips the observation zk in place of vk in a component-wise means through the below operation:
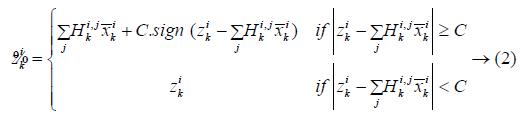
where C refers to some positive threshold value,  and
and  indicate the respective ith components of the vectors zk and x̃k, and
  stands for the ith component of the vector
  . C is decided by the statistical characteristics of the measurement noise vk. Substituting the observation value zk in Kalman filter by its clipped value,
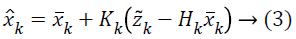
Finding the solution of Kalman gain Kk by reducing 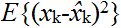 ,
,
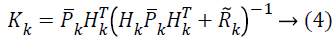 Where R̃k indicates the covariance matrix of ṽk, which is defined as
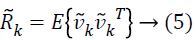
In conventional Kalman filter, the covariance matrices Qk and Rk are supposed to be known, though the estimation of the covariance matrices Qk and Rk is frequently a tedious task. But, in modified Kalman filter, just Qk is presumed to be known when R̃k is estimated. Therefore equation (4) and (5) can be expressed as
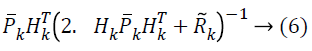
Where
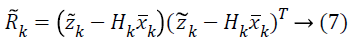
By merging equations (2), (3), (6) and (7), the Modified Kalman filter is got that can eliminate both the Gaussian and non-Gaussian noise from the retinal images.
Image enhancement using hybrid PCA
In Principal Component Analysis (PCA) technique [22], the principal components are found by computing the Eigen values of the co-variance matrix for the input color retinal image. In this Hybrid technique, PCA-Contrast enhancement, the covariance matrix is expressed as
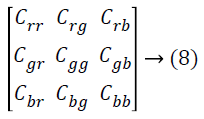
The covariance is calculated by
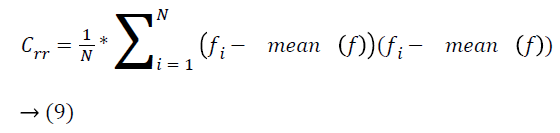
where, ‘f ‘ refers to the input image, Crr is associated with the covariance between the red components of the image, Crg is associated with the covariance between red and green component of the retinal image and more. The first principal is associated with the Eigen vector of the greatest Eigen value, comprises of most of the structural contrast and information. Therefore, the input image is projected onto the orientation of the principal component given by
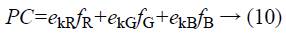
where, fR, fG, and fB refer to the red, green and blue components of input image; ekR, ekG and ekB stands for the first, second and third element of the Eigen vector of maximum Eigen value. Next, the Contrast enhancement is carried out on the first principal component for improving the visual perception. The transformation for contrast stretching is provided by,
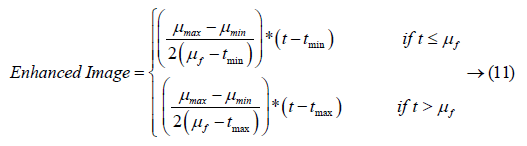
where, μmax= 255, μmin= 0; μf refers to the mean value of the image inside the window; tmax indicates the maximum gray level of the image; tmin stands for the minimum gray level of the image; r indicates the contrast increasing factor. Figure 2 illustrates the input retinal image and the pre-processed image after the application of the noise Modified Kalman filter and Hybrid PCA.

Figure 2: Retinal Image after Pre-processing.
OD segmentation using DAF and bee colony optimization
The OD segmentation in the earlier work [18] has been performed employing the DAF and PSO algorithm. The green channel of the retinal image is appropriate for detecting the blood vessel and therefore the vessels having OD boundary get detected and isolated from the green channel. The discrete anisotropic filter process with PSO optimization is helpful in attaining this need. For the purpose of minimizing the false OD elimination, a more effective bee colony optimization algorithm is proposed instead of PSO. The OD elimination is performed by DAF with the calculation of the divergence corresponding to the Laplacian and the gradient operators of the image. The process of DAF is conducted as in [18]. Once the noise of the retinal image is eliminated, the Bee colony optimization gets initialized. The procedure of bee colony optimization is provided as below [23]:
Pseudo code of the Bee colony algorithm:
1. Initialization of bees
2. Make the employed bees to move to the food sources and assess their nectar amounts.
3. Position the onlookers based on the nectar amounts got by the employed bees
4. An onlooker bee decides and assesses the nectar amount and compares it with the neighbors and substitutes it with the best pixel value
5. Send the scouts for finding abandoned food sources
6. Remember the best food sources got until now7. In case, a termination criterion is not met, go to step 2; else terminate the procedure and display the best food source received until now.
The Bee colony algorithm presumes the availability of a set of operations, which might be identical to few features of the honey bee behavior. For example, every solution within the search space is inclusive of a parameter set indicating the locations of food source. The “fitness value” indicates the food source quality, which is linked strongly to the location of the food. The procedure resembles the bee’s search for good food sources rendering an analogous process for getting the optimal solution.
Generally, the position of ith food source is indicate d as Si={Si1,Si2,…SiD}. Then the information gets shared by the employed bees for going back to the hive, the onlooker beesmove to the location of food source found by employed bees at depending on the probability Probi that is defined by
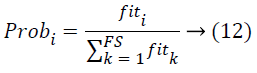
Where, FS refers to the total number of Food Sources. Fitness value is computed by making use of the equation.
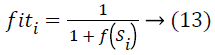
Where f(Si) represents theconsidered objective function. Thereafter, the onlooker discovers its food source in the location of Si by making use of the equation below
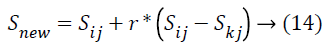
Where Snew refers to the new food source that is exploited by the onlooker and k refers to the solution in the neighborhood of I, r indicates a random number in the range -1 to +1 and j refers to the dimension of the problem under consideration. In case, the new fitness value is relatively better compared to the fitness value attained till now, the bee goes to the new food source, else it keeps the old one. Each bee will search for a better food source for a particular number of cycles or limited value and in case the fitness value is not improving then that specific bee goes on to become the scout bee. Figure 3 illustrates the process of Retinal Image OD elimination. During the convergence of bee colony, the centers obtained are utilized to be the initial solution of the local search. Now, the aim is about updating the cluster center obtained so that it increases the resultant vessel binary image total thinness measure. The thinness measure [24] is expressed by
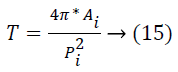
Where Ai refers to the total area of individually connected components and refers to the total perimeter of individual connected components, and this is exploitedto be the indicator for the efficiency of the binary image obtained as the vessels with small diameter are highlighted making use of this measure. Figure 4 illustrates the OD elimination shown in the actual retinal image. This image is utilized for feature extraction and vessel classification process. This process maximizes the reliability of the results so that the physician’s work is simplified.

Figure 3: OD elimination process.

Figure 4: OD Eliminated Retinal image.
Feature extraction using GLCM
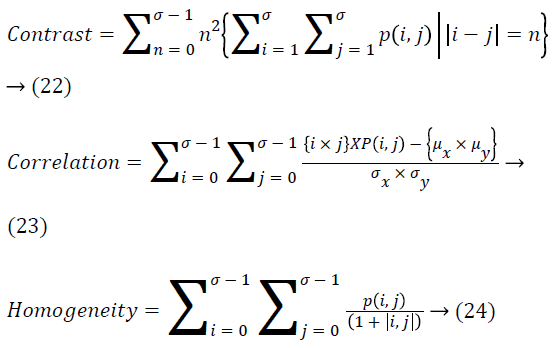
The strategy used for extracting the features employing the Gray Level Co-occurrence Matrix (GLCM) is about constructing the GLCM over the whole image. Retinal image has several clinical structures like optic disc and vessels that act as the severe challenge in detecting the exudates. In this work, the authors have introduced a novel technique where the input image is separated into multiple smaller blocks with the sizes 36X37 pixels. On the basis of the content, the block gets categorized. Then the blocks are numbered from 1-320. The blocks are segregated into four categories: normal blocks, exuadates blocks, vessel blocks and OD blocks. Then, the first order and second order features are extracted from these blocks. A GLCM is a matrix in which the number of rows and columns is equivalent to the number of gray levels, G, in the image. The matrix element P (i, j | Δx, Δy) refers to the relative frequency with which two pixels, isolated by a pixel distance (Δx, Δy), are observed within a neighbourhood given, one having the intensity ‘i’ and then the other having the intensity ‘j’. The matrix element P (i, j | d, ө) comprises of the second order statistical probability values for the variations between gray levels ‘i’ and ‘j’ at a specific displacement distance d and at a specific angle (ө). The GLCM’s have huge sensitivity towards the size of the texture samples over which their estimation is done. This way, the number of gray levels is frequently minimized and the construction of GLCM is done. From the constructed GLCM, the features extraction is carried out [25]. Several intensity features, extracted from the color retinal images are provided as follows
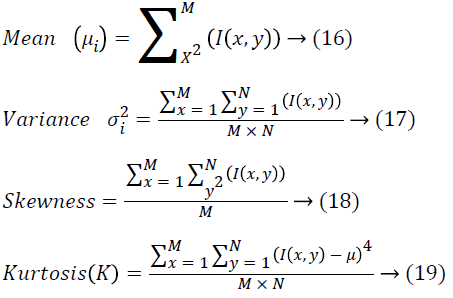
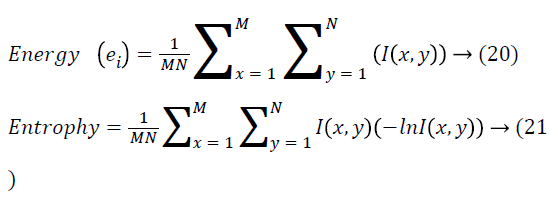
Different second order features dependent on GLCM that are extracted from input image are seen as follows.
Feature selection using mutual information and naive Bayesian classifier
Mutual Information (MI) of two random features quantitatively measures the amount of dependence (information) seen between the two features [26]. In contrast to the correlation coefficient, which can just manage the linear dependence, MI is capable of detecting both the linear and non-linear relationships between features, a characteristic, which has rendered it to be a desirable choice for the purpose of feature selection in retinal images. Generally, the MI of a pair of features X and Y is defined by means of the Probability Density Function (PDF) of X, Y and joint variables (X, Y). In case the pdf of X, Y and joint (X, Y) is represented as fx, fy and fX,Y correspondingly.
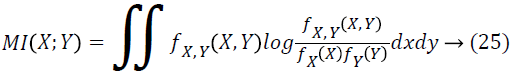
The variables X and Y are entirely independent, so the joint pdf is equivalent to the product of pdf of X and pdf of Y that is fX,Y=fX*fY and then MI equals to zero
In addition, MI can be represented in terms of entropy, another information theory measuring the uncertainty in random variables. Entropy of X is represented as:
On the basis of entropy, MI is given as:
h(Y/X) refers to the uncertainty about Y while X is known. Moreover, if X and Y are independent: h(Y/X)= h(Y) and MI(X; Y) =0. Based on the definitions of MI for the features in retinal images, the MI is calculated for every pair of features. Thereafter the Naïve Bayesian classifier [27] does the sorting of the feature pairs depending on the MI. The naive Bayesian classifier is actually a simple likelihood ratio test assuming about the conditional independence among the features. The predicted class is based on the sign of
After simplifying, the feature coefficients could be sorted on the basis of
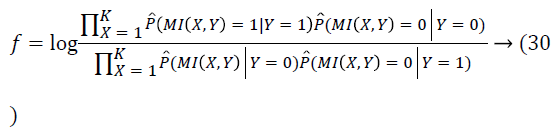
This way, the features are chosen in accordance with the Miemploying the Naives Bayesian classifier. And the features of retinal images selected are utilized in the true classification of the blood vessels.
True blood vessel classification using SVM classifier
The segmentation of the true blood vessels is carried outmaking use of pixel based classification technique. Vessel segmentation technique is introduced by using the Support vector Machine that has the capability of learning nonlinear distribution of the vessels with no previous knowledge [28]. The classifier utilized in this research is the supervised technique like Support Vector Machine with Radial Basis Function (RBF) kernel that needs data for training and there after employed as reference for the automatic classification of new data. SVM can yield accurate and reliable classification results on a solid theoretical basis, even while the input data are non-monotonic and are non-linearly separable. In the case of a linear classifier, a p-dimensional vector is divided by a p-1-dimensional hyper plane. Let (xi , yi ), i = 1, 2,. . ., N indicate the training examples of the classification issue, in which xi R ∫ n refers to the pattern, which has to be classified and yi ϵ {-1, +1}, represents its ∫ class labels. The issue is about constructing a classifier [i.e., a decision function f(x)], which can accurately classify an input pattern x, not necessarily obtained from the training set. There is a linear function with the form
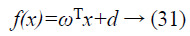
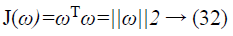
In such a way that for every training example xi , the function renders f(xi) ≥ 0 for yi= +1, and f(xi )<0 for yi= -1. Otherwise said, the training examples from the two different classes are isolated by the hyper plane f(x)=ωTx+b=0. For a training setgiven, there mightbeseveral hyper planes, maximizing the isolating margin between the two classes. SVM gets the hyper plane, which leads to the greatest separation between the decision function values for the “borderline” examples from the two classes. Mathematically, this hyper plane can be found by minimizing the cost function:
Kernel representation renders an alternate solution by emphasizing the data into a high dimensional feature space for the purpose of increasing the computational potential of the linear learning machines. A kernel stands for a function k, in such a way that for all x, z ϵ X
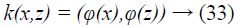
Where refers to a mapping from X to an (inner product) feature space F. In this work, RBF kernel is utilized for classifying the pixels in the retinal images. The important benefit of RBF kernel lies with their localized and finite responses. RBF kernel does the nonlinear mapping of the samples in to higher dimensional space and therefore it, on the contrary to the linear kernel can manage the case in which the relation between class labels and attributes shows non linearity. The Radial Basis Function (RBF) is defined below
where the σ refers to Gaussian kernel constant (standard deviation). Therefore the true blood vessels are uniquely classified from the false blood vessels having a huge accuracy exploiting the SVM classifiers. Figure 5 illustrates the results of the true vessel detection and classification based on SVM.

Figure 5: True Blood Vessel Classification using SVM.
These classification results can be used for detecting the retinal and also the associated cardiovascular diseases easily with good accuracy. It aids the physicians in offering suitable diagnosis and treatment. The bigger picture of these results can assist the pharmaceuticals in the analysis of the retinal disorders and associated diseases for making the necessary medicines.
Experimental Results
The SVM dependent evaluation of retinal image is implemented in MATLAB version 12. In practice, vessels are highlighted out with clarity from the background in the green channel for images in the DRIVE database [28]. Then the performance of the SVM based vessel segmentation is assessed and then compared with the available Post Processing Step (PPS) and the Fuzzy Neural Network (FNN) [18] with the support of the below parameters, which are Sensitivity=TP/(TP +FN)), Specificity=TN/(TN+FP)), Positive predictive value (Ppv)=TP/ (TP+FP), Negative predictive value (Npv)=TN/(TN +FN), Accuracy=(TP+TN)/(TP+FN+TN+FP), Figure 6 illustrates the true vessel classified retinal images making use of FNN and SVM.

Figure 6: Blood vessel classification.
The graphs of comparison illustrated in terms of the performance parameters are provided as in Figures 7-10.
Figure 7 illustrates the graphical comparison of the PPS, FNN and SVM based true vessel classification given in terms of accuracy. It can be observed from the graph that the SVM based classification proposed yields the vessel classification with greater accuracy compared to the other mechanisms. Figure 8 illustrates the comparison of sensitivity of PPS, FNN and SVM schemes for the purpose of retinal vessel classification. It indicates that the SVM based technique proposed does the classification of blood vessels with huge sensitivity. It is because of the effective extraction of the GLCM features for accurately carrying out the vessel classification.

Figure 7: Accuracy comparison.

Figure 8: Sensitivity comparison.
Figure 9 illustrates the graphical comparison made of PPS, FNN and SVM based vessel classifications with regard to specificity. SVM based vessel classification shows great specificity denoting the OD elimination making use of the DAF & bee colony shows better performance yielding a good resolution of true vessel classification. Figure 10 yields the graphical comparison of PPS, FNN and SVM based vessel classification with regard to precision, in which the SVM technique possesses greater values. It can be concluded from the results that the SVM based vessel classification renders a hugely accurate classification compared to the other schemes. Therefore it can be used for the process of medical diagnosis of retinal diseases.

Figure 9: Specificity comparison.

Figure 10: Precision comparison.
Conclusion
This paper introduced a new retinal blood vessel classification technique on the basis of SVM. In this methodology, the preprocessing is carried out making use of Modified Kalman filter and Hybrid PCA. Thereafter the retinal image goes through an OD elimination process making use of DAF & Bee colony algorithm. Afterwards, the GLCMN features get extracted and then selected on the basis of Mutual information & Naïve Bayesian classifier. At last, the SVM based classifier is employed for true and false vessel classification. The GLCM features inclusion of the retinal images improves the accuracy in the classification of vessel. The results show that the SVM based vessel classification renders a hugely accurate classification along with high values of accuracy, sensitivity, specificity and precision. This assists the physicians and pharmaceuticals in offering suitable diagnosis and preparation of drugs. Even though the approach proposed improves vessel classification accuracy, yet there is some scope for improving. This new approach does the true vessels classification from the false vessels but the elimination of these false blood vessels can improve the classification accuracy more. This can be a topic for future research.
References
- Kanski JJ, Bowling B. Clinical ophthalmology: a systematic approach. Elsevier Health Sci 2011.
- Hayreh SS, Zimmerman MB. Central retinal artery occlusion: visual outcome. Am J Ophthalmol 2005; 140: 376.
- Teng T, Lefley M, Claremont D. Progress towards automated diabetic ocular screening: a review of image analysis and intelligent systems for diabetic retinopathy. Med Biol Eng Comput 2002; 40: 2-13.
- Adel HM, Rasigni M, Conrath J, Bourennane S. Detection of the foveal avascular zone on retinal angiograms using Markov random fields. Digital Signal Process 2010; 20: 149-154.
- Grisan E, Ruggeri A. A divide etimpera strategy for automatic classification of retinal vessels into arteries and veins, in: Engineering in Medicine and Biology Society, 2003. Proceedings of the 25th Annual International Conference of the IEEE 2003; 891: 890-893.
- Fritzsche K, Can A, Shen H, Tsai C, Turner J, Tanenbuam HL, Stewart CV, Roysam B, Suri JS, Laxminarayan S. Automated model based segmentation, tracing and analysis of retinal vasculature from digital fundus images, in: State-of-The-Art Angiography, Applications and Plaque Imaging Using MR, CT Ultrasound and X-rays, Academic Press, 2003.
- Huiqi L, Chutatape O. Automated feature extraction in color retinal images by a model based approach. IEEE Transact Biomed Eng 2004; 51: 246-254.
- Marino C, Penedo G, Penas M, Carreira J, Gonzalez F. Personal authentication using digital retinal images. Pattern Anal Appl 2006; 9: 21-33.
- Lau QP, Lee ML, Hsu W, Wong TY. Simultaneously identifying all true vessels from segmented retinal images. IEEE Trans Biomed Eng 2013; 60: 1851-1858.
- Mendonca AM, Campilho A. Segmentation of retinal blood vessels by combining the detection of centerlines and morphological reconstruction. IEEE Trans Med Imaging 2006; 25: 1200-1213.
- Nekovei R, Sun Y. Back-propagation network and its configuration for blood vessel detection in angiograms. IEEE Trans Neural Netw 1995; 6: 64-72.
- Marin D, Aquino A, Gegundez-Arias ME, Bravo JM. A new supervised method for blood vessel segmentation in retinal images by using gray-level and moment invariants-based features. IEEE Transact Med Imaging 2011; 30: 146-158.
- Jayanthiladevi A. A Human Computer Interfacing Application . Int J Pharma Bio Sci 2016.
- Staal J, Abramoff MD, Niemeijer M, Viergever MA, van Ginneken B. Ridge-based vessel segmentation in color images of the retina. IEEE Transact Med Imaging 2004; 23: 501-509.
- Yang Y, Huang S, Rao N. An automatic hybrid method for retinal blood vessel extraction. Int J Appl Math Comput Sci 2008; 18: 399-407.
- Lupascu CA, Tegolo D, Trucco E. FABC: retinal vessel segmentation using AdaBoost. IEEE Trans Inf Technol Biomed 2010; 14: 1267-1274.
- Yedidya T, Hartley R. Tracking of blood vessels in retinal images using Kalman filter. In Digital Image Computing: Techniques and Applications (DICTA), 2008, IEEE.
- Princye PH, Kumari VV. Fuzzy Neural Network Classification of all True Vessels from Segmented Retinal Images. Asian J Res Soc Sci Humanities 2016; 6: 636-652.
- Grewal M, Andrews A. Kalman Filtering: Theory and Practice Using Matlab. John Wiley & Sons, 3rd Ed, USA, 2008.
- Applebaum D. L´evy Processes and Stochastic Calculus. Cambridge University Press, 2nd Ed, Cambridge, 2009.
- Asmussen S, Rosinski J. Approximation of small jumps of L´evy processes with a view towards simulation. J Appl Probability 2001; 38: 482-493.
- Morales S, Naranjo V, Angulo J, Alcaniz M. Automatic detection of optic disc based on PCA and mathematical morphology. IEEE Trans Med Imag 2013.
- Balasubramani K, Marcus K. Artificial bee colony algorithm to improve brain MR image segmentation. Int J Comput Sci Eng 2013.
- Emary E, Zawbaa HM, Hassanien AE, Schaefer G, Azar AT. Retinal blood vessel segmentation using bee colony optimisation and pattern search. International Joint Conference on Neural Networks (IJCNN), 2014, IEEE.
- Giraddi S, Pujari J, Seeri S. Role of GLCM features in Identifying Abnormalities in the Retinal Images. Int J Image Graphics Signal Process 2015; 7: 45.
- Sulaiman MA, Labadin J. Feature selection based on mutual information. 9th International Conference on InIT in Asia (CITA), 2015, IEEE.
- Bender A, Mussa HY, Glen RC, Reiling S. Molecular similarity searching using atom environments, information-based feature selection, and a naive Bayesian classifier. J Chem Informa Comput Sci 2004; 44: 170-178.
- Ricci E, Perfetti R. Retinal blood vessel segmentation using line operators and support vector classification. IEEE Trans Med Imaging 2007; 26: 1357-1365.
- Minu RI, Nagarajan G , Suresh A , Jayanthila Devi A. Cognitive Computational Semantic for high resolution image interpretation using artificial neural network. Biom Res 2016; 27: S306-S309.