ISSN: 0970-938X (Print) | 0976-1683 (Electronic)
Biomedical Research
An International Journal of Medical Sciences
Research Article - Biomedical Research (2017) Volume 28, Issue 16
Quantitative analysis of contrast-enhanced ultrasound in the dog's acute renal failure
Xiu Xia Fang*, Bing Hui Fan, Ai-Qing Zhao, Ping Ping and Cui Yan
The Affiliated Hospital of Inner Mangolia Medical University, Inner Mongolia, PR China
- *Corresponding Author:
- Xiu Xia Fang
The Affiliated Hospital of Inner Mangolia Medical University
Inner Mongolia, PR China
Accepted date: July 20, 2017
Purpose of present research was to prospectively test in dog model of ARF with hypothesis that the CEUS can quantitatively evaluate the perfusion changes of renal cortex in the early stage of the disease. The 15 healthy adult ARF dog models were injected intramuscularly with 50% glycerin into the hind legs followed by i.v. bolus 0.2 ml Sonovue in leg vein. Real time samples from dogs were collected with conventional and CEU examinations. The Blood serum Urea Nitrogen (BUN) and Serum Creatinine (SCr) level were tested along with kidney tissue sample of randomly selected dog. The converted parameters and blood test were compared using statistical software. Initial values of slope of Ascending curve (A), derived Peak Intensity (PI), Time to Peak (TTP), Area under Curve (AUC) were significantly high than the values before injection. In histopathological analysis no significant change was observed in 6 h after the injection of glycerin (P>0.05) and might be seen after 24 h (P<0.05). Quantitative analysis of CEU could monitor the changes of blood perfusion image of the renal cortex of the early renal function changes of dogs than SCr and BUN, has been more and more used in the diagnosis of clinical disease.
Keywords
Contrast-enhanced ultrasound (CEU), Quantitative analysis, Dogs, Acute renal failure (ARF)
Introduction
Acute Renal Failure (ARF) is characterized as the clinical syndrome which is identified by gradual and reversible reduction in Glomerular Filtration Rate (GFR). ARF is complicated in diagnosis by pathological process [1]. In very early stages of ARF, perfusion impairment is very common which usually precedes functional impairment. Valuable information can be obtained by accurately measuring renal perfusion rates in the early stage of ARF. Renal dysfunctions of ARF can be evaluated by various invasive and non-invasive techniques [2]. Among these techniques Magnetic Resonance Imaging (MRI), Single Photon Emission Computed Tomography (SPECT), multidetector Computed Tomography (CT) and positron Emission Tomography (ET) are most popular and very accurate in early detection of renal dysfunctions. However, these techniques suffered from various drawbacks related to quantification of renal perfusion and blood flow rates in ARF. These techniques are invasive, involves the use of ionizing radiations and also costly [3]. These techniques are not so sensitive and data available from these techniques varies from technique to technique at early stage of ARF. Conventional gray scale Ultrasonography (US) and Color Doppler Flow Imaging (CDFI) are widely recommended imaging tools for the examination of patients with ARF at very early stages. But these techniques also lack sensibility, specificity and angle dependency [4].
Since last few decades, Contrast Enhanced Ultrasound (CEUS) technology played vital role diagnosis and imaging of various internal tissues and organs. Contrast Enhanced Ultrasound (CEUS) technique is well known and widely accepted for diagnosis of liver lesions. CEUS allows renal perfusion imaging, with the use of gas-filled micro-bubbles to assess microvascular tissue perfusion, and is able to detect early stages of chronic renal allograft nephropathy [5]. In the world of ultrasound, use of contrast agent has opened new aspects for the diagnosis and evaluation of multiple organs including liver and kidney functioning. Since 2003, the European Federation of Societies for Ultrasound in Medicine and Biology (EFSUMB) study group has developed guidelines and protocols for the use CEUS, allowing a more standardized and reproducible practice of CEUS [6]. Assessment of microvasular tissue perfusion and early stage detection of chronic renal allograft nephropathy can be done by renal perfusion imaging by gas filled micro bubbles which can be function as red blood cell tracers [7]. These contrast agents are found to be very safe to renal system and rewarded for high tolerance and lack of radiation. So considering all these benefits of the CEUS it has been widely used for the diagnosis of kidney disorders like tumors, cystic lesions, cortical necrosis and trauma induced lesions. CEUS is found to be more sensitive when compared to contrast enhanced computed tomography for detection of cyst like lesions. CEUS can easily detect slower flow in smaller blood vessel hence proved more superior to color Doppler ultrasound in diagnosing renal infraction. In human beings, CEUS has already been applied for diagnosis and treatment of various kidney diseases like chronic kidney disease, kidney transplantation and acute kidney injury without any side effects due to contrast agent [8]. A reliable, non-invasive method for absolute quantification of renal perfusion in selective Region of Interest (ROI) in the cortex can be established by using an intravascular contrast agent.
Thus, considering all these advantages of CEUS, the purpose of present research was to prospectively test in dog model of ARF with hypothesis that the CEUS can quantitatively evaluate the perfusion changes of renal cortex in the early stage of the disease.
Experimental
Materials
Animal model: The study was conducted as per recommendations and approval of Animal Ethical Committee of Department of Ultrasound, The Affiliated Hospital of Inner Mongolia Medical University, Inner Mongolia, China. The project approval no. is IMMU/0472/CONT/12. About 15 healthy adult male dogs weighing approximately 10-14 kg were randomly selected for the study. The ARF dog model was established by injecting intramuscular injection of 50% glycerin (10 ml/kg) in to the hind legs of the dogs. General anaesthesia was introduced using intravenous injection of 3% pentobarbital (1 ml/kg). Care has been taken to make procedures animal friendly or to minimize pain level. SonoVue bolus injection (0.2 ml) was given intravenously through hind leg veins of dogs.
Methods
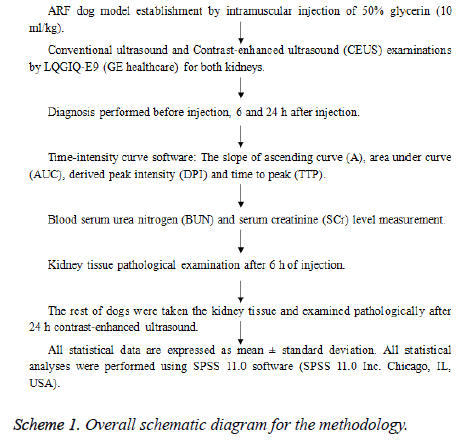
CEUS examination: The LQGIQ-E9 (GE healthcare) ultrasonic diagnostic apparatus and 3.5 MHz convex array probe (for kidneys) was used to perform conventional ultrasound and Contrast-Enhanced Ultrasound (CEUS). The diagnosis was performed before and after injecting animal (6 and 24 h). Real time Contrast-enhanced ultrasounds of renal cortex blood perfusion of dogs were collected successively. Only experienced sonographer was allowed to perform CEUS. The slope of Ascending curve (A), Area under Curve (AUC), Derived Peak Intensity (DPI) and Time to Peak (TTP) were measured in renal cortex of dogs using time-intensity curve software. The Blood serum Urea Nitrogen (BUN) and Serum Creatinine (SCr) level were tested before contrast-enhanced ultrasound. Animal was randomly selected to remove and pathologically examine the kidney tissue 6 h after the injection of glycerin. The sample of the kidney tissues of the remaining test animals was removed and examined pathologically after 24 h contrast-enhanced ultrasound. The comparison of the above parameters and blood test was done using statistically analyzed software. Conventional gray scale ultrasound examinations of the kidney was performed before injection of SonoVue and maximum longitudinal scanning plane that included the entire kidney was determined [9].
Statistical analyses
All statistical data are expressed as mean ± standard deviation. All statistical analyses were performed using SPSS 11.0 software (SPSS 11.0 Inc. Chicago, IL, USA). Comparisons between quantitative indexes of different stages were performed using random effects GLS regression. Bonferroni test was used for the comparison between SCr and BUN at different stages [10].
Real time perfusion of kidney
Real time perfusion of kidney study was conducted by using conventional ultrasound and Contrast-Enhanced Ultrasound (CEUS) examinations using LQGIQ-E9 (GE healthcare). In both the cases diagnosis was performed before and after injection (6 and 24 h). In CEUS examination in vivo gray scale showed real time flow, kidney perfusion while this type of observation was lacking in conventional ultrasound.
Histopathology and blood tests
The Blood serum Urea Nitrogen (BUN) and Serum Creatinine (SCr) level were tested before CEUS.
Overall schematic diagram for the methodology is represented as below (Scheme 1):
Results
ARF dog model (animal model)
The animals recovered from anesthesia and surgery did not show any sign or symptoms of pain or edema in the abdomen related to vascular occlusion of main renal artery. Histopathological analysis showed significant occlusion after 24 h of treatment.
Real time perfusion of kidney
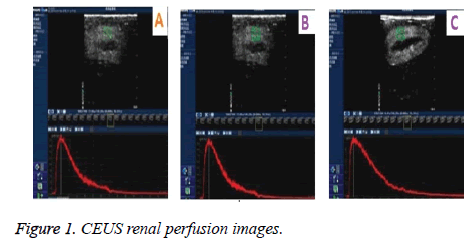
In CEUS continuous and gradual enhancement in renal arteries, small interlobular arteries in renal cortex to renal medullar arteries was observed. Conventional ultrasound demonstrated no obvious real time perfusion changes in both renal cortex. These observations clearly demonstrated superiority of CEUS as compared to gray scale ultrasound. Figure 1 shows CEUS renal perfusion images. Q-LAB quantification software was used for the plotting Time Intensity Curves (TIC) which was generated from the Region of Interest (ROI). Comparative perfusion indexes, and RI and PSV before and 6 h, 24 h after injection of glycerin in dog ARF model are represented in Tables 1 and 2.
| Time Points | A (dB/s) | α (1/s) | AUC (dB.s) | DPI (dB) | TPP (sec) |
|---|---|---|---|---|---|
| Before Injection | 2.01 ± 0.98 | 0.25 ± 0.24 | 145.7 ± 52.68 | 8.09 ± 4.45 | 7.22 ± 3.54 |
| Six hours after injection | 1.87 ± 1.90 | 0.12 ± 0.09 | 390.4 ± 65.90 | 10.11 ± 2.43 | 8.45 ± 4.90 |
| Twenty four hours after injection | 1.98 ± 0.09 | 0.19 ± 0.06 | 487.5 ± 50.24 | 8.34 ± 2.12 | 7.00 ± 3.65 |
Table 1. Comparative perfusion indexes before and 6 h, 24 h after injection of glycerin in dog ARF model.
| Index | Before injection | 6 h after injection | 24 h after injection |
|---|---|---|---|
| RI | 0.57 ± 0.24 | 0.62 ± 0.38 | 0.64 ± 0.54 |
| PSV (cm/s) | 97.87 ± 12.25 | 82.11 ± 14.50 | 73.24 ± 19.50 |
Table 2. RI and PSV before, 6 h and 24 h after injection of glycerin in dog ARF model.
Quantitative renal perfusion data
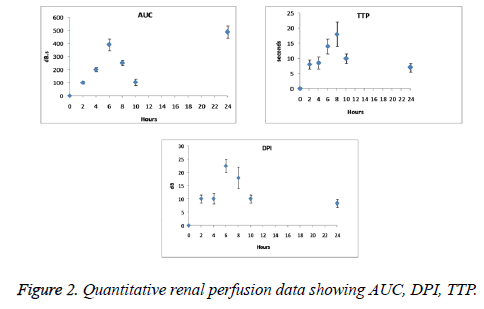
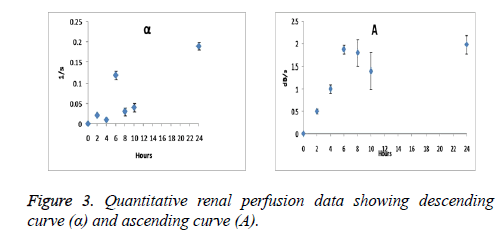
Quantitative indexes were found to be the function of time with continuous progression of ARF. As seen from Figures 2 and 3 AUC, DPI, TTP and the slope rate of descending curve (α) gradually increased, however the slope rate of ascending curve (A) decreased. Significant changes have been observed after 6 weeks of operation on DPI and TTP. DPI was observed from 18 ± 2 to 22.5 ± 2.5 dB and TTP from 12 ± 2 to 18 ± 4 s.
Histopathology and blood tests
Significant changes were observed after 8 week on BUN from 4.65 ± 0.04 to 12.5 ± 2.5 μmol/lit and SCr from 47.65 ± 2.5 to 98.5 ± 25.5 μmol/lit. BUN and SCr before, 6 h and 24 h after injection of glycerin in dog ARF model are represented in Table 3.
| Index | Before injection | 6 h after injection | 24 h after injection |
|---|---|---|---|
| BUN (mmol/L) | 5.80 ± 2.21 | 9.43 ± 3.45 | 22.50 ± 8.43 |
| SCr (µmol/L) | 50.22 ± 7.23 | 85.34 ± 35.87 | 342.10 ± 97.45 |
Table 3. BUN and SCr before, 6 h and 24 h after injection of glycerin in dog ARF model.
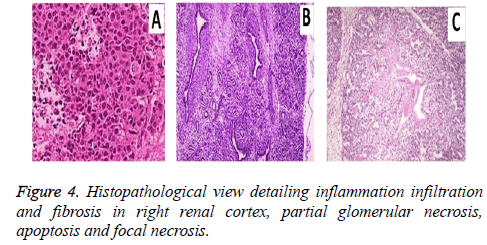
The diagnostic performance of the conventional ultrasound was suffered by difficulties in optimal viewing of the renal artery for the diagnosis of the ARF. But Contrast-enhanced ultrasound (CEUS) improved renal artery visualization and anatomic variations. Histopathological analysis showed (Figure 4) inflammation infiltration and fibrosis in right renal cortex, partial glomerular necrosis, apoptosis and focal necrosis.
Discussion
Contrast Enhanced Ultrasound (CEUS) technique is well known and widely accepted for diagnosis of liver lesions. In the era of ultrasound, use of contrast agent has opened new aspects for the diagnosis and evaluation of multiple organs including liver and kidney [11]. Various techniques including normal ultrasonography, colors Doppler are widely used for the collecting information regarding kidney damage, renal vascular disorders, kidney size, and hydronephrosis [12]. But sometimes it becomes very difficult to differentiate between renal cysts and mixed solid tumors. In such situations the use of CEUS examination technique becomes mandatory
In our experiments the dog model of Acute Renal Failure (ARF) was established. SonoVue bolus injection (0.2 ml) was administered intravenously in hind leg veins of dogs. The conventional ultrasound and Contrast-Enhanced Ultrasound (CEUS) examinations were performed. SonoVue® consists of micro bubbles containing sulphide hexafluoride which is entrapped in phospholipidic shell structure [13]. It has been widely used in cardiac ultrasound, visualisation of breast and liver tumors. The prominent and recent development related to CEUS is use of the Ultra Sound Contrast Agent (USCA) which is used for plotting Time Intensity Curve (TIC) [14]. After intravenous bolus injection of USCA’s TIC’s are used to express the concentration of contrast agent in the ROI [15]. This improves the enlargement pattern of the organ as well as helps in the diagnostic futures of the organs such as liver, spleen, kidney, breast and myocardium [16]. In our experiments gradual increase in AUC, TTP, DPI, α and the decrease in A values were statistically significant (p<0.05).
In normal kidney after IV bolus injection, artery filling occurs first which is followed by quick and complete filling of the cortical area within 10-15 sec of the injection. The medullar region enhancement occurs slowly [17]. The wash out phase can be identified by complete disappear of the micro bubbles from circulation. The medulla loses the enhancement at first which is followed by cortical wash out [18]. But in case of ARF we observed significant decrease in micro bubbles entering the cortex region which leads to the decrease in progressive blood flow to the renal cortex. In ARF dog kidneys enhancement and perfusion was found to be delayed. The kidney enhancement intensity and duration was dependent on the patient’s age, vascular status and renal flow. The conventional ultrasonography technique is based on transmission and reflection technology. Transmission technology distinguishes the tissues with different absorbance of ultrasound. Reflection technology (echo) is based on the principle of functioning sonar (Sonar Navigation and Ranging) [19]. But conventional ultrasonography is still suffered from in born limitations such as lack of sensitivity and visuality. On the other hand CEUS is having better sensitivity and yields valid and clear results under very complex and difficult anatomic conditions [20].
So from aforesaid discussion one can conclude that the technique used in present study is found to be most accurate as well as reliable and more sensitive for early perfusion changes of renal cortex in prescribed dog’s model while conventional ultrasonography technique provided less reliable basis for the diagnosis of early stage of ARF perfusion changes.
Conclusion
Quantitative analysis of contrast-enhanced ultrasound could monitor the changes of blood perfusion image of the renal cortex of the early renal function changes of dogs than SCr and BUN, has been more and more used in the diagnosis of clinical disease.
Conflict of Interest
“No conflict of interest associated with this work”.
Funding Support
This study was approved by Key Projects of Inner Mongolia Medical University (project number NYFY ZD 2014020).
References
- Lameire N, Van Biesen W, Vanholder R. Acute renal failure. Lancet 2005; 365: 417-430.
- Uchino S, Kellum JA, Bellomo R, Doig GS, Morimatsu H, Morgera S. Beginning and ending supportive therapy for the kidney (BEST Kidney) investigators. Acute renal failure in critically ill patients: a multinational, multicenter study. JAMA 2005; 294: 813-818.
- Hoste EA, Kellum JA. Acute kidney injury: epidemiology and diagnostic criteria. Curr Opin Crit Care 2006; 12: 531-537.
- Kalantarinia K. Novel imaging techniques in acute kidney injury. Curr Drug Targets 2009; 10: 1184-1189.
- Robbin ML, Lockhart ME, Barr RG. Renal imaging with ultrasound contrast: current status. Radiol Clin North Am 2003; 41: 963-978.
- Claudon M, Cosgrove D, Albrecht T. Guidelines and good clinical practice recommendations for contrast enhanced ultrasound (CEUS)-Update 2008. Ultraschall Med 2008; 29: 28-44.
- Mitterberger M, Pinggera GM, Colleselli D. Acute pyelonephritis: comparison of diagnosis with computed tomography and contrast-enhanced ultrasonography. BJU International 2008; 101: 341-344.
- Wang L, Wu J, Cheng JF, Liu XY, Ma F, Guo LH. Diagnostic value of quantitative contrast-enhanced ultrasound (CEUS) for early detection of renal hyperperfusion in diabetic kidney disease. J Nephrol 2015; 28: 669-678.
- Daghini E, Primak AN, Chade AR, Krier JD, Zhu XY, Ritman EL. Assessment of renal hemodynamic and function in pigs with 64-section multidetector CT: comparison with electron-beam CT. Radiol 2007; 243: 405-412.
- McArthur C, Baxter GM. Current and potential renal applications of contrast-enhanced ultrasound. Clin Radiol 2012; 67: 909-922.
- Kalantarinia K, Belcik JT, Patrie JT, Wei K. Real-time measurement of renal blood flow in healthy subjects using contrast-enhanced ultrasound. Am J Physiol Renal Physiol 2009; 297: 1129-1134.
- Tamai H, Takiguchi Y, Oka M, Shingaki N, Enomoto S, Shiraki T. Contrast-enhanced ultrasonography in the diagnosis of solid renal tumors. J Ultrasound Med 2005; 24: 1635-1640.
- Wang X, Yu Z, Guo R, Yin H, Hu X. Assessment of postoperative perfusion with contrast-enhanced ultrasonography in kidney transplantation. Int J Clin Exp Med 2015; 8: 18399-183405.
- Xu HX. Contrast-enhanced ultrasound: the evolving applications. World J Radiol 2009; 31: 15-24.
- Schneider AG, Hofmann L, Wuerzner G, Glatz N, Maillard M, Meuwly JY. Renal perfusion evaluation with contrast-enhanced ultrasonography. Nephrol Dial Transplant 2012; 27: 674-681.
- Gauthier TP, Averkiou MA, Leen EL. Perfusion quantification using dynamic contrast-enhanced ultrasound: the impact of dynamic range and gain on time-intensity curves. Ultrasonics 2011; 51: 102-106.
- Schwenger V, Hinkel UP, Nahm AM, Morath C, Zeier M. Color Doppler ultrasonography in the diagnostic evaluation of renal allografts. Nephron Clin Pract 2006; 104: 107-112.
- Feingold S, Gessner R, Guracar IM, Dayton PA. Quantitative volumetric perfusion mapping of the microvasculature using contrast ultrasound. Invest Radiol 2010; 45: 669-674.
- Cosgrove DO, Chan KE. Renal transplants: what ultrasound can and cannot do. Ultrasound Q 2008; 24: 77-87.
- Correas JM, Claudon M, Tranquart F, Helenon AO. The kidney: imaging with microbubble contrast agents. Ultrasound Q 2006; 22: 53-66.
