ISSN: 0970-938X (Print) | 0976-1683 (Electronic)
Biomedical Research
An International Journal of Medical Sciences
Research Article - Biomedical Research (2018) Computational Life Sciences and Smarter Technological Advancement: Edition: II
Optimized clustering segmentation using heuristic algorithm (HA) with fcm for brain image analysis
S Sasikanth1* and S Suresh Kumar2
1Department of Electronics and Communication Engineering, Vivekanandha College of Technology for Women, Tiruchengode, India
2Department of Computer Science and Engineering, Vivekanandha College of Engineering for Women, Tiruchengode, India
- *Corresponding Author:
- S Sasikanth
Department of Electronics and Communication Engineering
Vivekanandha College of Technology for Women, India
Accepted date: June 15, 2017
DOI: 10.4066/biomedicalresearch.29-17-1474
Visit for more related articles at Biomedical ResearchThe objective of this proposed work is to progress brain image segmentation methods for medical imaging applications, using Fuzzy based clustering segmentation approaches. The main aim is to propose a brain epileptic segmentation system suited for MRI processing using temporal filter. The resolution is to simply segment epilepsy in MRI with reproducible outcomes. Cluster analysis recognizes collections of comparable objects and therefore helps in learning circulation of outlines in big data sets. Clustering is most widely used for real world applications. However, accuracy of these algorithms for abnormal brains with edema, tumor, epilepsy, etc., is not efficient because of limitation in initialization of this algorithm. In this research work, FCM based techniques have been proposed to improve the efficiency of clustering approaches. The main focus of the work, based on human MRI brain image, is to optimize the segmentation process with higher accuracy rate, for finding the epileptic tissues of the brain, by using computational intelligence and image processing techniques.
Keywords
Optimized clustering segmentation, Heuristic algorithm (Ha), FCM, Brain image analysis
Introduction
Medical image segmentation for brain MRI is a rapidly growing field with novel techniques and algorithms that are evolving every day. Magnetic Resonance Imaging (MRI) scan is an analysis that generates extremely clear pictures, or images of the human body with the use of X-rays. In case someone is affected by epilepsy, a scan might help to find out the cause. Most of the morphometric tools employed and developed were optimized for data obtained. The cerebral cortex is an extremely folded sheet of Gray Matter (GM) that exists within the Cerebrospinal Fluid (CSF) and encloses a core of White Matter (WM). In order to examine cortical configurations, it is essential to eliminate non-brain tissue and categorize the remaining tissue into GM, WM and CSF. This premature processing of structural MRI data is called tissue segmentation. During segmentation, discovery of internal structure in brain MRI is extensively employed to diagnose numerous brain diseases, like multiple sclerosis, epilepsy, schizophrenia and alcoholism. Conventionally, segmentation of MRI is done manually with qualified radiologists.
Among other brain associated diseases, there are nearly 10 million persons affected by epilepsy in India. Epilepsy is a brain disorder that takes place when the electrical signals in the brain are interrupted. Interruption takes place when the firing pattern of the brain's electrical signals happens to be irregular and strong, either in an isolated region of the brain or all the way through the brain. To be specific, epilepsy is a situation that involves having repetitive seizures. Epilepsy is a kind of seizure disease that results from anomalous action in the brain. In order to realize why seizures take place and why they induce a variety of physical symptoms, it is significant to recognize typical brain function, in addition to what causes cells in the brain to function strangely. Epilepsy is a severe disorder that not only influences the brain but also limits the activity one can perform. As a result, there is a requirement of automated localization of epileptic seizures in MRI images.
A Novel optimal clustering technique for the issue of tissue segmentation has been proposed depending on MRI brain images. By the segmentation of the three cerebral tissues of MRI, WM, GM and CSF, by making use of optimized clustering approaches, the tissue segmentation is performed automatically. This novel clustering segmentation technique could be useful for the research on brain disorder. Brain Image segmentation is also accustomed totally differentiate different objects within the picture since our image is divided into foreground and background, whereas the front of the picture is related to the realm of interest, and the background is the remainder of the image. Hence, image segmentation will separate these two elements from one another. Researchers and scientists have developed many image segmentation techniques, some of the first important and full used image segmentation techniques square measure following within the Literature Review [1,2].
Literature Review
Ruggeri et al. [1] bestowed the popularity of nerve structures within the membrane seems to be a crucial clinical issue, e.g. to analyze concerning damages from surgical interventions (LASIK/PRK) or severity of diabetic pathology. This work got an inclination to self-addressed the matter of recognizing and trailing membrane nerves in confocal analysis photos. Once image brightness and distinction unit of measurement normalized, the nerve following procedure run. After nerve segments are was known, a post-processing methodology removes false recognitions and links thin sections.
Anderson et al. [2] planned exploitation two changed gradient descent strategies, one employing a momentum term and one supported resilient propagation. These procedures are unremarkably applied within the machine learning community. In an exceedingly series of 2- D/3-D-experiments exploitation real and artificial knowledge with ground truth, the modifications cut back the sensitivity for native optima and to extend the convergence rate. Meena et al. [3] presented Elastic body splines (EBS) happiness to the family of 3D splines were recently introduced to capture tissue deformations inside a natural model-based approach for non-rigid medical specialty image registration.
Singh et al. [4] explained by the unification of the fuzzy cmeans bunch and level set methodology. The tactic planned performs the segmentation by swimmingly exploiting the spatial operate throughout FCM group. Akhtar et al. [5] introduced the two learning formula specifically the K-means bunch and Neutrosophic logic, along to get financial results by removing the uncertainty of the pixels. Hu et al. [6] bestowed supported the hypergraph decomposition theory. Every frame of the clinical image atlas is an initial over-segmented into a series of patches that appointed some bunch attribute values [7]. The spots that satisfy some conditions are chosen to be hypergraph vertices, and people clusters of vertices share some characteristics from hyperedges of the hypergraph.
Menze [8] analyzed the Visual feature bunch is one in every of the efficient approaches to phase objects in videos. However, the assumptions created for developing the standard algorithms stop them from being employed in things like segmenting Associate in the Nursing unknown range of static and moving objects underneath severe camera movements. This work addresses the matter by introducing a bunch approach supported superpixels and a short-run bar chart of Histogram of Oriented Optical Flow (HOOF).
Shahdoosti and Ghassemian [9] mentioned the filter-based approaches extract spatial data from the PAN image and inject it into MS pictures. Coming up with associate in nursing optimum filter that may extract relevant and non-redundant data from the PAN image is bestowed during this letter. The optimum filter of- Economic off from applied mathematics properties of the pictures the photographs the pictures is additional in step with sort and texture of the remotely perceived images compared with different kernels like wavelets.
Sathyabama et al. [10] bestowed, handles the fusion of satellite pictures with a thin illustration of information. The highresolution MS image is made from the scattered, reconstructed from HRPAN and LRMS pictures exploitation Compressive Sampling Matching Pursuit (CoSaMP) supported Orthogonal Matching Pursuit (OMP) formula. Thin coefficients manufacture by correlating the LR MS image patches with the LR PAN lexicon.
Koda et al. [11] planned a unique multi-mode error concealment algorithmic rule that aims at obtaining top of the range reconstructions with reduced method burden. Blockbased secret writing schemes in packet loss surroundings are thought-about. This system exploits the excellent reconstructing talents of the kernel-based minimum mean sq. Error (K-MMSE) reckoner. The quality of our technique is dynamically tailor-made to the visual quality of the house reconstruct.
Wan and Xie [12] build two contributions. Within the natural nevertheless acquainted line projection approach, that is additionally adopted in Matlab. In this have a tendency to propose Associate in Nursing entropy-based optimization framework to settle on the optimum line direction, so all the element color vectors in a picture have the first distributed projections, so increasing the grayscale image distinction. Secondly, have a tendency to build use of bar chart specification on all the forecast points to extend the picture difference any. Experimental results show that the planned framework produces increased results compared to different typical strategies.
Proposed Methodology
Fuzzy logic based computational techniques are becoming increasingly important in the medical image analysis arena. The significant reason behind the popularity of fuzzy techniques is the high accuracy yielded by such techniques. Since accuracy is one of the important factors for brain image segmentation applications, they are highly preferred over other computational techniques. Fuzzy C-Means (FCM) algorithm is one of the commonly used fuzzy techniques for segmentation application. Even though FCM is accurate, the convergence time period required by the algorithm is significantly high. This drawback has reduced the usage of FCM technique for real-time applications such as the medical applications where convergence time is also significant. In this research work, this drawback is tackled by proposing two modifications in the conventional FCM algorithm which guarantees quick convergence. The modifications are not done in the algorithm but few pre-processing procedures are implemented prior to the FCM algorithm which reduces the convergence time to high extent. This reduction in the convergence time is achieved without compromising the segmentation efficiency. Thus, the objective of this work is to develop suitable fuzzy techniques for practical applications with the desired performance measures [13-17]. The proposed framework for the automated fuzzy based image segmentation techniques is shown in Figure 1.

Figure 1: Block diagram of proposed solution.
Here propose to use object and background based feature extraction with adaptive samples clustering based image segmentation to enough samples, matching the labelled object and background super pixels respectively.
Preprocessing using temporal filtering
De-noising method is a procedure in picture preparing, which focuses at evacuating its commotion, and consequently, enhances the nature of the photos. X-ray cerebrum pictures are corrupted by AWGN from the picture securing instrument. Spatial channels are the for the most part utilized channels for the expulsion of the AWGN from the pictures. The proposed denoising calculation is called as Total Variation Filter. This technique enhances the actual MRI images in two stages, in particular, denoising and edge upgrade. All the denoising arrangements are centered mostly around clamor decrease and disregarding the corner points of interest.
The superior framework which takes as info Berkeley dark scale pictures, Berkeley shading images, restorative and biometric images from the blended database. The means of the proposed structure are given underneath. The yield of the proposed system is portioned picture which takes care of most extreme sort of division issues.
The means of the framework are as per the following:
1. Give the info a chance to set of pictures X be depicted as Xi= {X1, X 2, X 3...X i}
2. Let the ground truth for the image set X be portrayed as Zi= {Z1, Z 2 , Z 3...Z i}
3. Apply the different sorts of administrators including the proposed director on the arrangement of pictures to give yield picture Yi= {Y1, Y 2 , Y 3...Y i}
4. Contrast every Xi and the relating Yi,
a. on the off chance that a correct match found, i.e. if Zi(x,y)=Yi(x,y)=1, Then TP=TP+1
b. on the off chance that a correct match found, i.e. if Zi(x,y)=Yi(x,y)=0, Then TN=TN+1
5. For the rest of the qualities not thought about and where Yi(x,y)=1, look at Z at changed separation esteems j=1 to 10
a. If match not discovered i.e. Zj(x, y)! =Yi, Then FA=FA+1.
b. Else TP=TP+1
6. For the rest of the qualities not looked at and where Zi(x,y)=1, analyze Y at various separation esteems j=1 to 10
a. If match not discovered i.e. Yj(x, y)! =Zi, Then FR=FR+1.
b. Else TP=TP+1
7. For the rest of the qualities not analyzed discover the separation between each incentive in Y with each incentive in Z. Utilize any of the separation measures said in Eq (1) and (2)
8. From the separations in step 7 figure the cost grid by utilizing the Hungarian Algorithm.
9. On the off chance that mincost=Y(x,y), then FA=FA+1
10. On the off chance that mincost=Z(x,y), then FR=FR+1
11. Locate the FAR and FRR from the estimations of ascertained in the means above
12. Find RR by RR = ((TP and TN)/TNP) *100
13. Additionally, discover the ROCA.
Optimized clustering segmentation using heuristic algorithm (HA)
The FCM based HA procedure stalls out into the nearby least and does not take the spatial relevant data into thought. Henceforth, there is an always expanding requirement for the streamlining of the group focuses on FCM division. This stage manages the enhanced bunching techniques like GA and FA which discover their execution into FCM, for the division of the MRI cerebrum cerebral tissues like Grey Matter, White Matter and cerebral tissues locales. At that point, the outcomes gotten from bunching section with different sorts' of tissues are confined. For the assurance of the worldwide ideal esteem and primary group focuses, HA is acknowledged and joined into FCM for the division of the cerebral tissues in MRI pictures. For every streamlining issue, there ought to be numerous nearby least esteems and just a single worldwide least appreciation. With the end goal of assessment, the viability of the improvement calculation, test capacity is directed at this stage by utilizing 14 standard benchmark test functions. The HA-FCM procedure proposed accomplished worldwide least incentive in Drive Holder test work.
Optimized proposed FCM technique: The second altered FCM calculation proposed in this work is likewise given a similar idea however with an adjustment in the system of separation metric count. In the first change, the regular Euclidean separation measure is utilized, and in the second the nearest coordinate between the pixels is resolved to employ the separation measures like "Coordinating" and 'Dice.' Count of these parameters is finished with the assistance of paired portrayals of the info pixel esteems. This alteration is completed with a target that an adjustment out yonder metric computation can upgrade the execution measures.
Algorithm of proposed HA-FCM
There are two stages in changed FCM2 calculation: (1) Data Reduction and Representative choice and (2) Conventional FCM calculation and enrollment esteem task.
Step 1: Initially, all the pixel force values are changed over to the double portrayal. Since the power respect ranges from 0 to 255, 8 bits are utilized to speak to every pixel. For instance, the power esteem "0" is spoken to by 00000000 and "255" is spoken to by '11111111'.
Step 2: The separation measurements between the first pixel and whatever is left of the pixels are resolved consecutively. For instance, let us accept that the separation Between the accompanying two pixels is to be evaluated. Table 1 demonstrates the specimen esteems for the two pixels.
| Pixel | Decimal values | Binary values |
|---|---|---|
| Pixel 1 | 93 | 0 1 0 1 1 1 0 1 |
| Pixel 2 | 147 | 1 0 0 1 0 0 1 1 |
Table 1. Sample input values.
For the qualities in Table 1, the separation measures are assessed by framing another table called as Response Table. Table 2 demonstrates the general organization for framing the Response Table.
| Subject 1 ‘1’ | Subject 2 ‘0’ | |
|---|---|---|
| Subject‘1’ | a | b |
| Subject ‘0’ | c | d |
Table 2. General response table arrangement.
Table 2 demonstrates a 2 × 2 Response Table since just two subjects "1" and "0" are included in the double portrayal. The qualities, for example, a, b, c, and d must be additionally assessed. Utilizing these conditions, the separation measures, for instance, "Coordinating" and "Dice" can be resolved.
Step 3: In Table 2, "a" relates to the quantity of times "11" blend happened in a similar piece position for the two info pixels, "b" compares to the number of times "10" mix happened in a similar piece situation, "c" relates to the number of times "01" mix happened in a similar part position and "d" compares to the amount of times "00" mix happened in a similar piece position. For Table 6.1, the estimations of 'a', 'b', "c" and "d" are 2, 3, 2 and 1 individually. Utilizing these qualities, the separation measures are ascertained.
Step 4: Two separation measures are utilized as a part of this work. At first, the parameters "Coordinating" (M) and "Dice" (D) are evaluated, and further, the separation is ascertained utilizing (1-M) and (1-D) values. The parameter "Coordinating" is assessed utilizing the accompanying recipe.
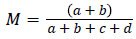
This parameter is additionally called as 'Coordinating Coefficient' which includes the properties which have an ideal match in the bit positions ('11' and "00" blends). Thus, higher the estimation of M better is the likeness between the two pixels. Another parameter "Dice" is resolved to utilize the accompanying equation.
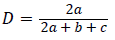
"Dice" compares to weighted separation measure for traits with common understanding ('11' blend). The last separation rule through Dice Coefficient is dictated by computing (1-D). Consequently, higher the estimation of D better is the similitude between the two pixels.
Step 5: The last separation measure through "Coordinating" is controlled by ascertaining (1-M) and the distance measure through "Dice" is dictated by computing (1-D). For the specimen input esteems appeared in Table 3, the parameter "M" yields an estimation of 3/8 and "D" yields an estimate of 4/9. Henceforth, the estimations of (1-M) and (1-D) are 5/8 and 5/9 separately. The separation measure esteems run from 0 to 1. On the off chance that the distance measure values level, then the comparability between the pixels are high.
| S.No | Features parameters | Values |
|---|---|---|
| 1 | Autocorrelation | 49.52 |
| 2 | Contrast | 6.34 |
| 3 | Energy | 0.759 |
| 4 | Entropy | 9.23 |
| 5 | Homogeneity | 2.023 |
| 6 | Maximum Probability | 0.838 |
| 7 | Dissimilarity | 1.636 |
| 8 | Variance | 0.629 |
| 9 | Covariance | 0.718 |
| 10 | Correlation | 0.689 |
| 11 | Inverse Difference Moment | 1.337 |
| 12 | Cluster Prominence | 4.253 |
| 13 | Cluster Shade | 59.671 |
Table 3. Extracted values for the features.
Step 6: The measure of closeness (or) comparability between the two pixels can be dictated by contrasting these qualities and a predetermined edge esteem. Since two subjects (1 and 0) are included in the paired portrayal, the limit appreciation is set to 0.5 in this work. Higher estimation of edge results in less number of bunches. For this situation, the likelihood of the non-neighboring pixels assembled under a similar group is high. This prompts incorrect fragmented outcomes. Then again, if the edge esteem is too low, then the quantity of bunches increment which brings about expanded computational many-sided quality.
For this situation, at one purpose of time, MFCM2 units to FCM. Henceforth, an ideal estimation of 0.5 is utilized as edge an incentive in this work. Every one of the pixels whose (1-M) and (1-D) qualities are lesser than 0.5 are assembled under a similar bunch. For instance, the example esteems appeared in Table 3 don't have a place with a similar group since their separation measure values are more noteworthy than the predefined edge esteem.
Step 7: A similar procedure is rehashed for every one of the pixels and the pixels whose separation measures are least are classified into the same group. This process is repeated until every one of the pixels has a place with one of the groups.
Step 8: The number of bunches is noted down, and one delegate from each cluster is chosen. The middle is utilized to decide the representative pixel from each group. The new dataset comprises of pixels equivalent to some units which are lesser than 65536 (unique info dataset). Along these lines, the dataset is exceptionally lessened with the proposed technique.
Conventional FCM calculation and participation esteem task
Step 9: The regular FCM calculation talked about under Section 6.3 is rehashed with the diminished dataset (agent pixels). The calculation is actualized in an iterative strategy with the updates of group focus and participation esteems. In any case, the bunch focus and enrollment esteem refresh conditions utilized are same as that of Equation (7). It is evident that the quantity of emphasis (meeting time) required for the altered FCM2 is fundamentally lesser than the conventional FCM. In this way, the changed FCM2 calculation yields the enrollment esteems for the delegate pixels at a speedier merging rate.
Step 10: The participation task strategy is performed utilizing before system discussed.
From the above procedural strides, it is apparent that the proposed HA-FCM meets rapidly than the ordinary FCM calculation. The division productivity likewise will be checked with the exploratory outcomes. In this way, the second adjusted HA-FCM calculation has been produced with a target for application in the constant restorative field.
Segmented Feature Estimation
The two metrics namely Mean Square Error (MSE) and Peak Signal to Noise Ratio (PSNR) can be used to find the image quality and the performance of the filters. The MSE represents the cumulative squared error between the original image and the output image, whereas Peak Signal to Noise Ratio (PSNR) represents a measure of the peak error. The lower the value of MSE, the lower is the error. The PSNR can be calculated using [18-22].
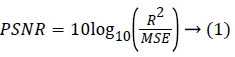
Where,
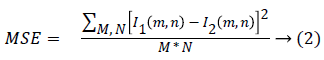
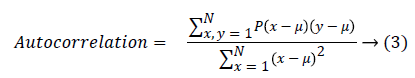
Here, M and N are the number of rows and columns in the original image, and R is the maximum fluctuation in the input image data type. Texture features can be extracted using Gray Level Co-occurrence Matrix and the important texture features are,
Autocorrelation is used to detect the repetitive patterns in the image.
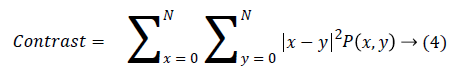
Contrast finds the amount of local variations situated in the image, If P(x,y) in the matrix has more variations and the contrast will be high. The contrast value can be obtained from
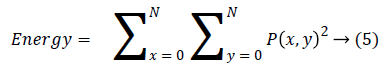
Energy is also termed as angular moment and it finds repeated pair pixels and detects the disorder in the textures and it produce the higher energy values occur when the gray level distribution has a constant or periodic form.
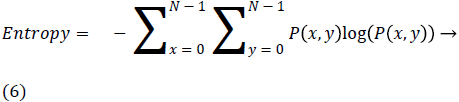
Entropy is the disorder or complexity of the image. It is very large when the image is not texturally uniform and GLCM have very small values compared to complex textures.
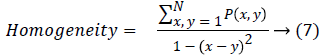
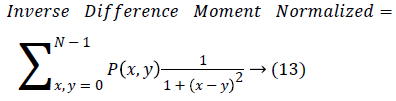
Homogeneity is also termed as Inverse Difference moment and it measure differences in the pair elements.
Maximum probability finds the most relevant shape in the image,
Maximum Probability=max(P(x,y)) → (8)
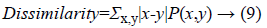
Dissimilarity finds the grey level pair variations in an image.
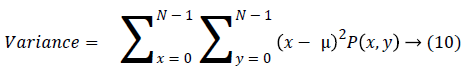
Variance finds the feature values are relatively high.
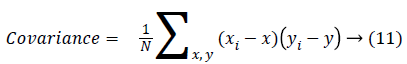
Covariance measure of the spread or dispersion of data in the corresponding column.
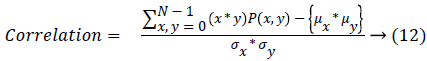
Correlation measures the image gray tone linear dependencies.
The set of texture features can be selected for dimensionality reduction from the extracted features. The performance of segmented classification can be increased with growing number of texture features. However, performance of classification depends on the number, quality of features and size of a training set. The presence of inefficient features humiliates the classifier performance. The feature selection process can be carried out using proposed FCMto optimize the necessary texture features in an image. The segmented classifier can be used to find the misclassified pixels in an image.
The distance vector parameters used to measure various estimates for further classification are given as,
Minkowski distance: 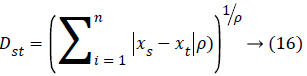
Euclidean distance: 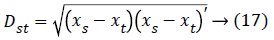
Mahalanobis distance: 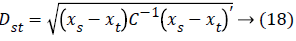
City block distance: 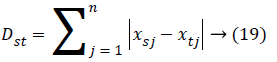
Chebychev distance: 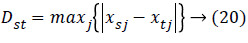
Cosine distance: 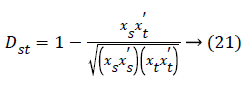
Correlation distance: 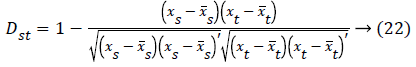
Spearman distance: 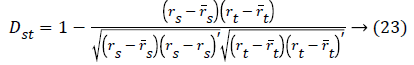
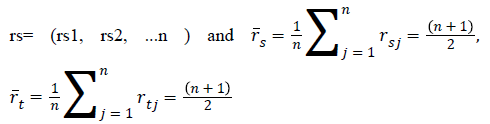
Relative Deviation: 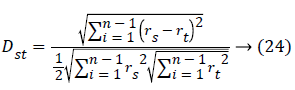
Where rsj is the rank of xsj taken over x1,2j, ...xmj,
rs and rt are the coordinate-wise rank vectors of xs and xt
Segmented classification is the process of classifying the given input by training with a suitable classifier. In the present work artificial neural network classifier are used for brain image classification. The texture features were extracted using proposed work and the feature values are tabulated in Table 3.
The feature selection vector was done to optimize the necessary features in an image by clustering based segmentation. The feature selection process was carried out using cluster Energy, cluster mean Amplitude, and cluster Moments, Histogram, and Wavelet Moments. The optimized features were estimated by Clusters and the features of the destination image required to be predicted.
The outputs of the feature extraction vectors are then trained and the performance accuracy using various segmented classifier methods were compared. The performances of the proposed ANN classifiers were evaluated in terms of the sensitivity, specificity and accuracy using various classifiers.
The sensitivity of the distance vector classifier method can be estimated using,
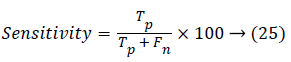
Where Tp is the true positive, Tn is true negative, Fp is the false positive and Fn is the false negative.
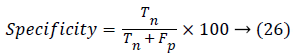
The Specificity is termed as the negative probability for the image test and it can be estimated by,
Accuracy is the probability that a image test is performed correctly. It is then found by
The accuracy, sensitivity and specificity were calculated by comparing the input and the query image to get true positive, true negative, false positive and false negative images in the database.
Results and Discussion
The methods have been implemented using Matlab and evaluated using various data sets. For evaluation the various database has been used. The data set contains total of 200 images are taken from the available database. Among them 90% is taken as training set and 10% taken for testing.
The Table 4 shows the details of evaluation parameters used for the verification of the methods proposed.
| Parameter | Value |
|---|---|
| Data Set | BrainWeb, BRAID: Brain Image Database, OASIS database |
| No of MRI Brain images | 200 |
| Tool Used | Matlab 2013 a |
Table 4. Details of evaluation parameters.
The Figure 2a, shows the input image taken for brain image segmentation. The Figure 2b shows the result of feature extracted and segmented image produced by the proposed approach. The projected technique has been enforced and tested with Mat lab, and it has used a kind of information set to check the performance of the planned approach. Then compare the time interval worth of projected strategies in different parameters like duration of time, min time, and average duration. The Table 5 shows the total of instances that evaluate for thirty runs. It indicates that the projected algorithmic rule has created less time complexness than others.

Figure 2: A) Input image; B) Result of segmented and feature extracted image.
| Method | Time In (msec) | Entropy (joule) | SNR AF/SEG(dB) | Energy (Joule) |
|---|---|---|---|---|
| Level Set | 10925.8154 | 0.253365 | 11.703391 | 7.147013 |
| Multi-Variant Graph | 10501.3214 | 0.344274 | 10.729534 | 8.403171 |
| Local Area Splitting | 9795.422239 | 0.453183 | 9.254397 | 9.069309 |
| MVF With Clustering | 19139.92657 | 0.683520 | 8.279499 | 11.011734 |
| EM & ET | 7891.960781 | 0.838108 | 6.031937 | 12.667068 |
| Proposed Ha | 6150.635154 | 0.906348 | 4.957797 | 13.386051 |
Table 5. The Different methods are discussed and four various parameters such as time, Entropy, SNR (signal-to-noise ratio) and Energy rate.
The Figure 3 shows the comparison results of accuracy between fully totally different completely different approaches, and it reveals that the article and Background based mostly feature extraction with HA based mostly image segmentation approach has created economic agglomeration than different methods.

Figure 3: Comparison of clustering accuracy.
The Figure 3 shows the Comparison of Error rate between completely different approaches and it reveals that the Object and Background Based Feature Extraction with PROPOSED algorithm based brain Image Segmentation approach has less error rate.
Conclusion
The planned ways are made higher economic segmentation quality and turn out less area and time quality. The thing and Background based mostly Feature Extraction with HA based mostly Image Segmentation technique are worked evidently. It had been easy to implement, and therefore the results for image segmentations are spectacular. As will be seen, by the results, some partitions utilized in the segmentation have an enormous impact on the output. A similar goes for the setup checking grayscale intensity. By adding additional restrictions, a larger variety of strengths is on the market to use the output image.
References
- Ruggeri A, Scarpa F, Grisan E. Analysis of corneal images for the recognition of nerve structures. Conf Proc IEEE Eng Med Biol Soc. 2006; 1: 4739-4742.
- Anderson T, Läthén G, Lenz R, Borga M. Modified gradient search for level set based image segmentation. IEEE Transact Image Process 2013.
- Meena S, Prasath VBS, Palaniappan K, Seetharaman G. Elastic body spline-based image segmentation. IEEE Int Conf Image Process 2014.
- Singh P, Bhadauria HS, Singh A. Automatic brain MRI image segmentation using FCM and LSM. Proceed 3rd Int Confer Reliability Infocom Technol Optimiz 2014.
- Akhtar N, Agarwal N, Burjwal A. K-mean algorithm for image segmentation using neutrosophy. Int Confer Adv Comput Commun Informat 2014.
- Hu J, Wei X, He H. Brain image segmentation based on hypergraph modelling. IEEE 12th International Conference on Dependable, Autonomic and Secure Computing 2014.
- Bandara MRR, Ranathunga L, Abdullah NA. A feature clustering approach based on histogram of oriented optical flow and superpixels. IEEE 10th International Conference on Industrial and Information Systems (ICIIS) 2015.
- Menze BH, Jakab A, Bauer S, Kalpathy-Cramer J, Farahani K, Kirby J, Burren Y, Porz N, Slotboom J, Wiest R, Lanczi L, Gerstner E, Weber MA, Arbel T, Avants BB, Ayache N, Buendia P, Collins DL, Cordier N, Corso JJ, Criminisi A, Das T, Delingette H, Demiralp Ç, Durst CR, Dojat M, Doyle S, Festa J, Forbes F, Geremia E, Glocker B, Golland P, Guo X, Hamamci A, Iftekharuddin KM, Jena R, John NM, Konukoglu E, Lashkari D, Mariz JA, Meier R, Pereira S, Precup D, Price SJ, Raviv TR, Reza SM, Ryan M, Sarikaya D, Schwartz L, Shin HC, Shotton J, Silva CA, Sousa N, Subbanna NK, Szekely G, Taylor TJ, Thomas OM, Tustison NJ, Unal G, Vasseur F, Wintermark M, Ye DH, Zhao L, Zhao B, Zikic D, Prastawa M, Reyes M, Van Leemput K. The Multimodal Brain Tumor Image Segmentation Benchmark (BRATS). IEEE Trans Med Imaging 2015; 34: 1993-2024.
- Shahdoosti HR, Ghassemian H. Fusion of MS and PAN images preserving spectral quality. IEEE Geoscience and Remote Sensing Letters 2015; 12: 611-615.
- Sathyabama B, Sankari SGS, Nayagara S. Fusion of satellite images using compressive sampling matching pursuit (CoSaMP) method. Fourth National Conference on Computer Vision, Pattern Recognition, Image Processing and Graphics (NCVPRIPG), Jodhpur, 2013.
- Koloda J, Seiler J, Peinado AM. Multi-mode kernel-based minimum mean square error estimator for accelerated image error concealment. Data Compression Conference, Snowbird, UT, 2016.
- Wan Y, Xie Q. A novel framework for optimal rgb to grayscale image conversion. 8th International Conference on Intelligent Human-Machine Systems and Cybernetics (IHMSC), Hangzhou, 2016.
- Shmmala FA. Color based image segmentation using different versions of k-means in two spaces. Global Adv Res J Eng Technol Innovat 2013; 1: 30-41.
- Jaiswal A, Kurda L, Singh V. Reboost image segmentation using genetic algorithm. Int J Comput Appl 2013; 69: 1-7.
- Wang L, Zheng C, Dai Q. Regional segmentaion of multispectral image using local texture spectral joint histogram. International Conference on Remote Sensing, Environment and Transportation Engineering, Nanjing, 2011.
- Kwon D. Combining generative models for multifocal glioma segmentation and registration. Med Image Comput Comput Assist Interv 2014; 17: 763-770.
- Prakash MR, Kumari SSR. Fuzzy C means integrated with spatial information and contrast enhancement for segmentation of MR brain images. Int J Imaging Syst Technol 2016; 26: 116-123.
- Rao V, Sharifi M, Jaiswal A. Brain tumor segmentation with deep learning. Med image Anal 2015.
- Reza S, Iftekharuddin K. Multi-fractal texture features for brain tumor and edema segmentation. SPIE Med Imag, Int Soc Optics Photonics 2014.
- Pereira S, Pinto A, Alves V, Silva CA. Brain tumor segmentation using convolutional neural networks in MRI images. IEEE Transact Med Imaging 2016; 35: 1240-1251.
- Sharma M, Mukharjee S. Brain tumor segmentation using genetic algorithm and artificial neural network fuzzy inference system ANFIS. Adv Comput Informat Technol 2013.
- Tustison N. Optimal symmetric multimodal templates and concatenated random forests for supervised brain tumor segmentation (simplified) with ANTSR. Neuroinformatics 2015; 13: 209-225.