ISSN: 0970-938X (Print) | 0976-1683 (Electronic)
Biomedical Research
An International Journal of Medical Sciences
Research Article - Biomedical Research (2017) Volume 28, Issue 18
Optimization of the monochromatic energy in imaging the celiac artery with dual energy spectral CT angiography
Xiaoping Yin1, Ziwei Zuo1, Huaijun Liu2*, Yingjin Xu1, Xiao Tian1, Huan Zhou1
1Department of Radiology, Affiliated hospital of Hebei University, No. 212, Yuhua East Road, Baoding, Hebei, PR China
2Department of Medical Imaging, Second Hospital of Heibei Medical University, No. 215, Peace West Road, Shijiazhuang, Hebei, PR China
- *Corresponding Author:
- Huaijun Liu
Department of Medical Imaging
Second hospital of Heibei Medical University, PR China
Accepted on August 11, 2017
To identify the optimal monochromatic energy of the dual energy spectral CT Angiography (CTA) of celiac artery with high image quality. 32 patients were tested by the contrast-enhanced CT with the dual energy spectral imaging mode. Based on the polychromatic data, images of celiac artery were reconstructed at the optimal monochromatic energy, 70 keV monochromatic energy level and the 140 kVp tube voltage. Object evaluation depending on the Contrast-to-Noise Ratio (CNR), the Signal-to- Noise Ratio (SNR), and the Image Noise (IN) for celiac artery, and the subjective evaluation have been used to rank image quality of the above three reconstruction groups. The optimal energy level was determined at 51 keV which gives the highest CNR of 18.74 ± 7.91, while the CNR values for celiac artery in the 70 keV group and the 140 kVp tube voltage group were 13.89 ± 6.27 and 13.14 ± 6.25, respectively. The corresponding SNR values were 21.38 ± 8.39, 17.50 ± 7.12 and 17.19 ± 7.90. The IN values were 27.49 ± 7.48 HU, 17.53 ± 4.56 HU, 15.75 ± 5.34 HU. The subjective score were 4.69 ± 0.24, 4.14 ± 0.24 and 3.71 ± 0.27 for the above 3 groups. CNR, SNR and subjective score for images in the optimal energy group were significantly superior to those in the 70 keV group and the 140 kVp tube voltage group. The optimal monochromatic energy is identified at 51 keV in dual energy spectral CT Angiography (CTA), which significantly improves the image quality of the celiac artery.
Keywords
Celiac artery, Spectral CT, CT angiography, Monochromatic image.
Introduction
The traditional application of high concentration contrast medium in multi-slice CT Angiography (CTA) may increase the risk of kidney diseases. Thus clinical doctors expect to reduce the dose of contrast agent as much as possible but maintain the quality of vascular images. Generally speaking, photons of different energy levels have different attenuation characteristics in matters. The low energy X-ray has lower penetration, which can increase the attenuation and the contrast between iodine and surrounding tissues, but can also increase the image noise [1]; the high energy photons produce less beam hardening artifacts, but tissue contrast is also reduced. Recently, a spectral CT imaging technique based on a singledetector, single-source Dual Energy CT (ssDECT) system with the capability of rapid alternation (<0.5 ms) between two peak voltage settings (80 kVp and 140 kVp) has gained wide clinical acceptance [2-4]. 101 sets of monochromatic images with photon energies of 40–140 keV with 1 keV interval can reconstructed in the dual energy spectral CT imaging [5-8]. Radiation dose of the dual energy spectral CT has been a hot topic in CT imaging community. According to the new study by choosing appropriate parameters, there is no difference between spectral CT scanning and the conventional CT scanning in radiation dose in imaging abdomen [9-12].
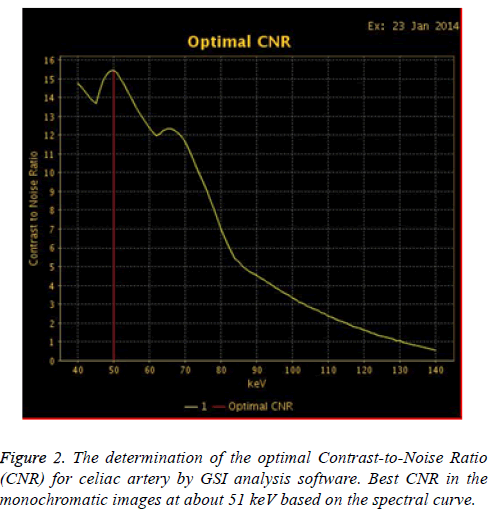
On the other hand, the curve of the Contrast to Noise Ratio (CNR) as a function of photon energy can be used to identify the optimal monochromatic energy level for achieving the highest CNR for vessels against the surrounding tissues to improve the contrast resolution of CTA. Consequently, it is possible to maintain vascular image quality as well as reduce the dose of contrast agent. The purpose of this article was to identify the optimal energy level in the contrast-enhanced spectral CTA of celiac artery with standard concentration of contrast medium, and to evaluate value of the optimal energy level in improving the CTA image quality in terms of Signalto- Noise Ratio (SNR) and Contrast-to-Noise Ratio (CNR) for the celiac artery.
Materials and Methods
Patients
This retrospective study had institutional review board approval, and written informed consent was obtained from each patient before the study. The contrast-enhanced CT with the dual energy spectral imaging technique was used to image 32 patients from October 2013 to March 2014. The study group consisted of 16 men and 16 women, with mean age of 61.66 ± 8.86 y. They were referred for pancreatic cancer (n=3), common bile duct placeholder (n=4), liver hemangioma (n=16), hepatic cyst (n=4), liver cancer (n=2), metastatic tumor (n=2), pheochromocytoma (n=1).
Scanning protocol
CT scans were performed by a Discovery CT750 HD scanner (HDCT, GE Healthcare, Milwaukee, WI, USA). The abdomen contrast-enhanced spectral CT ranged from diaphragm to the edge of the kidney for all the patients. The spectral CT scan protocol included helical pitch of 0.984:1, rotation speed of 0.5 s, 50 cm Display Field Of View (DFOV). The non-ionic contrast media ioversol (320 mgI/ml) at the dose of 1.0 ml/kg was injected with power injector at a rate of 3.0 ml/s through the median cubital vein.
There are three scanning phases. The first arterial phase scanning was started automatically 8 seconds after the trigger threshold (100 HU) was reached at the level of the celiac trunk by the scan-triggering software (SmartPre; GE Healthcare) with automatic tracking technique. The portal venous phase and the delay phase scanning were started 30 s and 120 s after the start of the arterial phase, respectively.
There are three scanning phases. The first arterial phase scanning was started automatically 8 seconds after the trigger threshold (100 HU) was reached at the level of the celiac trunk by the scan-triggering software (SmartPre; GE Healthcare) with automatic tracking technique. The portal venous phase and the delay phase scanning were started 30 s and 120 s after the start of the arterial phase, respectively.
Objective evaluation
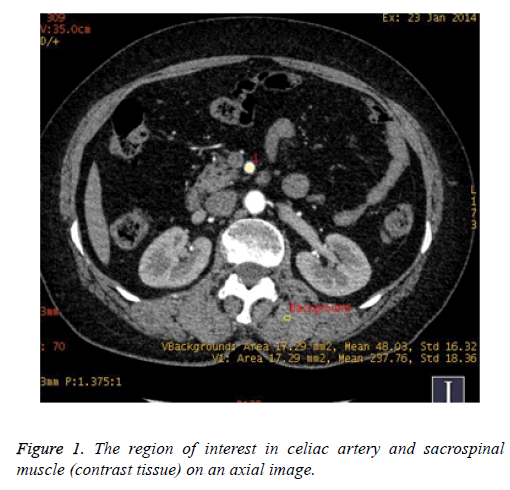
Objective evaluations on the images quality were performed on 3 energy levels: the optimal energy level, the default 70 keV energy level and the 140 kVp tube voltage. A circular Region of Interest (ROI) with areas ranging from 15mm2 to 20 mm2 was placed on the celiac trunk and sacrospinal muscle at the same level to measure the mean CT values and image noise. The size of the ROI was approximately in the vessel section [13] to avoid the measuring errors. The measurements were averaged by 3 times for each CT parameters. The CNR and SNR measurements for the celiac artery were performed on both the monochromatic and polychromatic axial images. The CNR and SNR were defined by the following formula: CNR=(ROIo-ROId)/SDn, SNR=ROIo/SDn, where ROIo denotes the CT value of the celiac artery, ROId denotes the CT value of the sacrospinal muscle of the same slice, and SDn denotes the mean background image noise. The sacrospinal muscle was used as the contrast tissue. The standard deviation of sacrospinal muscle CT value at the same level represented the Image Noise (IN).
Subjective evaluation
Two radiologists (with 5 years of experience in abdominal imaging diagnosis) independently reviewed the CT images at the same window width, window level and DFOV [14]. Image quality was scored depending on the sharpness of celiac trunk margins: 5 stood for very sharp, 4 for sharp, 3 for fairly sharp, 2 for less sharp, and 1 for blurred. For the vessel levels on the CTA images, level 1 stood for abdominal aorta stem, level 2 for celiac trunk, level 3 for celiac trunk branches, level 4 for left gastric artery, splenic artery and common hepatic artery (proper hepatic artery or gastroduodenal artery), and level 5 for further. For the contrast between the celiac trunk and liver parenchyma, 5 stood for excellent, 4 for very good, 3 for good, 2 for bad, 1 for very bad [15]. For each parameter, averaged scores were obtained and used as the subjective criteria for the image quality evaluation of the optimal monochromatic energy, 70 keV and the 140 kVp groups [10].
Statistical analysis
Statistical analysis was carried out by the SPSS 17.0 software. The SNR, CNR, IN and subjective score in the vessels at 3 different energy levels were analysed and compared by using one-way ANOVA. For all comparisons, p<0.05 was defined as having significant difference.
Results
The region of interest in celiac artery and sacrospinal muscle (contrast tissue) on an axial image was shown in Figure 1, where the background was on behalf of the ROI of sacrospinal muscle in the same layer. The lower left corner of the Figure 1 showed that the area of ROI in background and the celiac artery (V1) were 17.29 mm2. The background CT value was 48.03 HU with standard deviation of 16.32 and the celiac trunk (V1) CT value is 297.76 HU with standard deviation of 18.36. Figure 2 gave the CNR curve as a function of the photon energy for celiac artery. There are two peaks, one at the 66 keV near the default 70 keV, another one at the 51 keV, where corresponds to the highest CNR. The optimal monochromatic images at about 51 keV (ranged from 49 keV to 53 keV) were found to provide better CNR, SNR and subjective score for CTA of celiac artery than the 70 keV images and the polychromatic images, as shown in Table 1. The highest CNR for imaging celiac artery is obtained at the photon energy level of 51 keV, compared with the 70 keV monochromatic images (34.9% increase) and 140 kVp polychromatic images (42.6% increase), despite the higher image noise at this energy level. Subjective value of VR and MIP for Celiac artery was 4.69 ± 0.24, significantly higher than the 4.14 ± 0.24, 3.71 ± 0.27 for the 70 keV and 140 kVp images, respectively. Our results agree with the study of Coursey [4] where they showed the median value of the optimal energy of 55 keV (51-62 keV) for optimizing the display for malignant tumor blood supply arteries in abdominal CTA. The subjective score for the 70 keV images was higher than the 140 kVp polychromatic images, but the CNR, SNR and IN had no statistical difference between the two groups.
| SNR | CNR | IN | Subjective score | |
|---|---|---|---|---|
| 51 keV | 21.38 ± 8.39* | 18.74 ± 7.91* | 27.49 ± 7.48* | 4.69 ± 0.24* |
| 70 keV | 17.50 ± 7.12 | 13.89 ± 6.27 | 17.53 ± 4.56 | 4.14 ± 0.24 |
| 140 kVp | 17.19 ± 7.90▲ | 13.14 ± 6.25▲ | 15.75 ± 5.34▲ | 3.71 ± 0.27★▲ |
| F | 7.423 | 19.463 | 80.669 | 307.63 |
| P | 0.008 | <0.001 | <0.001 | <0.001 |
*For comparison with 70 keV, P<0.05; ▲for comparison with 51 keV, P<0.05
Table 1. CNR, SNR, IN and subjective score for the images at three energy levels.
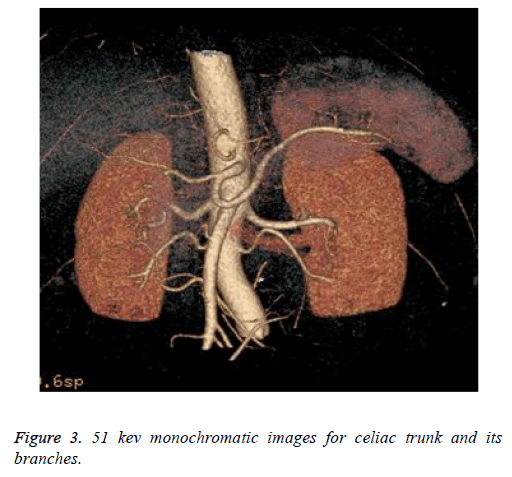
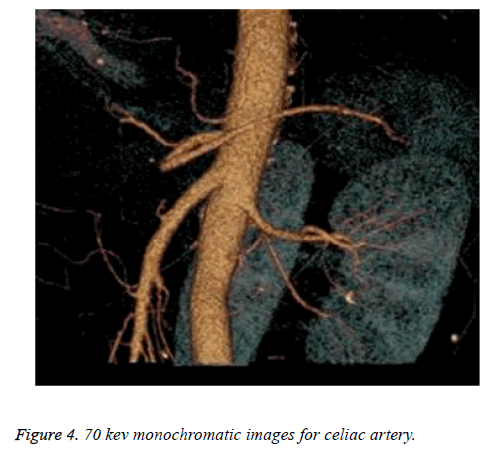
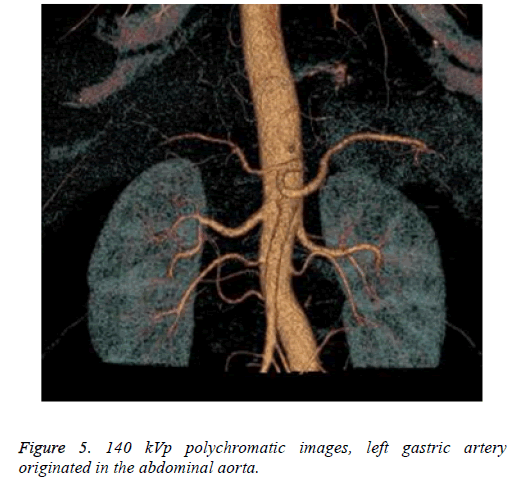
Images of celiac artery at the optimal energy level, the default 70 keV energy level and the 140 kVp tube voltage are shown in Figures 3-5, respectively. Figure 3 showed the celiac trunk and Branch edge is very sharp and the image quality score 5 points. While Figures 4 and 5 showed the celiac artery image quality was similar and sharp, where celiac trunk artery and branch blood vessel edge was basic sharp and only the celiac trunk artery branch of the splenic artery, the left gastric artery and common hepatic artery were displayed. The score of the two figures were 4 points. Figure 3 displayed more distal branches than the Figures 4 and 5. One thing needed to be mentioned, in this research we observed 1 case with abnormal origin of left gastric artery that was directly from the abdominal aorta, others cases were normal.
Discussion
Multi-Slice CTA (MSCTA) can directly display the anatomical variations and origin for the common hepatic artery and the blood supply artery of gastric, and further evaluate the range of variation and the relationship between the adjacent organs [16,17]. Recently, MSCTA has become a rapid, accurate and non-invasive method for clinical diagnosis and surgery for abdominal blood vessels [13]. Increasing the contrast medium injection rate, dosage or X-ray dose often helps to provide high quality CTA [4,18]. But this also increases the potential toxic, radiation and extravasation risks to patients [18,19]. The contrast medium nephropathy is consistently the focus of attention at home and abroad. Its occurrence directly correlates with the dose of contrast agent and concentration [20]. Meanwhile, fast contrast agent injection flow rate is prone to leakage that often brings unnecessary pain to patients. Therefore, it is the key to select and apply contrast medium reasonably for reducing probability of CIN and contrast medium adverse reaction. In addition, conventional MSCTA with polychromatic energy X-ray reduces contrast resolution due to the photon energy averaging effect, and the CT values "drift" and hardening artifacts generated by the beam hardening effect degrades image quality.
Darwish [21] studied the use of reduced contrast medium concentration at 300mgI/ml but with the standard injection rate of 4 ml/s in conventional abdominal CTA, and demonstrated good image quality for abdominal blood vessels. In this study we chose to reduce both the contrast medium iodine concentration (to 320 mgI/ml) and flow rate (to 3.0 ml/s), thereby reducing the adverse reaction of contrast medium and leakage of contrast. At the optimal 51 keV, the attenuation and CNR in celiac artery were sufficient enough to compensate for the reduced contrast concentration and total contrast dose. The use of optimal energy in spectral CT imaging can not only optimize the ordinary CT angiography image quality, but also shows the malignant tumor blood supply arteries, brings a lot of help for the diagnosis of the source of the lesion and surgical operation. Meanwhile, our results improve the contrast between abdominal viscera and surrounding tissue, which improves tumor lesion detection, diagnosis and differential diagnosis of hypervascular tumor in abdomen [7,8,22-25]. In our study, the spectral CT imaging clearly identified a case of left gastric artery variation, originated in the abdominal aorta, which provided useful information for pre-operative planning.
In future, there are several improvements can be made in order to obtain more reliable theoretical basis. First more patients are needed to increase the sample size. Second how can the low CT radiation dose effects the image of the celiac vascular is to be investigated. Third, we are going to analysis the changes of celiac artery caused by the abdominal tumors.
Conclusion
In conclusion, dual energy spectral CT has been performed to 32 patients to provide a set of monochromatic images. The monochromatic energy has been optimized to improve the image quality and enhance vascular visibility, which is identified at 51 keV by comparing the Contrast-to-Noise Ratio (CNR) of the images at the energy range from 40 to 140 keV. The result is quite important in spectral CT Angiography (CTA) to significantly improve the image quality of celiac artery.
Acknowledgement
The authors thank to Dr. Huizhi Cao from GE Company for his technical support.
Funding
This work was supported by the Science and Technology Commission of Hebei Province (Project No.15277740D), and Research project supported by talent training fund of Hebei Province (A2017002087), China.
Conflict of Interest
None
Ethic Approval and Informed Consent
This retrospective study had institutional review board approval, and written informed consent was obtained from each patient before the study.
References
- Schueller WC, Schaefer-Prokop CM, Weber M, Herold CJ, Prokop M. CT angiography of pulmonary arteries to detect pulmonary embolism: Improvement of vascular enhancement with low kilovoltage settings. Radiology 2006; 241: 899-907.
- Karcaaltıncaba M, Aktas A. Dual-energy CT revisited with multidetector CT: review of principles and clinical applications. Diagn Interv Radiol 2011; 17: 181-194.
- Johnson TR, Krauss B, Sedlmair M, Grasruck M, Bruder H. Material differentiation by dual energy CT: initial experience. Eur Radiol 2007; 17: 1510-1517.
- Coursey CA, Nelson RC, Boll DT, Paulson EK, Ho LM, Neville AM, Marin D, Gupta RT, Schindera ST. Dual energy multidetector CT: how does it work, what can it tell us, and when can we use it in abdominopelvic imaging. Radiographics 2010; 30: 1037-1055.
- Lv P, Lin XZ, Li J, Li W, Chen K. Differentiation of small hemangioma from small hepatocellular carcinoma: reintroduced spectral CT method. Radiology 2011; 259: 720-729.
- Li M, Zheng XP, Li JY, Yang Y, Lu C, Xu H, Yu B, Xiao L, Zhang G, Hua Y. Spectral CT imaging of thyroid nodule specimens: in comparison with pathologic findings. Invest Radiol 2012; 47: 58-64.
- Yu Y, Lin X, Chen K, Chai W, Hu S, Tang R, Zhang J, Cao L, Yan F. Hepatocellular carcinoma and focal nodular hyperplasia of the liver: differentiation with CT spectral imaging. Eur Radiol 2013; 23: 1660-1668.
- Lin XZ, Wu ZY, Tao R, Guo Y, Li JY, Zhang J, Chen KM. Dual energy spectral CT imaging of insulinoma-Value in preoperative diagnosis compared with conventional multi-detector CT. Eur J Radiol 2012; 81: 2487-2494.
- Zhang D, Li X, Liu B. Objective characterization of GE discovery CT750 HD scanner: gemstone spectral imaging mode. Med Phys 2011; 38: 1178-1188.
- Yamada Y, Jinzaki M, Tanami Y. Virtual monochromatic spectral imaging for the evaluation of hypovascular hepatic metastases: the optimal monochromatic level with fast kilovoltage switching dual-energy computed tomography. Invest Radiol 2012; 47: 292-298.
- Qian LJ, Zhu J, Zhuang ZG. Differentiation of neoplastic from bland macroscopic portal vein thrombi using dual-energy spectral CT imaging: a pilot study. Eur Radiol 2012; 22: 2178-2185.
- Kaza RK, Caoili EM, Cohan RH. Distinguishing enhancing from nonenhancing renal lesions with fast kilo voltage-switching dual-energy CT. Am J Roentgenol 2011; 197: 1375-1381.
- Hu D, Yu T, Duan X, Peng Y, Zhai R. Determination of the optimal energy level in spectral CT imaging for displaying abdominal vessels in pediatric patients. Eur J Radiol 2014; 83: 589-594.
- He J, Ma X, Wang Q, Fan J, Sun Z. Spectral CT demonstration of the superior mesenteric artery: comparison of monochromatic and polychromatic imaging. Acad Radiol 2014; 2: 364-368.
- Zhao LQ, He W, Li JY, Chen JH, Wang KY. Improving image quality in portal venography with spectral CT imaging. Eur J Radiol 2012; 81: 1677-1681.
- Mingoli A, Sgarzini G, Binda B, Brachini G, Belardi V, Huscher CG, Di Paola M, Ponzano C. Totally laparoscopic approach for treatment of early and advanced gastric cancer. J Am Coll Surg 2007; 20: 187-188.
- Wang M J, Cheng Z, Wang R, Zhou ZG. Unusual course of the common hepatic artery originating from the celiac trunk. Surg Radiol Anat 2010; 32: 883-885.
- Fleischmann D, Kamaya A. Optimal vascular and parenchymal contrast enhancement: the current state of the art. Radiol Clin North Am 2009; 47: 13-26.
- Awai K, Inoue M, Yagyu Y, Watanabe M, Sano T, Nin S, Koike R, Nishimura Y, Yamashita Y. Moderate versus high concentration of contrast material for aortic and hepatic enhancement and tumor-to-liver contrast at multi-detector row CT. Radiology 2004; 233: 682-688.
- Nyman U, Bjork J, Aspelin P, Marenzi G. Contrast medium dose-to-GFR ratio: A measure of systemic exposure to predict contrast-induced nephropathy after percutaneous coronary intervention. Acta Radiol 2008; 49: 658-667.
- Darwish T. An evidence-based approach to minimise contrastinduced nephropathy. N Z Med J 2009; 122: 39-41.
- van den Esschert JW, van Gulik TM, Phoa SS. Imaging modalities for focal nodular hyperplasia and hepatocellular adenoma. Dig Surg 2010; 27: 46-55.
- Matsumoto K, Jinzaki M, Tanami Y, Ueno A, Yamada M, Kuribayashi S. Virtual monochromatic spectral imaging with fast kilo voltage switching: improved image quality as compared with that obtained with conventional 120 kVp CT. Radiology 2011; 259: 257-262.
- Yu Y, He N, Sun K, Lin X, Yan F, Chen K. Differentiating hepatocellular carcinoma from angiomyolipoma of the liver with CT spectral imaging: a preliminary study. Clin Radiol 2013; 68: 491-497.
- Yu Y, Guo L, Hu C, Chen K. Spectral CT imaging in the differential diagnosis of necrotic hepatocellular carcinoma and hepatic abscess. Clin Radiol 2014; 69: 517-524.
