ISSN: 0970-938X (Print) | 0976-1683 (Electronic)
Biomedical Research
An International Journal of Medical Sciences
Research Article - Biomedical Research (2017) Volume 28, Issue 5
Lung nodule volume growth analysis and visualization through auto-cluster k-means segmentation and centroid/shape variance based false nodule elimination
The objective of this work was to develop an automated computerized algorithm to detect the cancerous nature of lung. An Auto Cluster K-means segmentation (ACKMS) was used to segment the lung nodules from CT scans. ACKMS algorithm was developed such that it selects initial clusters automatically by average minimum-maximum pixel computation on each row and column of CT image. All the candidate nodules segmented from the consecutive slices of CT scan were reconstructed to develop a 3D-image. The vessels and calcifications were eliminated by centroid and shape/edge variation analysis. Nodule growth analysis was carried out on real nodules remained after eliminating vessels and calcifications. The rate of nodule growth (RNG) was computed in terms of 3D-volume change. The CT scans of 34 patients taken at different time intervals were analyzed. In total, 400 to 600 candidate nodules of size>3 mm were segmented from every scan series. Out of the 34 shortlisted real nodules, 3 nodules had RNG value>1, confirming their malignant nature. For another 14 nodules, the RGN value was ranged in between 0.2 and 0.8, suggesting a need for another follow-up scan to confirm malignancy. The remaining 17 nodules showed RGN<0.2; seven nodules showed almost zero and in the remaining 10 cases follow-up scan was advised based on patients living habits and environmental conditions.
Keywords
Lung nodule growth, K-means segmentation, Lung cancer diagnosis, 3D image visualization.
Introduction
Lung cancer is the cause of the maximum worldwide deaths compared to any other cancer [1]. Many studies focused on developing innovative technology to precisely scan human organs, algorithms that enable to diagnose the cancer from scanned images, and genetic cell-based chemical assays to diagnose cancer are at present underway.
In this study, we developed an automated computerized algorithm to diagnose lung cancer using a series of cross sectional Computed Tomography (CT) images. The CT technology has evolved considerably and captures images at every 2 mm penetration inside the organs. The more cross sectional images captured at lesser interval, the smaller structural changes in the organ can be revealed.
However, analyzing these images is a laborious task for the radiologist. The automated computerized algorithms that evaluate the scanned slices quantitatively will help the radiologist effectively diagnosing the disease.
Significance of this work
The spongy nature of the lung makes biopsy very difficult. Hence biopsy is not generally recommended when mild symptoms of lung cancer exist in patients. Based on the patient’s smoking habit and environmental risk factors, CT scanning is performed at different time intervals (6, 9 or 2 months). After analyzing CT images at different intervals and based on level of disease progression, biopsy is performed [2,3]. One of the diagnostic indicators for lung cancer is the presence of a tissue cluster called pulmonary nodules; however, not all the nodules are cancerous in nature. The most recent and advanced CT technology has the ability to capture very small tissue clusters as well. The majority of published studies have segmented the nodules from CT scan images of lung with the help of threshold-based and template matchingbased techniques. The drawback of threshold-based method is fixed nodule intensity in terms of Hounsfield Unit (HU) which can vary with X-ray technology used in CT [4,5]. In addition, they need morphological processing to segment the nodules from CT images [6,7]. Model-based template matching techniques are limited by dependency on orientation and shape [8-10]. Since lung nodules do not possess uniform shapes and are non-linear, the template matching techniques are not suited for their segmentation.
The 3-D method of segmentations reported recently is reliable and gives less false positives [11-13]. Only few studies have analyzed nodule growth rate. Reeves et al. have proposed a methodology to measure the growth rate of nodules, but it has used the threshold and template matching methods for segmentation [14]. Jane et al. developed a procedure for volume measurement of the nodules that involve manual inputs for identification [15]. In the work by Zheng et al. though the nodule growth rate is measured by innovative template matching segmentation, the results are not convincing due to the highly variable shape and size of nodules [16]. Similarly, Smith et al. measured nodule growth to mark the seed positions of a nodule [17]. Two other studies are also focused on the medical point of view of the nodule growth [18,19]. In this work, we have concentrated on developing an algorithm to automatically segment the malignant candidate nodules from consecutive CT images and reduce the false positives, i.e., benign nodules (calcium deposits or some non-cancerous tissue clusters). In addition, we have also analyzed difference in the rate of nodule growth (RNG) at different time for the same patient.
Database
The images used in this work are downloaded from open source database VALCANO [20], which has CT data of uniform slice thickness for 34 patients. For each patient, a series of CT scans were conducted at different time interval using GE Medical and Philips CT scanners with different Xray tube current and exposure. The time difference between the scans is not specified; however, information on nodule location is available. A total of 1712 cross sections of CT images from 34 cases were analysed in this work. Each image has a size of 512 × 512 inch with 16-bit gray resolution and pixel spacing of 0.76 mm in both x and y direction. The X-ray tube current dosage is 80 mA and the exposure time is 553 ms. The patient name DICOM tag (0010,0010) is modified as SC00xx to keep the patient identity confidential and also the patient age and sex DICOM tags (0010,0030), (0010,0040) are removed from database.
Segmentation of Nodule Candidates from Consecutive CT Scan Slices
There are 4 different types of modules such as wellcircumscribed, juxta-pleural, vascularized, and pleural tail that can be present in the lung parenchyma. The algorithm developed in this study is applicable for the segmentation of any type of nodule. The well-circumscribed nodules are present within the lung parenchyma and are round in shape. The vascularized nodules are connected to vessels that are situated inside the lung region. The juxta-pleural nodules are significantly connected with the inner wall of lung, while pleural-tail nodules are tail like structures connected to lung walls.
Auto Cluster K-means Segmentation (ACKMS)
The concept of data clustering has been used to segment the lung nodules [21]. The two clusters were fixed and their initial values were automatically determined. The detailed algorithmic steps used to segment lung nodules using ACKMS were as follows:
1. The two initial cluster values cc1 and cc2 for CT image I (i, j) of size m x n was computed using Equation 1 and 2.
2. Two planes C1 and C2 of size m x n with corresponding pixel value of cc1and cc2 were created and the distance between the each pixel of the CT image I and C1, C2 were computed using the following equations:
3. The distance d1 and d2 was compared for every pixel position (i, j).
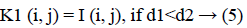
The new images K1 and K2 were with the clusters values close to cc1 and cc2, respectively.
4. The cluster values cc1 and cc2 were updated by the mean value of non-zero pixels of an image K1 and K2, respectively.
5. The clustering process was repeated from step 2 with new updated value of cc1upd and cc2upd. The iteration was stopped when the difference between successive cc1upd and cc2 upd was less. The final K-means clustering binary version outputs is shown in the Figures 1b and 1c along with the original CT lung slice in Figure 1a.

Figure 1 : (a) Original CT 2-D slice, (b) K-means cluster-1 mask, (c) K-means cluster-2 mask, (d) Lung mask with juxta nodule hole, (e) Mask with closed juxta nodule hole, (f) Segmented nodule candidates.
6. The border clearing morphology and connected component analysis was carried out on the K-means clustered image to segment only the mask of the parenchyma region and to remove all other unwanted fat, muscle, heart, and background regions. The mask with original lung CT image was converted to binary that segmented the candidate nodule candidate mask as shown in the Figure 1f.
7. For a CT lung image with juxta-pleural nodule, the morphological closing process was performed after step 5. Since juxta-pleural nodules are located in the parenchyma and connected with lung wall, after step 5, the hole (black region) was created in place of juxta nodule as shown in Figure 1d. This juxta-hole region is usually connected with the background black region; hence it should be closed before filling the parenchyma region.
8. Morphological closing process with disk structural element was performed on an image segmented from step 5 using commonly used disk of radius 20 pixels. The left and right lungs were separated using connected component analysis to avoid connection between two lobes by closing process and then morphology closing was performed separately. Finally, after closing the juxta nodule holes both the left and right lung masks were added as shown in Figure 1e.
.9. Then step 6 was applied on the juxta-hole closed image to segment the candidate nodules.
The candidate nodules segmented using the above steps from each CT slice were stacked individually to form a 3D nodule structure [22] as shown in Figure 2.

Figure 2 : 3-D visualization of the one segmented nodule candidate.
Elimination of vessels and calcifications
The change in shape of the candidate nodule from one CT slice to other was used to distinguish the nodules from non-nodules. The centroid, area, eccentricity, and equiv-diameter were computed for the candidate nodules from a series of CT slices.
The centroid value varies much for the vessels which appear like nodules in 2D CT image [23]. Hence all the segmented clusters with variable centroid value were eliminated. All the remaining candidate nodules need not to be nodules, even though the variation in centroid is less in a series of CT slices. After removing the vessels, the nodules remained were real nodules along with calcifications and tissue clusters due to bacterial or fungal infection. The calcifications are the calcium deposits with smooth texture and constant shape/size across CT slices. The real nodules were discriminated from calcifications with the help of change in area, sharpness of the nodule edge, and equiv-diameter analysis across series of CT images. The 3- D visualization of the candidate nodule whose centroid varied a lot in consecutive sections is shown in the Figure 3, whereas Figure 2 shows the candidate nodule with less centroid shift.

Figure 3 : 3-D visualization of the segmented nodule candidate with large centroid variation.
Lung Growth Analysis
The real nodules were obtained after eliminating vessels and calcifications in section 2. These nodules were further analyzed for their cancerous nature-a vital step in the lung cancer diagnosis. Generally physicians do not take final decision with one CT scan of a patient. If the physicians suspect any symptoms of lung cancer through nodules, then they prescribe the patient to undergo one more CT scan after a time span of 6 or 9 or 12 months based upon the patient's life history such as their smoking habits, living atmosphere, etc. The comparison between two scans of patient taken at reasonable time interval reveals the growth potential of nodule. The benign noncancerous nodules grow lesser than the cancerous malignant nodule growth.
In this work, we quantitatively measured the nodule volume growth shown in Figure 7. Since a small change in 2D area leads to a larger change in the 3D volume, it is important to use volume as a measure of nodule growth than the 2D area [24]. The nodules segmented in Section 2 from each 2D scan images were reconstructed to form a 3D structure of the nodules. This 3D nodule reconstruction was performed on CT scan images of same patient taken at different time span. The volume was computed for every real nodule in both the scans of each patient and the rate of nodule growth (RNG) was computed using following equation:

Figure 4: 3-D visualization of the same nodule from a different scan taken for the same patient (a) Earlier scan (b) Latter scan.

Figure 5: 3-D visualization of segmented nodule candidates of case 2.

Figure 6: Candidate nodules from consecutive slices: Nodules with less centroid change-(a) and (b); nodules with higher centroid change-(c) and (d).

Figure 7: Nodules volume growth distribution.
Volume V = 
Where p is the number of images in which a nodules exist.
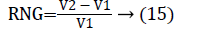
Where V1 is the volume of the nodule in an earlier scan and V2 is the volume of the nodules in a latter scan.
The Figure 4 shows the 3-D visualization of one nodule candidate which segmented from two different time scans of the same patient.
Results
The ACKMS algorithm is effectively applied on an every lung image slices and the suspected nodules candidates from one CT slice image were shown in the Figure 1. The suspected nodule candidates of case 2 from consecutive slices are interpolated to form its 3D visualization as shown in Figure 5.
The nodule candidates of size greater than 3 mm are considered for further analysis. Such a nodule candidates for patient case 2 from a consecutive CT image slices are shown in the Figure 6. The Centroid values for each nodule candidates of size greater than 3 mm are computed. The centroid values of 4 nodules candidates from consecutive CT slices of patient case 2 are tabulated in Table 1. Further the shape features are computed for the nodules candidates whose centroid positions remain stable. The area, equiv-diameter and edge sharpness are computed using Equation 10-13 and tabulated in Table 2.Finally for the remaining nodule candidates after applying centroid shift and shape feature analysis, the volume of nodules are computed for both early and latter CT scans of each patient. The rate of nodule growth is computed using Equation 15 and the values are tabulated in Table 3.
| Nodule Candidate (a) | Nodule Candidate (b) | Nodule Candidate (c) | Nodule Candidate (d) | ||||
|---|---|---|---|---|---|---|---|
| 122.38 | 260.21 | 175.95 | 299.21 | 317.50 | 300.27 | 178.86 | 270.64 |
| 122.92 | 260.60 | 175.81 | 298.24 | 317.52 | 298.35 | 179.14 | 268.95 |
| 122.03 | 261.01 | 176.91 | 297.18 | 317.35 | 296.15 | 181.26 | 270.17 |
| 124.42 | 258.28 | 177.50 | 296.50 | 320.29 | 296.03 | 181.29 | 270.05 |
| 124.45 | 257.76 | 177.90 | 295.50 | 320.58 | 296.92 | 181.50 | 270.00 |
| 124.54 | 258.30 | 178.11 | 294.94 | 316.89 | 301.51 | 181.44 | 269.72 |
| 124.73 | 258.34 | 316.72 | 299.02 | 182.00 | 269.75 | ||
| 124.60 | 258.13 | 316.51 | 297.85 | 183.13 | 269.50 | ||
| 124.75 | 258.27 | 316.10 | 296.42 | 183.26 | 268.82 | ||
| 124.73 | 258.00 | 317.10 | 295.43 | 181.69 | 269.73 | ||
| 124.72 | 257.47 | 181.29 | 269.96 | ||||
| 125.49 | 256.62 | 180.91 | 269.91 | ||||
| 180.30 | 270.22 | ||||||
| 180.26 | 271.49 | ||||||
| 180.73 | 270.54 | ||||||
| 175.64 | 274.70 | ||||||
| 177.73 | 273.86 | ||||||
| 178.62 | 272.93 | ||||||
| Resultant Centroid Shift | |||||||
| 6.2 | 7.6 | 2.4 | 4.3 | 9 | 15.8 | 16.2 | 14 |
Table 1. Centroid of nodule candidates in consecutive CT slice images.
| Nodule Candidate (a) | Nodule Candidate (b) | ||||||||
|---|---|---|---|---|---|---|---|---|---|
| Area(pixels) | Change in Area | Equiv Diameter(pixels) | Change in Equiv Dia | Edge sharpness | Area(pixels) | Change in Area | Equiv Diameter(pixels) | Change in Equiv Dia | Edge sharpness |
| 24 | - | 5.52 | - | 0.11 | 19 | - | 4.92 | - | 0.063 |
| 75 | 51 | 9.77 | 4.24 | 0.17 | 21 | 2 | 5.17 | 0.25 | 0.068 |
| 145 | 70 | 13.58 | 3.82 | 0.24 | 22 | 1 | 5.29 | 0.12 | 0.068 |
| 218 | 73 | 16.66 | 3.07 | 0.32 | 20 | 2 | 5.05 | 0 | 0.062 |
| 260 | 42 | 18.19 | 1.53 | 0.33 | 20 | 0 | 5.05 | 0.24 | 0.066 |
| 291 | 31 | 19.24 | 1.05 | 0.37 | 18 | 2 | 4.79 | 0.25 | 0.061 |
| 306 | 15 | 19.73 | 0.48 | 0.35 | |||||
| 312 | 6 | 19.93 | 0.19 | 0.35 | |||||
| 288 | 24 | 19.14 | 0.78 | 0.31 | |||||
| 256 | 32 | 18.05 | 1.09 | 0.21 | |||||
| 232 | 24 | 17.18 | 0.89 | 0.27 | |||||
| 169 | 63 | 14.67 | 2.52 | 0.27 | |||||
Pixel spacing for this database image=0.76mm (x)/0.76mm (y) ; 1 ×1 pixel area=0.569mm
Table 2. Change in shape analysis in consecutive CT slice images.
| Case No | Database CaseID |
Volume Scan1( pixels) |
Volume Scan2(pixels) |
Volume Diff |
RNG |
|---|---|---|---|---|---|
| 1 | 1 | 630 | 9840 | 9210 | 14.619 |
| 2 | 2 | 2108 | 2576 | 468 | 0.222 |
| 3 | 6 | 95 | 234 | 139 | 1.4632 |
| 4 | 7 | 149 | 181 | 32 | 0.2148 |
| 5 | 8 | 90 | 91 | 1 | 0.0111 |
| 6 | 10 | 1490 | 1508 | 18 | 0.0121 |
| 7 | 11 | 5640 | 5970 | 330 | 0.0585 |
| 8 | 13 | 8197 | 8746 | 549 | 0.067 |
| 9 | 15 | 447 | 646 | 199 | 0.4452 |
| 10 | 16 | 284 | 318 | 34 | 0.1197 |
| 11 | 18 | 3709 | 3839 | 130 | 0.035 |
| 12 | 20 | 1340 | 1353 | 13 | 0.0097 |
| 13 | 21 | 2239 | 2233 | 6 | 0.0027 |
| 14 | 23 | 2807 | 3031 | 224 | 0.0798 |
| 15 | 24 | 930 | 901 | 29 | 0.0322 |
| 16 | 25 | 1485 | 1961 | 476 | 0.3205 |
| 17 | 28 | 956 | 1340 | 384 | 0.4017 |
| 18 | 29 | 64 | 66 | 2 | 0.0313 |
| 19 | 32 | 112 | 124 | 12 | 0.1071 |
| 20 | 33 | 643 | 649 | 6 | 0.0093 |
| 21 | 34 | 106 | 160 | 54 | 0.5094 |
| 22 | 36 | 1028 | 1098 | 70 | 0.0681 |
| 23 | 37 | 1818 | 2430 | 612 | 0.3366 |
| 24 | 38 | 1742 | 1835 | 93 | 0.0534 |
| 25 | 39 | 1920 | 2533 | 613 | 0.3193 |
| 26 | 40 | 773 | 954 | 181 | 0.2342 |
| 27 | 41 | 1236 | 1566 | 330 | 0.267 |
| 28 | 42 | 611 | 850 | 239 | 0.3912 |
| 29 | 44 | 690 | 1356 | 666 | 0.9652 |
| 30 | 45 | 866 | 1223 | 357 | 0.4122 |
| 31 | 46 | 136 | 149 | 13 | 0.0956 |
| 32 | 47 | 1688 | 2111 | 423 | 0.2506 |
| 33 | 48 | 653 | 381 | 272 | 0.7139 |
| 34 | 49 | 4280 | 4950 | 670 | 0.1565 |
Table 3. Rate of nodule growth in two scans of same patient.
Discussion
In this study, three important steps were applied to detect the cancerous nature of lung. First, the candidate nodules were segmented using ACKMS algorithm. Next, the real nodules were classified by eliminating vessels and calcifications using variability in centroid and shape in the consecutive CT scan images. Finally, two scans of same patient taken at different times were processed to quantify the nodule growth rate. The CT scan images of 34 patients retrieved from VALCANO database were analyzed. All the three aforementioned steps were applied to the CT images taken at two different time points. For the patient 2, twenty-three CT images each for scan-1 and scan-2 performed at different times were processed and the k-means segmentation result is presented in Figure 1. All the suspect tissue clusters with size<3 mm (5 pixels) were considered as candidate nodules. Around 25 to 30 candidate nodules (<3 mm) were segmented from each slice. A total of 642 candidate nodules from all the 23 CT images of scan 1 for patient 2 were segmented. The nodule cluster detected in one slice may exist in few consecutive slices. The segmented candidate nodules from consecutive slices were reconstructed to form a 3D visualization which enables distinguishing the real nodules from vessels that appear like nodules in 2D slices. The complete 3D reconstruction image of all 642 segmented candidate nodules of case 2 is shown in Figure 5. The variability in centroid position and shape as well as edge sharp analysis carried out on each candidate nodule from consecutive slices of CT scan is shown in Figure 6. The candidate nodules with widely varying centroid position were considered as vessels and those with less centroid change and constant area and equiv-diameter in consecutive slices were considered as calcifications. The presence of nodules (Figures 6a-6d) was recorded in 12, 6, 10, and 18 consecutive slices, respectively. The corresponding centroid values for these candidate nodules are presented in Table 1.
For candidate nodule a and b, the resultant centroid value did not change more than 10 pixel across x and y coordinates; the resultant centroid values were for a ( 6.2, 7.6) and b (2.4, 4.3). The centroid values for candidate nodule c and d were (9, 15.8) and (16.2, 14), respectively, which were higher than that for nodules a and b. Therefore, the candidate nodules c and d were eliminated and only nodules a and b were considered for shape variance analysis. The area, equiv-diameter, and edge sharpness were computed for these nodules and presented in Table 2. It was noticed that these corresponding values were changed more for candidate nodule a than nodule b. This suggested that the shape of the nodule b was unchanged throughout consecutive CT slices and this nodule had smooth structure. Hence the nodule b might be a calcification and not real nodule. These results were in line with the radiologist’s observation in the database that the nodule a is the potential real nodule which might be cancerous in nature. The physicians need to validate this before going for biopsy. As the malignant or cancerous nodule has the growth potential over their benign counterparts, the nodule growth is considered as one of the valid indicators used to diagnose its cancerous nature. Since any small change in area computed from 2D image may reflect significant deviation in 3D reconstruction and volume analysis. Therefore, nodule growth is reliable if it is measured in terms of volume (cumulative area of nodule in consecutive slices). The RNG was computed for all segmented nodules classified as real. A total of 34 real nodules were segmented and RNG was computed which is given in Table 3.Three cases showed an increase in volume of more than double. The corresponding RNG value for case no 1, 3 and 44 was 14.6, 1.46, and 0.96 which was found to grow approximately by 15, 1.5 and 1 folds, respectively, compared with the initial scan. This noticeable growth confirms that these nodules are malignant in nature. There were 14 cases for which the RGN ranged between 0.2 and 0.8, suggesting a reasonable growth that requires repetition of scan after few days to confirm malignancy. Of the remaining 17 cases, 7 had RNG of less than 0.2 i.e., almost no change and 10 cases showed minimum nodule growth which may require follow-up scans.
Conclusion
An efficient and completely automated 3-D segmentation algorithm to diagnose malignant lung nodules was successfully developed and applied in this work. Based on parameters analyzed such as centroid shift value and shape (area and equiv-diameter), out of almost 700 nodules studied, we found 34 nodules real nodules. The volume growth analysis using 3D reconstruction revealed that there were 3 cancerous nodules which corroborated radiologist findings. Thus this new methodology provides exact quantitative nodule growth that enables physician's qualitative analysis to detect malignant nodules. In future, this work can be extend, to mathematically model the texture or shape feature of the nodules from an earlier CT scan which have the potential to grow. The number of patient cases (34 cases) analyzed in this study need to be increase in future to make this algorithm more reliable.
References
- Siegel R, Ma J, Zou Z, Jemal A. Cancer statistics, 2014. CA Cancer J Clin 2014; 64: 9-29.
- Michael KG, Donington J, Lynch WR, Mazzone PJ, Midthun DE, Naidich DP, Wiener RS. Evaluation of individuals with pulmonary nodules: When is it lung cancer?: Diagnosis and management of lung cancer: American College of Chest Physicians evidence-based clinical practice guidelines. CHEST 2013; 143: e93S-e120S.
- Chheang S, Kathleen B. Lung cancer staging: clinical and radiologic perspectives.Semin Intervent Radiol 2013; 30: 99.
- Lassen BC, Jacobs C, Kuhnigk JM, van Ginneken B, van Rikxoort EM. Robust semi-automatic segmentation of pulmonary subsolid nodules in chest computed tomography scans. Physics Med Biol 2015; 60: 1307.
- Octavio G, González JA, Morales EF. Image segmentation using automatic seeded region growing and instance-based learning: In: Progress in pattern recognition, image analysis and applications. Springer, Berlin, 2007; 192-201.
- Kumar TKS, Ganesh EN,Umamaheswari R. Automatic lung nodule segmentation using autoseed region growing with morphological masking (ARGMM) and feature extraction through complete local binary Pattern and microscopic information pattern. EuroMediterranean J Biomedical 2015; 10: 99-119.
- Senthil KTH, Ganesh N, Umamaheswari R. Texture Pattern Based Lung Nodule Detection (TPLND) Technique in CT Images. Int Rev Comput Software (IRECOS) 2014; 9: 415-426.
- Shireen EY, Abd EL Munim H, Elshazly S, Farag AA, Aboelghar M. Experiments On Sensitivity Of Template Matching For Lung Nodule Detection In Low dose CT Scans: In: Signal Processing and Information Technology, 2007 IEEE International Symposium on. 2007; 1029-1035.
- Ryoichi N, Kawaguchi T, Miyake H. Automated detection of lung nodules in chest radiographs using a false-positive reduction scheme based on template matching. Biomed Eng Informatics (BMEI) 2012.
- Jo HH, Hong H, Goo JM. Pulmonary nodule registration in serial CT scans using global rib matching and nodule template matching. Comput Biol Med 2014; 45: 87-97.
- Mehdi A, Kovalev V, Snezhko E, Taimouri V. A Comprehensive Framework for Automatic Detection of Pulmonary Nodules in Lung CT Images. Image Anal Stereol 2014; 33: 13-27.
- Önder D, Çamurcu AY. Computer-aided detection of lung nodules using outer surface features. Biomed Materials Eng 2015; 26: 1213-1222.
- Lu L, Tan Y, Schwartz LH, Zhao B. Hybrid detection of lung nodules on CT scan images. Med Phys 2015; 42: 5042-5054.
- Reeves AP, Chan AB, Yankelevitz DF, Henschke CI, Kressler B. On measuring the change in size of pulmonary nodules. IEEE Trans Med Imaging 2006; 25: 435-450.
- Yuanjie Z, Kambhamettu C, Bauer T, Steiner K. Accurate estimation of pulmonary nodule's growth rate in CT images with nonrigid registration and precise nodule detection and segmentation. IEEE Computer Society Conference 2009; 101-108.
- Jane PK, Berman EJ, Kaur M, Babb JS, Bomsztyk E, Greenberg AK, Naidich DP, Rusinek H. Pulmonary Nodules: growth rate assessment in patients by using serial CT and three-dimensional volumetry. Radiology 2012; 262: 662-671.
- Smith GT, Rahman AR, Li M, Moore B, Gietema H. Reproducibility of Volumetric Computed Tomography of Stable Small Pulmonary Nodules with Implications on Estimated Growth Rate and Optimal Scan Interval. PLoS One 2015; 10: e0138144.
- Kobayashi Y, Mitsudomi T, Sakao Y, Yatabe Y. Genetic features of pulmonary adenocarcinoma presenting with ground-glass nodules: the differences between nodules with and without growth. Annal Oncology 2015; 26: 156-161.
- Ryutaro K, Muramatsu Y, Kusumoto M, Tsuchida T, Tsuta K, Maeshima AM, Asamura H, Moriyama N. Solitary Pure Ground-Glass Nodules 5 mm or Smaller: Frequency of Growth. Radiology 2015.
- http:// www.via.cornell.edu/challenge/index.html
- Aristidis L, Vlassis N, Verbeek JJ. The global k-means clustering algorithm. Pattern recognition 2003; 36: 451-461.
- Eric L. Sliceomatic. Matlab Central, 2001.
- Elisabeth W, Wijesooriya K, Dill SV, Keall PJ. Tumor and normal tissue motion in the thorax during respiration: Analysis of volumetric and positional variations using 4D CT. Int J Radiation Oncol Biol Physics 2007; 67: 296-307.
- Kenneth HD, Kasales CJ, Eggli KD, TenHave TR, Belman NM, Potok PS,Van Slyke MA. The impact of 2D versus 3D quantitation of tumor bulk determination on current methods of assessing response to treatment. J Comput Tomography 1996; 20: 930-937.