ISSN: 0970-938X (Print) | 0976-1683 (Electronic)
Biomedical Research
An International Journal of Medical Sciences
Research Article - Biomedical Research (2018) Volume 29, Issue 14
Lung cancer segmentation and diagnosis of lung cancer staging using MEM (modified expectation maximization) algorithm and artificial neural network fuzzy inference system (ANFIS)
Department of Electrical and Electronics Engineering, Saveetha School of Engineering, Saveetha Institute of Medical and Technical Sciences, Saveetha University, Thandalam, Chennai, India
- *Corresponding Author:
- Lavanya M
Department of Electrical and Electronics Engineering
Saveetha School of Engineering
Saveetha Institute of Medical and Technical Sciences
Saveetha University, Thandalam, Chennai, India
Accepted date: June 29, 2018
DOI: 10.4066/biomedicalresearch.29-18-740
Visit for more related articles at Biomedical ResearchMedical image processing plays a major role in advancing treatment planning, identification of disease and guiding for surgery. Lung cancer is one among the dangerous diseases that leads to death of most human beings due to uncontrolled growth in the cell. This research area is finding more importance among researchers is that because the available methods for lung cancer detection are very painful. So the automatic detection of lung nodule of computer tomography (CT) is finding more importance among researchers. Though there are a number of methods available for segmentation of lung nodules each method has its drawbacks because of the divergence that exists in lung nodule. The proposed method is the detection of lung nodules using MEM algorithm and classification is based on Artificial Neural Network Fuzzy Inference System (ANFIS) experimental results illustrate in an improvement of accuracy and reduction of false positive results. A comparative analysis is performed with FCM and FLICM algorithms to show the superior nature of MEM.
Keywords
CT, ANFIS, Nodule, MEM algorithm, Segmentation.
Introduction
Lung cancer has become one of the leading causes of death rates all over the world [1,2]. Cancer is caused because of uncontrolled cell growth if not treated in time it spreads throughout the body and results in death. The major cause of cancer is due to smoking and secondary cause is continuous exposure to air pollution, radon gas, gene mutation and secondhand smoking [3]. The major symptoms include chest pain due to a continuous cough that extends to weight loss, weakness, shortness of breath [4,5]. There are various advanced techniques that are followed for treating cancer chemotherapy, radiation therapy, and surgery. However, these treatments are very painful [6-9]. So to overcome this biomedical image processing plays a vital role when the diagnostic test is very simple and improves the survival rate of the people.
Though the technique of automatic lung nodule is tough to perform there is always a way for improvement [10,11]. The CT images are collected from the LIDC database and image noise is removed through pre-processing step and the lung cancer nodule is detected and finally, the lung cancer stage is classified [12-16].
Segmentation methods are classified into seven major types in this work clustering method of segmentation is considered [17-19]. Several clustering methods are implemented still some room for improvement is always required. The clustering methods that are already implemented are discussed below.
Deen [20] proposed Fuzzy C-Means (FCM), a technique applied when clustering is needed, and this technique allows one piece of data to belong to more than one cluster by assigning a membership value of each data pattern to each cluster. Assigned membership values are between 0 to 1 and membership values for each data from all the clusters will add to 1. But the system has the following drawbacks like the prior specification of the number of clusters; the number of iterations is more.
Kumar [21] proposed K-means clustering technique, it is a clustering method used for segmentation by dividing the objects into k groups first by calculating the mean than computing the distance between each point from the cluster mean. The main drawback of this method is firstly it is difficult to predict the k-value. For different initial partitions, different results are produced, it does not produce good results for different size and different density clusters and finally, it doesn’t work well with global clusters.
Wau [22] proposed Mean Shift Segmentation Algorithm it works by defining a window around it and then calculating mean of the data point. This uses kernel approach for calculating the density of the gradient point. The drawbacks of this method are the output depends on the window size and the computation is expensive and it does not scale well with a dimension of feature space.
Yiming [23] proposed the Expectation Maximization algorithm; it is an iterative procedure which is used to compute maximum likelihood estimates for the missing or hidden data. In this method, the model parameters are predicted from the most likely data. Each iteration consists of two steps: E-step that estimated missing data of the model parameters-steplikelihood data is maximized by assuming the missing data are identified. The main drawback is it has slow convergence in some cases.
To overcome the above drawbacks a new method is proposed Modified Expectation Maximization where Comparison of a pixel to a pixel is done using a replicated matrix for the hidden data’s calculation. So the segmentation result is more accurate when compared to other techniques.
Proposed Method
Figure 1 shows the proposed method obtained images from the database (LDIC) further the images are enhanced using a technique adaptive equalization and noise removal is done using median filter and segmentation of the nodule is carried out using MEM algorithm and feature extraction is done and disease classification is done using ANFIS classifier.

Figure 1: Block diagram of proposed method.
Image enhancement using adaptive histogram equalization
Adaptive histogram equalization has found its importance in application because of its efficiency and simplicity [24]. It enhances the image and improvises the visual effects by enlarging the gray distribution of the image according to its probability distribution function. It overcomes the drawbacks of the existing histogram method by automatically identifying and adapting the gray level of the image. Figure 2 shows the original image. Figure 3 shows the enhanced image through histogram equalization.

Figure 2: Original image.

Figure 3: Image enhancement using histogram equalization.
Noise removal using median filtering
The median filter is used for reducing noise, particularly impulsive noise and salt and pepper noise [25]. It also reduces random noise and it pertains to the edge information of the image. It replaces the pixel with the median of all pixels of its neighborhoods (ω). Figure 4 shows the pre-processed image.
y (m, n)=median (x (i, j), (i, j) ɛ ω)

Figure 4: Pre-processed image using median filtering.
Segmentation using MEM (modified expectation maximization) algorithm
MEM algorithm calculated value is related to the segment depend on the weights how the calculated value is completely related to the segregated portion. Comparison of a pixel to a pixel is done using a replicated matrix for the hidden data’s calculation. So the segmentation result is more accurate when compared to other techniques. Figure 5 shows the lung nodule segmented using the MEM segmentation method.
1. MEM algorithm consists of following steps:
2. First initialize expectation and the maximization step parameters.
3. Then increase the maximization step by one.
4. Next step is to concatenate the input image.
5. Replace expectation and maximization matrices.
6. Find out the difference between the replicated and input image.
7. Calculate the new expectation and maximization step position.
8. Iterate the expectation and maximization step value.

Figure 5: Segmented nodule using MEM algorithm.
Feature extraction
After the completion of the segmentation process, the segmented nodule is utilized for feature extraction process which acts as one of the important steps for providing more detailed information about the image [26]. The physical features extracted are:
1. Area: Area represents the aggregate of the area of a pixel value in the image that is normally registered as 1 in the given binary image A=n (1).
2. Perimeter: The perimeter represents the total count of pixels at the edge of the given object.
3. Eccentricity: It represents the distance between the major axis and the foci of the ellipse.
Classification using ANFIS classifier
ANFIS is a neural network based approach which is a datadriven process [27]. This is based on a clustering approach where training sets are clustered for an unknown function. Figure 6 shows the ANFIS classifier.

Figure 6: ANFIS structure.
The individual layer function is described below:
Layer 1: Every node in this layer ‘i’ is adaptive with the node function
Oi1=μAi (x)
x: Input node.
Ai: The linguistic variable associated with node function.
μA: Membership function of AiμAi (x) is chosen as:
μAi (x)=1/((1+((x-ci)/ai)2) bi)
μAi (x)=exp (-((x-ci)/ai)2)
Where x is the input and (ai,bi,ci) is the premise parameter set.
Layer 2: Each node in layer 2 is a fixed node that calculates the firing strength wi.
The output of nodes in this layer is a product of incoming signals to it, expressed as:
Oi2=wi=μAi (x) μBi (y), i=1, 2
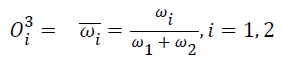
Layer 3: Each node is a fixed node in this layer. Each node calculates ration of ith firing strength of sum of firing strength. The output of this node is expressed as:
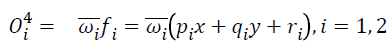
Layer 4: Each node in this layer is an adaptive node. Node function is expressed as:
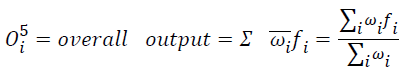
Layer 5: Only one fixed node is available in this layer, the overall output is a summation of all incoming signals.
Results and Discussion
The image segmentation process is done using a MEM segmentation method using MATLAB version14. For performance analysis the various parameters are discussed [28].
Sensitivity=True positive/(True positive+False negative)
Specificity=True negative/(True negative+False positive)
Accuracy=(True positive+True negative)/(True positive+False negative+True negative+False positive)
Positive predictive value (Ppv)=True positive/(True positive +False negative)
The performance parameters of the proposed system are tabulated which represents the accuracy of training data sets. Table 1 shows the performance measures of the proposed system when compared with existing systems like FCM and FLICM. T1 indicates stage 1 cancer; T2 indicates stage 2 cancer; T3 indicates stage-3 cancer; T4 indicates stage 4 cancer.
| Performance parameters | Sensitivity | Specificity | Precision | Accuracy |
|---|---|---|---|---|
| FCM segmentation and BPN classification | 0.9087 | 0.92 | 0.927 | 0.859 |
| FLICM segmentation and SVM classification | 0.75 | 0.84775 | 0.9 | 0.9 |
| MEM segmentation and ANFIS classification | 0.82 | 0.69 | 0.97 | 0.95 |
Table 1: Comparison of performance measures of the proposed system with existing system.
Figure 7 (a-c) shows the original image obtained from the LIDC database, the lung nodule segmented image using a MEM segmentation algorithm and the cancer stage result obtained from the training given to ANFIS algorithm based on the data’s obtained through feature extraction of the segmented nodule respectivley.

Figure 7: (a) The original image; (b) Segmented image; (c) Cancer stage.
The sensitivity comparison is shown in Figure 8. The proposed system provides better sensitivity (82%) when compared with SVM (75%) but lesser when compared to BPN (90.8%). The sensitivity of this algorithm will increase with an increase in the number of images.

Figure 8: Sensitivity comparison.
The specificity comparison of existing with proposing is shown in Figure 9. The existing system BPN (92%) and SVM (84.7%) has less specificity than that of the proposed system ANFIS (69%).

Figure 9: Specificity comparison.
The accuracy comparison is shown in Figure 10. The proposed system ANFIS yields result with better accuracy (95%) when compared with existing BPN (85%) and SVM (90%). With an increase in the number of images accuracy of the proposed system will increase.

Figure 10: Accuracy comparison.
The precision comparison of existing method BPN (92%), SVM (90%) and proposed system ANFIS (97%) are shown in Figure 11. The results of the proposed system are good when compared with that of the existing systems.

Figure 11: Precision comparison.
Conclusion
In this paper, a unique method for segmentation is tested. The process starts with image enhancement done using histogram equalization followed by pre-processing done by median filtering and segmentation process is done by a MEM segmentation algorithm for further classification for the segmented nodule to detect the severity of the disease is done by ANFIS classifier. This method performs better compared to FCM and FLICM clustering algorithms that is proved by the performance measures of sensitivity 82%, specificity 92%, precision 97% and accuracy 95%. The future work can be extended by hybridization of MEM algorithm with edge detection techniques to further increase the accuracy of segmentation of lung nodule.
References
- World Health Organization. Description of the global burden of NCDs, their risk factors and determinants, Burden: mortality, morbidity and risk factors. World Health Organization, Switzerland 2011; 9-32.
- Siegel R, Naishadham D, Jemal A. Cancer statistics. CA Cancer J Clin 2013; 63: 11-30.
- Richard D. Lung cancer and other causes of death in relation to smoking. BMJ 1956; 2: 1071-1081.
- Ruth LK, Jeff D, Declan W. Symptoms of lung cancer. Palliat Med 1992; 6: 309-315.
- Mark SW, Denise MZ, Edwin BF. Depressive symptoms after lung cancer surgery: their relation to coping style and social support. Psycho Oncol 2005; 15: 684-693.
- Non-Small Cell Cancer Collaborative Group. Chemotherapy in non-small cell lung cancer: a meta-analysis using updated data on individual patients from 52 randomised clinical trials. BMJ 1995; 311: 899-909.
- Edward SK, Roy SH, Ignacio IW. The battle trial: personalizing therapy for lung cancer. Cancer Discovery 2011; 1: 44-53.
- Robert T, Rebecca P, James G. Stereotactic body radiation therapy for inoperable early stage lung cancer. Preliminary Communication 2010; 303: 1070-1076.
- The International Adjuvant Lung Cancer Trial Collaborative Group. Cisplatin-based adjuvant chemotherapy in patients with completely resected non-small-cell lung cancer. The New England J Med 2004; 350: 351-360.
- Sieren J, Weydert J, Bell A. An Automated segmentation approach for highlighting the histological complexity of human lung cancer. Ann Biomed Eng 2010; 38: 3581-3591.
- Niccolo C, Ilaria G, Alessandra R. Combination of computer-aided detection algorithms for automatic lung nodule identification. Int J Computer Assisted Radiol Surg 2012; 7: 455-464.
- Armato SG, McLennan G, Hawkins D. The lung image database consortium (LIDC) and image database resource initiative (IDRI): a completed reference database of lung nodules on CT scans. Med Phys 2011; 38: 915-931.
- Armato SG. Lung image database consortium: developing a resource for the medical imaging research community. Radiology 2004; 232: 739-748.
- Clarke LP, Croft BY, Staab E. National Cancer Institute initiative: Lung image database resource for imaging research. Acad Radiol 2001; 8: 447-450.
- Shiraishi J. Development of a digital image database for chest radiographs with and without a lung nodule: Receiver operating characteristic analysis of radiologists’ detection of pulmonary nodules. Am J Roentgenol 2000; 174: 71-74.
- Reeves P. A public image database to support research in computer aided diagnosis. 31st Annual International Conference of the IEEE Engineering in Medicine and Biology Society 2009; 12: 3715-3718.
- Mokhled S,Tarawneh SA. Lung cancer detection using image processing techniques. Leonardo Electronic J Pract Technol 2012; 20: 74-79.
- Lee SLA, Kouzani AZ, Hu EJ. Automated detection of lung nodules in computed tomography images: a review. Machine Vision and Applications 2012; 23: 151-163.
- Diciotti S, Picozzi G, Falchini M. 3-d segmentation algorithm of small lung nodules in spiral ct images. IEEE Trans Inform Technol Biomed 2008; 12: 7-19.
- Jalal Deen K, Ganesan R, Merline A. Fuzzy-C-means clustering based segmentation and CNN-Classification for accurate segmentation of lung nodules. Asian Pac J Cancer Prev 2017; 18: 1869-1874.
- Akhilesh Kumar Y, Divya T, Sonali A. Clustering of lung cancer data using Foggy K-means. IEEE 2013 International Conference on Recent Trends in Information Technology (ICRTIT) 2013; 13: 13-18.
- Ying W, Rui L, Jin ZY. An algorithm for segmentation of lung ROI by mean-shift clustering combined with multi-scale HESSIAN matrix dot filtering. J Central South Univ 2012; 19: 3500-3509.
- Qian Y, Weng G. Lung nodule segmentation using EM algorithm. IEEE 2014 Sixth International Conference on Intelligent Human-Machine Systems and Cybernetics 2014; 14: 20-25.
- Rajesh G, Bhawna M, Sheetal G. Histogram equalization techniques for image enhancement. IJECT 2011; 2: 107-111.
- Zhou W, Zhang D. Progressive switching median filter for the removal of impulse noise from highly corrupted images. IEEE Transactions on Circuits and Systems II: Analog and Digital Signal Processing 1999; 46: 78-80.
- Wen Z, Nancy Z, Ning W. Sensitivity, specificity, accuracy, associated confidence interval and ROC analysis with practical SAS® implementations. Health Care Life Sci 2010; 5: 1-9.
- Pasi L. Similarity classifier using similarity measure derived from Yu's norms in classification of medical data sets. Computers in Biol Med 2007; 37: 1133-1140.
- Lavanya M, Muthu Kannan P, Lung lesion detection in CT scan images using the fuzzy local information cluster means (FLICM) automatic segmentation algorithm and back propagation network classification. Asian Pacific J Cancer Prevention 2017; 18: 3395-3399.