ISSN: 0970-938X (Print) | 0976-1683 (Electronic)
Biomedical Research
An International Journal of Medical Sciences
Research Article - Biomedical Research (2020) Volume 31, Issue 6
Investigation on coupling between tectorial membrane mode and basilar membrane mode along cochlea.
1Department of Electrical, Electronic and Information Engineering, Kansai University, Osaka, Japan
2Department of Informatics, Kansai University, Osaka, Japan
- *Corresponding Author:
- Toshiaki Kitamura
Department of Electrical, Electronic and Information Engineering
Faculty of Engineering Science Kansai University
Osaka, Japan
Accepted date: November 06, 2020
We analyzed the dispersion relations of the tectorial membrane mode and the basilar membrane mode of the cochlea. We focused on the coupling between these two modes. We estimated the coupling points of the modes from the intersection points where the dispersion curves of both modes cross. We investigated the relationship between the frequency and the location of the intersection points and compared the result with the frequency map obtained from Greenwood function.
Keywords
Tectorial membrane mode, Basilar membrane mode, Mode coupling, Frequency map
Introduction
The cochlea is a fluid-filled snail-shaped duct that detects sound waves and converts them into electrical signals. The cochlea amplifier provided by the Outer Hair Cells (OHCs) of the organ of Corti enhances the sensitivity and frequency selectivity. The OHCs are sandwiched between the Tectorial Membrane (TM) and the Basilar Membrane (BM).
TM is an a cellular matrix that spirals along the entire length of the cochlea and it is firmly attached to the spiral limbus. TM was once thought to act merely as stiff beam but recent studies have shown that wave motions of TM may play an important role in determining frequency tuning [1-6]. Ghaffari et al. have shown that the Tectb mutation reduces the spatial extent and propagation velocity of TM travelling waves. By reducing the spatial extent of TM waves, the frequency selectivity is increased. On the other hand, the decrease of the TM wave velocity reduces the number of hair cells that effectively couple energy to the basilar membrane and thereby reduces sensitivity [1]. Russell et al. have also shown that a mouse with genetically modified β-tectorin exhibits an enhanced tuning and reduced sensitivity in the high frequency region [2].
A lot of analytical models of TM have developed so far. TM has been described as a rigid pivot, a resonant structure, and a free-floating mass in cochlea models [7-10]. Cai et al. have analyzed basal regions as well as apical ones of the guinea pig cochlea by using hybrid analytical- finite-element approach. They have solved the fluid-solid interaction eigenvalue problem for the axial wavenumber, fluid pressure, and vibratory relative motions of the cochlear partition as a function of frequency [11].
We call the mode of the wave propagation based on the interaction between TM and the fluid the tectorial membrane mode (TM mode). Meanwhile, it is well known that the slow waves occur when there is interaction between BM and the fluid, wherein the waves are distributed in the vicinity of BM [12]. We call this mode of propagation the basilar-membrane mode (BM mode).
In this study, we focus on the coupling between TM mode and BM mode. We analyzed the dispersion diagrams of these two modes on a 2D cross-sectional model of the cochlea by using COMSOL Multi physics based on the finite element method (FEM). We investigated the intersection points where the dispersion curves of TM mode and BM mode cross. Here, we estimated the coupling points of both modes form the intersection points. We studied the relationship between the frequency and the location of the intersection points. We showed the possibility that the coupling between TM mode and BM mode play an important role in the frequency selectivity of the cochlea by indicating the similarity between this result and the frequency map obtained from Greenwood function.
Materials and Methods
The human cochlea is a fluid-filled snail-shaped structure about 35 mm in length. We modeled it as an uncoiled dual chambered fluid-filled duct, which incorporates either TM or BM. To simplify the problem, the other parts of the organ of Corti and Reissner's membrane are not included in the analysis model. Figure 1 shows the cross-section of the cochlea. We used mode analysis on the 2D structure in Figure 1 to investigate the propagation characteristics. We assumed that the cochlear duct has a rectangular shape and enclosed by rigid boundaries except for BM. TM is an a cellular tissue overlying the stereocilia bundles of the outer hair cells as shown in Figure 2. To simplify the model, we assumed that TM has a rectangular shape and inclines at the angle of 30 degrees with the y axis. TM is firmly attached to the spiral limbus and we modeled it as the rigid boundary shown in Figure 1. Structural parameters, such as the sizes of the chambers and the widths, heights, and Young's moduli of TM and BM, vary along the cochlea duct. We assumed that the size of the chambers, the heights of TM and BM, and the Young's modulus of BM were uniform along the cochlea. The heights and widths of the two chambers were 2 mm and 4 mm [12], the heights of TM and BM were 35 μm [13] and 2.5 μm [14], and the Young's modulus of BM was 10 MPa [15]. We considered the Young's modulus ET and the width wT of TM, and the width wB of BM as parameters and assumed that they vary according to the following equations [13,14,16].

Figure 1: Cross section of cochlea.

Figure 2: TM overlying the stereocilia bundles of the outer hair cells.
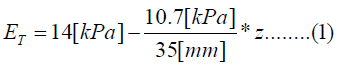
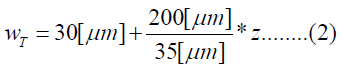
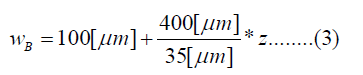
Where z is the position along the cochlea and varies from 0 mm to 35 mm. The fluid was assumed to be an ideal fluid and its viscosity and damping are not included. The density and bulk modulus of the fluid were 1.034 × 10³ kg/ m3 [17] and 2.2 × 10⁹ Pa [18], and the density, Poisson's ratio of TM and BM were 1.2 × 10³ kg/m3 [17] and 0.49 [17]. We used COMSOL Multi physics based on FEM to analyze the structure, where the number of elements was 7316.
Results and Discussion
Figure 3 shows the dispersion diagram of TM mode and BM mode when z=(a) 0 mm, (b) 17.5 mm, and (c) 35 mm, where the horizontal and vertical axes are the acoustic- wave frequency f and the angular wavenumber k. Here, we used the model that has only TM for analyzing the TM mode in order to exclude the mode coupling effect on the dispersion diagram. We also analyzed the BM mode in the same way as the TM mode. As shown in these figures, the wavenumbers of TM mode increase more rapidly than BM mode as a function of frequency regardless of the position z along the cochlea. Thereby, the dispersion curves of both modes intersect each other at a frequency. It is understood that the intersection frequency gets lower as the position z moves from the base (z=0 mm) to the apex (z=35 mm).

Figure 3: Dispersion diagram when z= (a) 0 mm, (b) 17.5 mm, and (c) 35 mm: TM mode (solid line) and BM mode (dashed line).
Figure 4 shows the angular wavenumber k of TM mode and BM mode as a function of z, when the acoustic-wave frequencies f=(a) 1000 Hz and (b) 10000 Hz. As shown in Figure 4 (a), the wavenumber of BM mode has a small value until z is less than about 5 mm and it starts to increase from this point. On the other hand, the wavenumber of TM mode starts to increase rapidly from the point where z is about 13 mm, and the propagation mode doesn't exist until this point. It is confirmed that both modes intersect each other at the point where z is about 28 mm. Figure 4 (b) indicates that the wavenumbers of TM mode and BM mode start to increase from the point where z=0 mm when f=10000 Hz. The wavenumber of TM mode increases more rapidly than BM mode and both modes intersect at the point where z is about 3 mm.

Figure 4: Angular wavenumber as a function of z when f= (a) 1000 Hz and (b) 10000 Hz: TM mode (solid line) and BM mode (dashed line).
Figure 5 displays the displacement of TM when f=100 Hz and z=35 mm (TM mode). Here, the amplitude and direction of the displacement are shown by the vectors. Because the one end of TM is the rigid boundary as shown in Figure 1, the displacement gets bigger toward the other end. It is understood that the direction of the displacement coincides with the horizontal movement of the stereocilia bundles of the outer hair cells in reference to Figure 2. We confirmed that the direction of the displacement hardly depends on the frequency f and the position z.

Figure 5: Displacement of TM when f=100 [Hz] and z=35 [mm] (TM mode).
Figure 6 shows the frequency map obtained from the intersection points of TM mode and BM mode (solid line). Here, the horizontal axis is the position z along the cochlea and the vertical axis is the frequency f. In this figure, the dashed line shows the results calculated by Greenwood function that is expressed as follows [19];

Figure 6: Frequency map: obtained from the intersection points of TM mode and BM mode (solid line) and Greenwood function (dashed line).
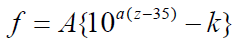
where the unit of z is mm and the parameters are chosen as A=165.4, a=0.06 and k=0.88 according to the reference [19], As shown in Figure 6, the frequency of the intersection points of TM mode and BM mode changes from about 18 kHz to about 120 Hz in association with the position along the cochlea from the base to the apex. On the other hand, the frequency of the Greenwood function results changes from about 20 kHz to about 20 Hz. Our results decrease more sharply than the Greenwood function results until z is about 5 mm and the decrease rate becomes small when z is more than 5 mm. The curve figure strongly depends on the parameter values such as the Young's moduli, widths, and thicknesses of TM and BM. We haven't tried to find out the optimum values of these parameters so as to fit well with the Greenwood function results.
Conclusion
We analyzed the dispersion relations of TM mode and BM mode of the cochlea. We investigated the relationship between the frequency and the location of the intersection points where the dispersion curves of the two modes cross. We showed the possibility that the coupling between TM mode and BM mode play an important role in the frequency selectivity of the cochlea by indicating the similarity between this result and the frequency map obtained from Greenwood function.
Acknowledgment
This research was financially supported by Kansai University Outlay Support for Establishing Research Centers, 2018, “Study on auditory mechanism of human hearing systems.”
References
- Ghaffari R, Aranyos AJ, Richardson GP, Freeman DM. Tectorial membrane travelling waves underlie abnormal hearing in Tectb mutant mice. Nat Commun 2010; 1: 96.
- Ussell IJ, Legan PK, Lukashkina VA, Lukashkin AN, Goodyear RJ, Richardson GP. Sharpened cochlear tuning in a mouse with a genetically modified tectorial membrane. Nat Neurosci 2007; 10: 215-223.
- Gummer AW, Hemmert W, Zenner HP. Resonant tectorial membrane motion in the inner ear: Its crucial role in frequency tuning. Proc Natl Acad Sci USA 1996; 93: 8727- 8732.
- Chadwick RS, Dimitriadis EK, Iwasa KH. Active control of waves in a cochlear model with subpartitions. Proc Natl Acad Sci USA 1996; 93: 2564-2569.
- Meaud J, Grosh K. The effect of tectorial membrane and basilar membrane longitudinal coupling in cochlear mechanics. J Acoust Soc Am 2010; 127: 1411-1421.
- Sellon JB, Ghaffari R, Freeman DM. Geometric requirements for tectorial membrane traveling waves in the presence of cochlear loads. Biophys J 2017; 112: 1059-1062.
- Allen JB. Cochlear micromechanics: A physical model of transduction. J Acoust Soc Am 1980; 68: 1660-1670.
- Zwislocki JJ. Analysis of cochlea mechanics. Hear Res 1986; 22: 155-169.
- Ghaffari R, Aranyosi AJ, Freeman DM. Longitudinally propagating traveling waves of the mammalian tectorial membrane. Proc Natl Acad Sci USA 2007; 104: 16510-16515.
- Mammano F, Nobili R. Biophysics of the cochlea: Linear approximation. J Acoust Soc Am 1993; 93: 3320-3332.
- Cai H, Shoelson B, Chadwick RS. Evidence of tectorial membrane radial motion in a propagating mode of a complex cochlear model. Proc Natl Acad Sci USA 2004; 101: 6243-6248.
- Kitamura T. Investigation of coupling efficiensy of slow-wave propagation mode along cochlea. Phys Wave Phenom 2019; 27: 242-245.
- Hayashi H, Schrott-Fischer A, Glueckert R, Liu W, Salvenmoser Santi WP, Rask-Anderson H. Molecular organization and fine structure of the human tectorial membrane: is it replenished? Cell Tissue Res 2015; 362: 513-527.
- Gan RZ, Reeves BP, Wang X. Modeling of sound transmission from ear canal to cochlea. Ann Biomed Eng 2007; 35: 2180-2195.
- Andoh M, Wada H. Prediction of the characteristics of two types of pressure waves in the cochlea: Theoretical considerations. J Acoust Soc Am 2004; 116: 417-425.
- Gavara N, Chadwick RS. Noncontact microrheology at acoustic frequencies using frequency-modulated atomic force microscopy. Nat Methods 2010; 7: 650-654.
- Koike T, Sakamoto C, Sakashita T, Hayashi K, Kanzaki S, Ogawa K. Effects of a perilymphatic fistula on the passive vibration response of the basilar membrane. Hear Res 2012; 283: 117-125.
- De Paolis A, Bikson M, Nelson JT, Alexander de Ru J, Packer M, Cardoso L. Analytical and numerical modeling of the hearing system: advances towards the assessment of hearing damage. Hear Res 2017; 349: 111-128.
- Greenwood DD. A cochlear frequency-position functions for several species: 29 years later. J Acoust Soc Am 1990; 87: 2592-2605.