ISSN: 0970-938X (Print) | 0976-1683 (Electronic)
Biomedical Research
An International Journal of Medical Sciences
Commentary - Biomedical Research (2017) Volume 28, Issue 5
Integrated Cox model for survival analysis and biomarker discovery with a feature ranking technique based on z-score transformation in non-small cell lung cancer patients
1Department of Information and Communication Engineering, Anna University, Chennai, India
2Department of Computer Science and Engineering, Bannari Amman Institute of Technology, Sathyamangalam, India
- *Corresponding Author:
- Anidha M
Department of Information and Communication Engineering
Anna University
Chennai, India
Accepted on January 18, 2016
Purpose: The Purpose of this study was to identify signature biomarker miRNAs that are highly correlated with survival time and other clinical phenotypes. We have done the survival analysis with Cox proportional hazards model and presented a novel technique to identify signature biomarkers.
Materials and Methods: The Data Set from Yu et al. consists of microarray miRNA expression profiles of 112 Non-Small Cell Lung Cell (NSCLC) patients. There are 55 Adenocarcinoma, 50 Squamous cell carcinoma and 7 large cell carcinoma patients. Among them 24 are females and 88 are males, 38 dead and 74 alive. Also it has Stage-I-47, Stage-II-28 and Stage-III-37 patients.
Results: This leads to the efficient calculation of risk score and the patients who are designated as high risk patients. It deals with a novel biomarker selection/ranking technique zsTrans, through which the highly discriminant biomarkers are identified for various histological subtypes such as adenocarcinoma, and stages such as Stage-I, Stage-II and Stage-III of Non-Small Cell Lung Cancer (NSCLC) patients.
Conclusion: The identified Biomarker miRNAs play vital role in the diagnosis and prognosis of NSCLC patients.
Keywords
Survival analysis, Cox proportional hazard model, miRNA, NSCLC, Biomarkers.
Introduction
Non-Small-Cell Lung Cancer (NSCLC) causes more deaths than any other type of cancer worldwide. The recurrence rate among patients with early-stage NSCLC is about 40% within 5 years even after receiving combined surgical and chemotherapies [1]. The current tumour progression classification system is not an adequate measurement for treatment prognosis [1]. MicroRNAs are a new class of small non-protein-coding RNAs that function in endogenous negative gene-regulation and tumorigenesis. This effort may have clinical implication in the molecular-pathogenesis of cancer, development of new targeted-therapy or selection of high-risk cancer patients for adjuvant chemotherapy [1]. In spite of the difficulty in class prediction, there is an explosion of interest in biomarker research with the goal of incorporating biomarkers into drug development and leading to personalized medicine [2]. The potential utility of biomarkers is used for patient selection. By selecting patients based on their biomarker profiles, there is a hope to enrich the pool of patients who have a greater probability of response to alternative treatment plans. If successful, this approach could lead to cheaper and faster clinical trials than the conventional ones [2]. Researchers were able to identify sets of genes whose expressions are highly related to drug response of a set of compounds, which will eventually help development of new drugs. Correlating gene expression profiles obtained from tumor samples prior to treatment with the time to cancer relapse or death due to cancer can be very important in clinical practice [3]. The supervised approach is used to analyse the microarray data to identify biomarker miRNAs whose expression values are highly correlated with clinical or survival data which in turn used to predict the survival period of the patients. Li et al. stated that they have used kernel cox model and negative partial likelihood as a loss function [3]. This method generalized the idea of support vector machines for binary or multi-categorical data to censored survival data. The model automatically searched for the genes whose expression levels are related to survival phenotypes and identifies the optimal combination of the gene expression data in predicting the risk of cancer recurrence or death [3]. Lossos et al. estimated the survival curve using Kaplan-Meier method and compared them using log-rank test [4]. Univariate cox model was constructed to identify biomarkers whose z-values greater than 1.5 or less than -1.5 are analysed. They have selected a group of 36 genes in this study [4]. Zhang et al. designed simulation techniques of microarray data with biological diversity related to treatment response or survival [2]. They developed Umpire R Package to simulate the connections between gene expression and either binary or time-to-event outcomes. Latent variables, also called hidden variables, are usually inferred from other variables rather than being observed directly. For example, the latent variables in our simulation can be cancer subtypes that correspond to different survival rates, or biomarker expression levels that are linked with different treatment effects [2]. Kim et al. revealed that Receiver Operating Characteristic (ROC) curve analyses were carried out to estimate discriminatory power of the prognostic gene expression signatures and clinical variables [5]. They calculated the Area Under the Curve (AUC), which ranges from 0.5 (for a non-informative predictive marker) to 1 (for a perfect predictive marker) and a bootstrap method (1000 re-sampling) was used to calculate the 95% confident internal (CI) for AUC [5]. Haleh represented the Z-score normalization and Combat techniques to identify and merge highly correlated genes (correlation rate>0.8) and survival analysis is performed within the selected set of genes [6].
Materials and Methods
Data set
The Data Set from Sung-Liang Yu et al., [7] consists of microarray miRNA expression profiles of 112 NSCLC patients. There are 55 Adenocarcinoma, 50 Squamous cell carcinoma and 7 large cell carcinoma patients. Among them 24 are females and 88 are males, 38 dead and 74 alive. Also it has Stage-I-47, Stage-II-28 and Stage-III-37 patients (Table 1).
| Gender | Stage | Survival status | Histological type | ||||||
|---|---|---|---|---|---|---|---|---|---|
| Male | Female | I | II | III | Dead | Alive | AD | SQ | L |
| 88 | 24 | 47 | 28 | 37 | 38 | 74 | 55 | 50 | 7 |
Table 1. Description of data set.
Survival analysis
Survival analysis is a statistical method of modelling time to event (survival) data to analyse clinical outcome of patients. The event may be death, disease progression or recurrence of a tumor. It deals with the following
1. Rate of Survival at time period t.
2. The rate of failure or death at time t.
3. Effect of survival probability when there are changes in characteristics/circumstances.
Censoring, survival function and hazard are the common terms used in survival analysis. If a subject does not experience the event or outcome that is mentioned in the survival analysis within the study period is known as censoring. Right sensoring refers to the end of the observation period of the subject before the event occurs. The event doesn’t occur beyond the study period; while left censoring refers to the event occurs before study period ends. Survival function or survival probability maps the event which is mentioned in the survival analysis with time and it captures the probability of the survival of the subject beyond the specified time period.
Let T be a continuous random variable with Cumulative Distribution Function (CDF) F (t) then
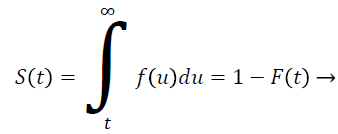 (1)
(1)
The Hazard which is known as instantaneous failure rate, denoted by h (t) or λ (t) is the probability of the event occurs at time t for an individual. In contrast to the survivor function, which focuses on not having an event, the hazard function focuses on the event occurring. It provides insight into the conditional failure rates and provides a vehicle for specifying a survival model. In summary, the hazard relates to the instantaneous (current) event rate, while survival reflects the cumulative non-occurrence [8].
H (t)=f (t)/(S (t)) → (2)
Where f (t) failure density functions or time to failure distribution.
Techniques of analysing survival data
These are the methods of estimating survival function and hazard function
Non-parametric methods:
1. Kaplan-Meier
2. Life table
3. Nelson-Aalen or Fleming-Harrington (via estimating the cumulative hazard)
Semi-parametric method-Cox proportional hazards model
Parametric method Accelerated Failure Time (AFT) model
Kaplan-Meier (K-M): Survival probability is estimated nonparametrically from survival data which works with conditional and cumulative probabilities. The probabilities of surviving from one interval to the next is multiplied together to give the cumulative survival probability.
Conditional probability pi=ri-di/ri → (3)
Where ri is the number of alive persons at time ti and di is the number of failures (dead) persons at the same time interval.
Survival at any time t is calculated as a cumulative probability by multiplying the conditional probabilities of surviving each previous time interval.
S (t)=ΠI ≤ t (1-di/ri) → (4)
Life table: If there are no records available about the exact time of the events occur then the time intervals are taken into account with the basic assumption of uniformly distributed censorings. The average number of subjects at risk at time interval t is calculated as
nj'=nj'-Cj/2 → (5)
nj’ is the number of subjects alive at time interval j and cj is number of censored observations. The survival probability is calculated as
S (t)=Πj ≤ t (1-dj/nj't) → (6)
Nelson-Aalen estimator: This method is non-parametric hazard rate estimator when the data is censored or incomplete. The hazard rate is estimated as follows;
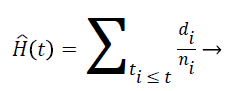 (7)
(7)
di is the number of events at time t and ni is the number of individuals (subjects) at the same time period.
Semi-parametric: Cox proportional hazards model: The K-M estimator is used for univariate analysis for time-to-event outcome measure of survival analysis whereas the Cox model is used for multivariate survival analysis. The general Cox model is known as
H (t)=h0 (t) ×e(b1 x1+b2 x2++bp xp) → (8)
The hazard function has two terms. h0 (t) is known as baseline hazard which depends on time not covariates. Exp (bTx) depends on covariates not time. If we are interested in the effects of covariates then there is no need to include the term baseline hazard h0 (t). The Cox model is thus known as semiparametric method.
The hazard ratio for two observations is described as follows,
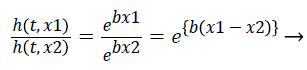 (9)
(9)
Hazards are proportional to each other. The hazard for the observation with covariate x1 is exp {b (x1-x2)} times that of hazard ratio of observation with covariate x2. The term exp {b (x1-x2)} is hazard ratio comparing covariate x1 to covariate x2. The hazard ratio greater than 1 indicates that if the value of covariate of ith observation increases, the event hazard increases and thus the rate of survival of that particular observation decreases. A hazard ratio above 1 indicates a covariate that is positively associated with the event probability, and thus negatively associated with the length of survival [9]. This is known as Assumption of proportionality related to Cox model.
Survival analysis using supervised principle components
The technique behind the SPC is rather than performing principle component analysis with the entire set of features, it is performed with the set of features which has strong correlation with survival outcome. First principle component is computed using this strongly correlated feature set [10].
Algorithm for computing supervised principle components:
1. Univariate regression coefficients are computed for each feature.
2. Data matrix is reduced with features whose regression coefficients are greater than a threshold.
3. Compute the first principle components for this reduced data matrix.
4. Use these principle components in the regression model to predict the outcome.
Comparison of Survival Analysis Techniques is shown in Table 2.
| Non-parametric | Semi-parametric | Parametric | ||
|---|---|---|---|---|
| K-M estimator | Life table | Nelson-Aalen | Cox Model | AFT Model |
| Univariate analysis | Univariate | Univariate | Multivariate | Multivariate |
| Maximum Likelihood estimator | MLE | MLE | Partial likelihood estimator | PLE |
Table 2. Comparison of survival analysis techniques.
Experimental Design
We propose integrated Cox model to perform the risk analysis to compute the risk scores of the samples. Based on the risk scores the samples are classified into high risk group and low risk group. Further analysis of identifying dominating biomarkers in each stage and histological subgroups are carried out with high risk group samples.
Conditional hazard vector V is defined as follows,
V=b1, b2,…, bn → (10)
where bi is the coefficients of features of univariate general cox model whose hazard rates are ≥ 1 and n is number of features which satisfy the above criteria.
T=t1, t2, …, tn → (11)
where t1, t2,..tn are the coefficients of covariates from the univariate general cox model.
Then we perform the Integrated Cox model with the following
h (t)=h0 (t)e{bX+T} → (12)
where X=xi1, xi2, .., xin; expression values of features whose univariate cox coefficients are ≥1.
We can rewrite the Equation 12 in terms of risk score function as
h (t)=h0 (t)e{f(X)} → (13)
The risk score function is written as
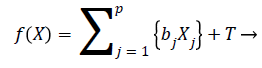 (14)
(14)
zsTrans feature ranking technique
We propose a novel feature ranking technique as a biomarker identification method to identify differentially co-expressed, dominating features related to each Stage of the NSCLC such as Stage-I, II, III and different histological subgroups such as adenocarcinoma, squamous cell carcinoma and large cell carcinoma.
General Cox model for multivariate analysis with interaction is,
H (t)=h0 (t)e{btXt} → (15)
Where Xt={x1, x2, x12} and bt={b1, b2, b12}
From Equation 15 we get z-score values of all the features and it is defined as
Z=zji → (16)
where i=1,.., n; n=number of features and j=1,.., p; p=number of samples. Then we do z-Score normalization of expression values for all the features of samples which satisfy the ranking criteria which is denoted as p1 and the feature ranking vector V is defined as
V=v1, v2,…, vp1 → (17)
Where vi is defined as
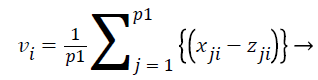 (18)
(18)
All the features are ranked according to their vi values. We used this technique to identify top ranked features as a dominating biomarkers for each histological subgroups and Stage-I, II and III for high risk samples which are selected from the entire dataset using the risk score.
Results and Discussions
Univariate Cox analysis was performed on the 157 miRNAs to identify features associated with survival in the training set of 70 samples. There are 6 miRNAs identified which are strongly correlated with patient’s survival. P-values which are ≤ 0.05 for Death as a result of univariate Cox regression analysis are used to identify the signature miRNAs. Table 3 shows the identified miRNAs and their HR, Coeff and p values.
| miRNA | Hazard ratio | Coeff-b value | P-value |
|---|---|---|---|
| miR137 | 1.164 | 0.15 | 0.011 |
| miR372 | 1.364 | 0.31 | 0.022 |
| miR182 | 1.323 | 0.27 | 0.037 |
| miR147 | 1.27 | 0.23 | 0.056 |
| miR221 | 0.874 | -0.13 | 0.01 |
| Let7a | 0.867 | -0.14 | 0.011 |
Table 3. Signature miRNAs.
We then performed the supervised principle components analysis and confirmed the selection of miRNA signature model for risk score analysis with the first principle components. Table 4 shows the feature scores of first principle components and Figure 1 shows the selection of threshold which fits the model with the outcome using the likelihood ratio statistics, Figure 2 shows the survival probability of high risk and low risk groups, Figure 3 shows the reduced set of features based on the feature scores computed using supervised principle components.
| miRNA | Feature score |
|---|---|
| miR 137 | 1.52 |
| miR 372 | 1.03 |
| miR 182 | 1.04 |
| miR 147 | 0.92 |
| miR 221 | -1.65 |
| Let 7a | -1.49 |
Table 4. First principle components.

Figure 1. Likelihood ratio statistic for selecting threshold to fit the model with the outcome.

Figure 2. Survival probability of high risk and low risk groups (Red line=Low risk group; Green line=High risk group).

Figure 3. Reduced set of features based on feature score.
The Figures 1-3 shown here are the results of the supervised principle component analysis.
We have performed the univariate cox analysis for other covariates such as gender, stage, histological subtype and the quantiles of age. The resultant coefficients are considered appropriately while computing risk score for each sample. Based on the risk scores estimated, the samples are partitioned into high risk groups and low risk groups using median value as a threshold. Figures 4 and 5 Show the Kaplan-Meier survival curves for the two risk groups in training set and test set.

Figure 4. K-M estimate of overall survival in the training set.

Figure 5. K-M estimate of overall survival in the test set.
We have analysed that the 6 miRNA signature model is significantly associated with the covariates using the multivariate cox proportional hazard analysis. We have found that Stage II and III are strongly associated with the risk and survival of the patients. Histological subtype adenocarcinoma is found to be more risky than the squamous cell carcinoma whose hazard ratio is 2.64 and p-value is 0.03. When the covariate gender is analysed, we get 1.18 as HR for female and 0.556 for male patients and age is less significant than the other covariates in the model (Figures 6-10 and Tables 5 and 6).
| Variable | Hazard ratio | P-value |
|---|---|---|
| Stage II | 2.42 | 0.08 |
| Stage III | 5.49 | 0.00095 |
| Age | 1.01 | 0.19 |
| Adenocarcinoma | 2.64 | 0.03 |
| Squamous cell carcinoma | 0.377 | 0.01 |
| Gender -Male | 0.556 | 0.03 |
| Gender-Female | 1.18 | 0.24 |
Table 5. Multivariate Cox analysis.
| Variable | Loglik | Chisq | P-value |
|---|---|---|---|
| Age | -144.99 | 3.28 | 0.06 |
| Stage | -132.72 | 24.53 | 0.00046 |
| Cell type | -146.64 | 7.39 | 0.02 |
| Gender | -132.06 | 1.32 | 0.25 |
Table 6. Results of ANOVA.

Figure 6. K-M estimate of overall survival of stage -I (n=29).

Figure 7. K-M estimate of overall survival of stage -II (n=19).

Figure 8. K-M estimate of overall survival of stage -III (n=22).

Figure 9. K-M estimate of overall survival of adenocarcinoma (n=33).

Figure 10. K-M estimate of overall survival of squamous cell carcinoma (n=31).
To test the statistical significance of the K-M curves for two or more groups, we have done log-rank test. The log-rank statistic makes use of observed vs. expected values over categories of outcome.
The log-rank statistic for Stage is 18.91 and the p-value is 0.00007825 which indicates that the null-hypothesis is rejected. This denotes that the risk and survival rate are not same with respect to the stages of the NSCLC patients (Table 7).
| Stages | Events observed | Events expected |
|---|---|---|
| Stage I | 8 | 18.5 |
| Stage II | 8 | 9 |
| Stage III | 22 | 10.5 |
| Total | 38 | 38 |
Table 7. Stages of NSCLC.
The log-rank statistic for Histological subtype is 4.69 and the p-value is 0.09572 which indicates that the null-hypothesis is rejected. This denotes that the risk and survival rate are slightly different with respect to the histological subtypes of the NSCLC patients (Table 8).
| Histological subtype | Events observed | Events expected |
|---|---|---|
| Adenocarcinoma | 23 | 16.83 |
| Squamous cell carcinoma | 12 | 18.58 |
| Large cell carcinoma | 3 | 2.58 |
| Total | 38 | 38 |
Table 8. Histological subtypes.
The log-rank statistic for gender is 0.2 and the p-value is 0.6511 which indicates that the null-hypothesis is not rejected. This denotes that the risk and survival rate are same with respect to the sex of the NSCLC patients (Table 9).
| Gender | Events observed | Events expected |
|---|---|---|
| Male | 30 | 31.07 |
| Female | 8 | 6.93 |
| Total | 38 | 38 |
Table 9. Gender.
Multivariate Cox analysis with interaction of covariates was performed and the z-scores are used for the ranking of the features in each stage and histological subtype of high risk group patients (Table 5). We have done z-score normalization of expression values based on Equation 18 and we obtained scores for all the features and the features are ranked accordingly.
The microRNA-200 (miR-200) family is a powerful regulator of the Epithelial-Mesenchymal Transition (EMT) process, which is essential in tumor metastasis [11]. The identification of miR-200 family includes miR-200a, miR-200b and miR-200c are functionally involved in canonical pathways of immune response, molecular mechanisms of cancer, metastasis signalling, cell-cell communication, proliferation and DNA repair in Ingenuity Pathway Analysis (IPA) [11]. These provide a potential basis for innovative therapeutic approaches for the treatment of this deadly disease. Low miR-100 expression was found to be closely correlated with higher clinical stage, advanced tumor classification and lymph node metastasis of patients. The overall survival of NSCLC patients with low miR-100 was significantly lower than that of those patients with high miR-100 [12]. The overexpression of miR-210 is highly associated with an improved disease specific survival and it is a candidate marker for prognostic stratification in NSCLC [13]. The high co-expression of miR-27a results in increased risk of cancer and poor prognosis for Non-Small Cell Lung Cancer (NSCLC) [14]. The miR-99a was downregulated in NSCLC tissues and suppressed tumor metastasis of NSCLC cells. Down-regulation of miR-99a is significantly associated with last-stage and tumor metastasis in NSCLC patients [15]. Platinum-based chemotherapies have long been used as a standard treatment in non-small cell lung cancer. However, cisplatin resistance is a major problem that restricts the use of cisplatin. Deregulated cell death mechanisms including apoptosis and autophagy could be responsible for the development of cisplatin resistance and miRNAs are the key regulators of these mechanisms. The miR-15a is an important key regulator which enhances the anticancer effects of cisplatin in the resistant non-small cell lung cancer cells [16]. MiR-195 suppresses tumor growth and is associated with better survival outcomes in Non-Small Cell Lung Cancer (NSCLC). It is showed that high miR-195 plasma levels associated with favourable overall survival of non-smoking women with lung adenocarcinoma [17]. The high miR-146 expression level longer progression-free survival (25.6 weeks in miR-146a high patients vs. 4.8 weeks in miR-146a low patients, P<0.05). miR-146a is therefore a strong candidate prognostic biomarker in NSCLC. Thus inducing miR-146a might be a therapeutic strategy for NSCLC [18]. miR-17-5p was downregulated in paclitaxel resistant lung cancer cells (A549-T24 and H596- TxR) and its overexpression promoting paclitaxel induced cytotoxicity and apoptosis [19]. The deregulation of miR-30b, miR-16, and miR-29c regulate cell growth, apoptosis, migration and invasion (Table 10).
| Adenocarcinoma | |||||||
|---|---|---|---|---|---|---|---|
| Up-regulated miRNAs | Down-regulated miRNAs | ||||||
| Feature name | Z-score value | HR | Feature score | Feature name | Z-score value | HR | Feature score |
| miR-200a | 0.313 | 1.04 | 0.016 | miR-99a | -1.66 | 0.684 | 1846.4 |
| miR-135b | 0.023 | 1 | 0.27 | miR-15a | -1.179 | 0.813 | 170.87 |
| miR-100 | 0.07 | 1.01 | 0.32 | miR-150 | -1.416 | 0.896 | 23.07 |
| miR-181a | 0.063 | 1 | 0.47 | miR-195 | -1.744 | 0.72 | 17.66 |
| miR-27a | -0.133 | 0.97 | 0.54 | Let.7a | -2.647 | 0.858 | 15.07 |
| miR-210 | 0.163 | 1.02 | 0.7 | miR-146 | -2.733 | 0.516 | 12.92 |
| miR-200c | 0.47 | 1.05 | 0.7 | miR-30d | -2.135 | 0.754 | 12.9 |
| Squamous cell carcinoma | |||||||
| Up-regulated miRNAs | Down-regulated miRNAs | ||||||
| miR-210 | 0.085 | 1.015 | 0.21 | miR-17-5p | -0.758 | 0.899 | 12.37 |
| miR-199a | -0.096 | 0.958 | 0.76 | miR-21 | -1.43 | 0.755 | 9.8 |
| miR-135b | -0.237 | 0.96 | 1.14 | miR-26a | -1.818 | 0.745 | 8.6 |
| miR-27a | -0.273 | 0.944 | 1.48 | miR-30b | -1.703 | 0.776 | 7.9 |
| miR-223 | -0.154 | 0.972 | 1.81 | miR-16 | -1.636 | 0.805 | 7.6 |
| miR-141 | -0.126 | 0.976 | 1.96 | miR-29c | -1.391 | 0.773 | 7.4 |
| miR-200c | -0.481 | 0.885 | 2.04 | miR-199a* | -1.195 | 0.809 | 6.73 |
Table 10. Biomarker miRNAs identified related to histological subtype using the ranking technique.
The miR-142-5p is identified as a potential biomarker for diagnosis and treatment of squamous lung cancer. In NSCLC the miR-155 is identified as an oncogene and is associated with poor prognosis and the miR-335 is strongly associated with small cell lung cancer metastases [20]. It is demonstrated that the overexpression of miR-221 is correlated with proliferation rate and cell cycle phase distribution in Lung cancer and other cancers such as breast cancer. The overexpression of miR-301 is highly associated with poorly differentiated lymph node metastasis and advanced tumor node metastasis and it is unfavourable prognostic factor for disease-free survival [21]. The aberrant expression of hsa-miR27a results in increased risk of cancer and poor prognosis of NSCLC and it is proved that miR-27a could suppress RKIP expression and in turn contribute to chemoresistance of lung adenocarcinoma cells to cisplatin [22,23]. The miR-197 is a novel biomarker related to chemoresistance and survival of NSCLC. The miR-197/ CKS1B/STAT3 axis has the ability to promote cancer progression in chemoresistant NSCLC. It is suggested that miR-197 replacement therapy may be an effective treatment for lung cancer patients with chemoresistance, particularly in PDL1- positive patients [23]. The administration of antisense of miR-183 significantly increased FoxO1 levels in NSCLC resulting in a significant decrease in NSCLC growth (Table 11). It is demonstrated that miR-183/FoxO1 axis may be a novel therapeutic target for regulating the growth of NSCLC [24].
| Stage I | |||||||
|---|---|---|---|---|---|---|---|
| Up-regulated miRNAs | Down-regulated miRNAs | ||||||
| Feature name | Z-score value | HR | Feature score | Feature name | Z-score value | HR | Feature score |
| miR-130a | 0.368 | 1.116 | 0.52 | miR-371 | -0.12 | 0.979 | 455.04 |
| miR-15b | 0.444 | 1.204 | 0.62 | miR-323 | -0.08 | 0.988 | 450.35 |
| miR-218 | -1.309 | 0.697 | 1.3 | miR-325 | -0.146 | 0.975 | 372.72 |
| miR-20 | 0.837 | 1.363 | 1.5 | miR-183 | -0.106 | 0.985 | 348.63 |
| miR-27a | 0.372 | 1.107 | 4.53 | miR-134 | -0.099 | 0.981 | 289.24 |
| miR-182 | -0.733 | 0.876 | 4.7 | miR-302a | -0.222 | 0.962 | 242.46 |
| Stage II | |||||||
| Up-regulated miRNAs | Down-regulated miRNAs | ||||||
| miR-222 | -2.01 | 0.47 | 0.02 | miR-104 | -0.023 | 0.998 | 420.13 |
| miR-221 | -2.396 | 0.792 | 0.03 | miR-193-a* | -0.1518 | 0.976 | 267.86 |
| miR-342 | 0.419 | 1.208 | 0.03 | miR-299 | -0.0912 | 0.981 | 148.42 |
| miR-98 | -2.975 | 0.65 | 0.08 | miR-371 | -0.3161 | 0.95 | 139.32 |
| miR-199-s | 1.154 | 1.629 | 0.11 | miR-183 | -0.547 | 0.917 | 137.73 |
| miR-218 | -2.153 | 0.57 | 0.26 | miR-325 | -0.315 | 0.96 | 132.24 |
| Stage III | |||||||
| Up-regulated miRNAs | Down-regulated miRNAs | ||||||
| miR-142-5p | -2.062 | 0.774 | 0.009 | miR-125b | -0.072 | 0.996 | 1146.22 |
| miR-155 | -2.602 | 0.526 | 0.01 | miR-368 | -0.168 | 0.974 | 752.97 |
| miR-335 | -2.662 | 0.617 | 0.02 | miR-104 | -0.473 | 0.929 | 328.62 |
| miR-132 | -1.826 | 0.712 | 0.17 | miR-371 | -0.659 | 0.902 | 244.26 |
| miR-339 | -1.794 | 0.741 | 0.33 | miR-325 | -0.688 | 0.898 | 233.61 |
| miR-301 | -2.008 | 0.751 | 0.83 | miR-302a | -0.762 | 0.886 | 207.99 |
| miR-197 | -1.806 | 0.835 | 1.19 | miR-302c* | -0.852 | 0.877 | 184.68 |
Table 11. Biomarker miRNAs identified related to stage using the ranking technique.
Conclusion
Lung cancer is the remarkable cause of the cancer related deaths and approximately 70% of the newly diagnosed patients are in advanced or metastatic state. The miRNAs play critical role in cell growth, proliferation, differentiation and development of various solid and haematological malignancies. Recently, miRNAs have emerged in NSCLC as both diagnostic and prognostic biomarkers. The integrated Cox model suggested here is proved as a novel technique which differentiates High risk and low risk patients using the effective computation of risk scores. A novel feature ranking technique based on z-score transformation is used to rank and identify novel biomarkers in different stages and histological subtypes of high risk NSCLC patients.
Funding
This research received no specific grant from any funding agency in the public, commercial or not-for-profit sectors.
Conflicts of Interest
The authors state that there are no conflicts of interest regarding the publication of this article.
References
- Hsuan YC, Sung LY, Chun HC, Gee CC, Chih YC, Ang Y, Chiou LC, Chien HW, Harn JT, Shu FK, Wing KC, Han NL, Chun CL, Sher S, Wei JC, Jeremy JWC, Pan-CY. A 5-gene signature and clinical outcome of non-small cell lung cancer. N Engl J Med 2007; 356: 11-20.
- Jiexin Z, Paul LR, Kevin R. Coombes, simulating gene expression data to estimate sample size for class and biomarker discovery. Int J Adv Life Sci 2012; 4: 44-51.
- Li H, Luan Y. Kernel Cox regression models for linking gene expression profiles to censored survival data. Pac Symp Biocomput 2003; .
- Lossos IS, Czerwinski DK, Alizadeh AA, Wechser MA, Tibshirani R. Prediction of survival in diffuse large-B-cell lymphoma based on the expression of six genes. N Engl J Med 2004; 350: 1828-1837.
- Soo MK, Sun HL, In SC, Yun YP, Sang CK, Sang BK, Eun SP, Jae YL, Jeonghoon H, Yoon JK, Dae GK, Ahmed K, Young NP, Xin WW, Snorri ST, Ju SL. 65-gene-based risk score classifier predicts overall survival in hepatocellular carcinoma. Hepatol 2012; 55: 1443-1452.
- Yasrebi H. Comparative study of joint analysis of microarray gene expression data in survival prediction and risk assessment of breast cancer patients. Brief Bioinform 2016; 17: 771-785.
- Sung LY, Hsuan YC, Gee CC, Chih YC, Huei WC, Sher S, Chiou LC, Chong JY, Yung CL, Han SC, Te JS, Ching CC, Han NL, Qi SH, Hsin YS, Chun CC, Wan JC, Chun CL, Wing KC, Wei JC, Ker CL, Jeremy JWC, Pan CY. MicroRNA signature predicts survival and relapse in lung cancer. Cancer Cell 2008; 13: 48-57.
- Clark TG, Bradburn MJ, Love SB, Altman DG. Survival analysis part I: basic concepts and first analyses. Br J Cancer 2003; 89: 232-238.
- Bradburn MJ, Clark TG, Love SB, Altman DG. Survival analysis part II: multivariate data analysis-an introduction to concepts and methods. Br J Cancer 2003; 89: 431-436.
- Eric B, Trevor H, Debashis P, Robert T. Prediction by supervised principal components. J Am Stat Assoc 2008; 473: 2006.
- Pacurari M, Addison JB, Bondalapati N, Wan YW, Luo D. The microRNA-200 family targets multiple non-small cell lung cancer prognostic markers in H1299 cells and BEAS-2B cells. Int J Oncol 2013; 43: 548-560.
- Liu J, Lu KH, Liu ZL, Sun M, De W. MicroRNA-100 is a potential molecular marker of non-small cell lung cancer and functions as a tumor suppressor by targeting polo-like kinase 1. BMC Cancer 2012; 12: 519.
- Wang J, Zhao J, Shi M, Ding Y, Sun H. Elevated expression of miR-210 predicts poor survival of cancer patients: a systematic review and meta-analysis. PLoS One 2014; 9: e89223.
- Ma JY, Yan HJ, Yang ZH, Gu W. Rs895819 within miR-27a might be involved in development of non-small cell lung cancer in the Chinese Han population. Asian Pac J Cancer Prev 2015; 16: 1939-1944.
- Yu SH, Zhang CL, Dong FS, Zhang YM. miR-99a suppresses the metastasis of human non-small cell lung cancer cells by targeting AKT1 signalling pathway. J Cell Biochem 2015; 116: 268-276.
- Bozok etintaay V, Tetik VA, Dazgan Z, Tezcanakaymaz B, Aaakgaz E. miR-15a enhances the anticancer effects of cisplatin in the resistant non-small cell lung cancer cells. Tumour Biol 2016; 37: 1739-1751.
- Liu B, Qu J, Xu F, Guo Y, Wang Y. MiR-195 suppresses non-small cell lung cancer by targeting CHEK1. Oncotarget 2015; 6: 9445-9456.
- Chen G, Umelo IA, Lv S, Teugels E, Fostier K. miR-146a inhibits cell growth, cell migration and induces apoptosis in non-small cell lung cancer cells. PLoS One 2013; 8: e60317.
- Chatterjee A, Chattopadhyay D, Chakrabarti G. miR-17-5p downregulation contributes to paclitaxel resistance of lung cancer cells through altering beclin1 expression. PLoS One 2014; 9: e95716.
- Gong M, Ma J, Guillemette R, Zhou M, Yang Y. miR-335 inhibits small cell lung cancer bone metastases via IGF-IR and RANKL pathways. Mol Cancer Res 2014; 12: 101-110.
- Shi YK, Zang QL, Li GX, Huang Y, Wang SZ. Increased expression of microRNA-301a in nonsmall-cell lung cancer and its clinical significance. J Cancer Res Ther 2016; 12: 693-698.
- Li J, Wang Y, Song Y, Fu Z, Yu W. miR-27a regulates cisplatin resistance and metastasis by targeting RKIP in human lung adenocarcinoma cells. Mol Cancer 2014; 13: 193.
- Yu F, Shigehiro Y, Keitaro H, Yusuke Y, Nobuyoshi K, Fumitaka T, Tomohiro F, Koji T, Hiroshi N, Tomohide T, Hisao A, Makoto K, Kazuyoshi K, Takahiro O. The clinical relevance of the miR-197/CKS1B/STAT3-mediated PD-L1 network in chemoresistant non-small-cell lung cancer. Mol Therap 2015; 23: 717-727.
- Zhang L, Quan H, Wang S, Li X, Che X. MiR-183 promotes growth of non-small cell lung cancer cells through FoxO1 inhibition. Tumour Biol 2015; 36: 8121-8126.