ISSN: 0970-938X (Print) | 0976-1683 (Electronic)
Biomedical Research
An International Journal of Medical Sciences
Research Article - Biomedical Research (2016) Computational Life Sciences and Smarter Technological Advancement
GABC based neuro-fuzzy classifier with multi kernel segmentation for satellite image classification
Segmentation combined with classification of satellite images is an important problem that could not be execute on the basis of pixel by pixel manner. Nowadays, several satellite image segmentation and classification methods are available. To overcome the difficulties in the existing techniques, a novel satellite image classification system using Multi Kernel Fuzzy C-Means Clustering (MKFCM) with optimal neuro-fuzzy classifier is proposed. The proposed work consists of three stages such as (i) satellite image segmentation (ii) feature vector generation and (iii) image classification. The input image is preprocessed, to make it suitable for segmentation. The image is segmented using Multi Kernel Fuzzy CMeans Clustering (MKFCM). Later the feature vector is created for further classification. The neurofuzzy classifier classifies the image into road, building and vegetation region. Here, the optimal rules are generated using hybridization of Genetic and Artificial Bee Colony (GABC) algorithm. Accuracy of the proposed method is better when compared with the existing method.
Keywords
Satellite image, Segmentation, Classification, Multi kernel fuzzy c-means clustering (MKFCM), Neuro fuzzy, Genetic and artificial bee colony (GABC), Feature vector.
Introduction
Satellite images play a vital role in providing information about geographical environment [1]. Satellite images provide quantitative and qualitative information, which can reduce the complexity that is required in performing field work [2]. A remote sensing technology collects data about the images in regular intervals. Data retrieved from data centres are voluminous and it grows exponentially as the technology is developing at rapid speed [3]. The satellite images are employed in formation of mapping few products for military, civil applications and many other applications, which has more societal value [4]. It is also used for mapping and categorization of land cover traits such as soil, water, vegetation and forests [5]. Nowadays, investigation are done in computer vision techniques executed on remote sensing images like object oriented, fragmentation, and knowledge-based methods for categorization of high-resolution imagery [6].
During the past decade a considerable research has been done for automatic building identification from satellite images. On tracking buildings from the satellite images, spatial resolution could be given more importance than spectral resolution [7]. In India, the building doesn’t follow a standard pattern thereby building extraction becomes a tedious process and also an individual building occupies a small area on the ground. The resemblance of roads, buildings and tracks are look at most relevant in satellite pictures which makes digital classification tedious. In such an environment, differentiation between buildings and road becomes very difficult. Because of this reason, some added features namely area, shape, color and texture etc. are also required for increasing the accuracy of extracted buildings from satellite images [8,9].
A lot of work has been done on building extraction from high resolution satellite images. IKONOS imagery depicts fine details about the urban areas and facilitates the extraction of buildings [10-12]. Multispectral remote sensed images contain information that is collected over varying frequencies, which also varies over diverse regions [13-15]. Compared to the conventional non-contextual information-based methods [16], deployment of the spectral as well as spatial information improves the classification performance. Generally, a classification technique develops a classification map of the identified features and classes of land cover types in a given image [17,18]. Various methods has been devised for the research that take advantage of neighbouring pixel information [19,20] and which is in turn applied for the classification.
Related Work
There exists various researches for classification of satellite images and has been a major field of research due to its significant applications in the society. A brief review of few techniques are studied and analysed in the literature for classifying the satellite images. Liang et al. [21] have presented a segmentation method of high resolution remote sensing image. A methodology for Multi-Feature Object-Oriented Markov Random Field (MFOMRF) was proposed to obtain segmentation of high resolution satellite image in a precise manner. The proposed method employs two blocks: (1) Meanshift algorithm was employed to obtain the over-segmentation results and the primary processing units are generated by which the Object Adjacent Graph (OAG) was constructed. (2) The spectral, textural, and shape feature are extracted for each node in the Object Adjacent Graph. The proposed segmentation method was evaluated on Geo Eye dataset, and the experimental results obtained from MFOMRF had functions to provide better segmentation results, especially for images that contain textural and shape information.
Gaetano et al. [22] have dealt with high resolution satellite images presenting morphological road segmentation in urban regions. They have developed a new method for road segmentation. The proposed method was based on an ad-hoc skeletonization procedure that enhances and extracts road objects by first detecting their skeletons and then it’s been associated with different regions of image. Moreover, Susheela Dahiya et al. [23] have explained the building extraction from high resolution satellite images. Here, the image was segmented by using the split and merge segmentation. Then the segmented image was filtered by applying different filters. As a result of filtration a vector image is obtained.
Additionally, Zhiqiang et al. [24] have explained the localityconstraint discriminant feature learning for high-resolution Synthetic Aperture Radar (SAR) image classification. In the first stage, a weighted discriminant filter was studied from the labelled SAR image patterns that generate a range of low-level features. In this work, the super pixels were employed as the basic operational units instead of the pixels for terrain classification. With some learned domain patterns from the high-level features of each pixel, the super pixel was characterized by a hyper-feature. In the last stage, a linearkernel support vector machine was utilized to classify all of these hyper-features which were generated for each super pixel.
Liujuan et al. [25] have developed the detecting vehicles on satellite images that richly depict highways. Their key idea was to introduce a novel method for learning that transfers vehicle detectors trained in the aerial image space to the satellite image space. More specifically, the transfer learning method was based on a supervised algorithm, which learns correlative sparse coefficients between low and high resolution image patterns. A linear Support Vector Machines (SVM) based detector was trained, in which the loss function was integrated into the sparse coding operation.
Proposed Methodology
The basic idea of proposed methodology is satellite image segmentation and classification based on neuro-fuzzy classifier. The proposed system mainly consists of three stages such as (i) MKFCM based image segmentation (ii) feature vector generation and (iii) classification using GABC based neuro-fuzzy classifier. The images are pre-processed. Later, perform the segmentation process based on multi kernel fuzzy c-means clustering algorithm. Then, generate the histogram based feature vector. Finally, classify the image based on the neuro-fuzzy classifier. In this, the optimal rules are generated using hybridization of Genetic and Artificial Bee Colony Algorithm (GABC). The overall process of proposed methodology is illustrated in Figure 1.

Figure 1: Overall diagram of the proposed satellite image classification.
MKFCM based image segmentation
Consider the satellite image I, which has some of the noises, hence unable to directly given to the segmentation stage. After the pre-processing, segment the satellite image into dissimilar regions such as road, vegetation and building with the help of Multi Kernel Fuzzy C-Means Clustering (MKFC) algorithm. The proposed segmentation process is done by following steps:
Step 1: Color space initialization
After pre-processing step, the satellite images are converted into six color spaces such as RGB, HSV, YIQ, XYZ, LAB and LUV and each colour space is included three colors. Subsequently, the histogram is determined for all the given color spaces. To regulate the histogram, we detect neighbourhood pixel of each pixel.
Step 2: Initial clustering
Subsequently, the six color spaces depending on pixels are gathered together into dissimilar clusters such as road, vegetation and building using multi kernel fuzzy c-means clustering. Moreover, these three clusters are basis of six color spaces namely the RGB, HSV, YIQ, XYZ, LAB, and LUV. From the clusters, we detect the centroid value on the basis of six color spaces. The MKFCM minimizes the following objective function shown as Equation 1.
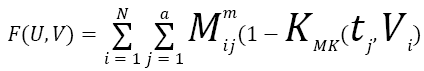 →(1)
→(1)
Where,
Uij ? Membership of jth data in the ith cluster Ai
V ? Cluster centre
KMK ? Multi- kernel function
In multiple kernel fuzzy c means, tj represents the kernel function KMK (x, y). Here we are considering multiple kernels for our proposed work is linear and quadratic kernels. So KMK (x, y) =K1 (x, y) +K2 (x, y) is a kernel shown as Equation 2, K1 and K2 are given in Equations 3 and 4 [26].
KMK (x, y) =K1 (x, y) +K2 (x, y)→(2)
K1 (x, y) =xTy+c→(3)
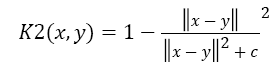 →(4)
→(4)
Where, c is the constant value. Now the cluster centre calculation is done by Equation 5,
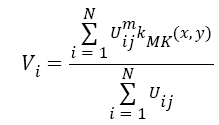 →(5)
→(5)
Membership updation is done by Equation 6,
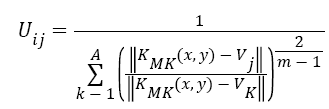 →(6)
→(6)
|| U ( K+1 ) – U ( K )|| < e then stop,
Based on the MKFCM the images are clustered. After the MKFCM process, we obtain the number of cluster set such as C1, C2, C3. This clustered dataset is used for the further processing.
Step 3: Histogram based new data formation:
In this stage, we have generated new data which is based on the histogram based six color spaces namely, RGB, HSV, YIQ, XYZ, LAB and LUV.
Step 4: Final clustering using MKFCM
The 125-bin descriptors are assembled together into dissimilar clusters like road, building and vegetation by the MKFCM algorithm. The segmentation process of the input image into K1 classes is continued for different color spaces which can be viewed as different image (the channels are represented by the different color spaces). In our approach, we use Ns segmentations provided by the Ns=6 color spaces, namely the RGB, HSV, YIQ, XYZ, LAB, and LUV. The six color spaces are given into the input to MKFCM. The 125-bin descriptors are grouped into different clusters (corresponding to each class of the image) by the MKFCM algorithm. Subsequently, we find out the centroid value of every cluster in the multi kernel fuzzy c-means algorithm from Equation 1.
Feature vector formation
Basically, the pixel wise feature vector based classification is taken too much time in classification process. Therefore, to solve this problem we use statistical measures such as mean and variance and histogram based maximum intensity for the classification process.
Satellite image classification using neuro-fuzzy classifier system
Once we extract the features from the image, the classification is done by neuro-fuzzy classifier. Based on hybridization of artificial neural networks and fuzzy logic the neuro-fuzzy classifier is proposed. A fuzzy logic method is a distinct method which competes to handle numerical data and linguistic information. The wealth of this logic is that there are much potential which lead to many dissimilar mappings [27]. In addition, the neural network is also one of the methods to classify the satellite image. By hybridized these two classifiers, we assume that classifier performance will be increased and while, which will be helped to improve the classification accuracy. By our assumptions, the result section shows that the proposed classifier of neuro-fuzzy classifier achieved better performance than the individual classifier. At first, a fuzzy system is designed based on the input features and optimal rule selection to compute fuzzy score. Then, neural network is trained using Levenberg-Marquardt Algorithm (LMA) and its target is assigned by concatenation of fuzzy score and neural network target. Finally, the beat classification is done using concatenation of two classifier output. The proposed classifier involves training the two classifiers like fuzzy logic and neural network to classify the three classes of the satellite image when histogram based features are used as input. The neuro-fuzzy classifier is trained with the Levenberg-Marquardt Algorithm (LMA).
Optimal rule generation using GABC algorithm
Genetic Algorithm (GA) and Artificial Bee Colony (ABC) is the one of the optimization algorithm used to generate the best solution in different applications [26,28]. From the above considerations, in this paper, we combine and used to generate optimal rule and we assume that, which helps to improve the classification accuracy. Therefore, we make the use of GAABC algorithm for rule generation process using the best solution. The database D is divided into sets namely, training dataset (DTR) and testing dataset (DTE). The training dataset is used to generate the fuzzy rules and the designing of fuzzy system. The classification accuracy of the proposed system is evaluated with the help of testing dataset. The detailed process of generating the rule generation using GA-ABC algorithm is explained using the following steps.
Discretization
The training dataset, DTR= {dij: 0 ≤ i ≤ m and 0 ≤ j ≤ n} containing ‘n’ number of features is given to the discretization function. Discretization process is explained below:
Step 1: Take the features column wise in the training dataset DTR. Each column consists of N number of images and each row consists of n features, 0< n ≤ 54.
Step 2: After the feature selection, we calculate the median (Med) of the each column j.
Step 3: After calculating the Mmed value, reduce the features of the images to the specific interval. Consequently, divide all the feature values in particular median value Mmed. For e.g. if the median value Mmed=120 and the one feature value FM(1)=60 means we obtain the feature value as 0.5 using the following Equation 7,
FM=Mmed/FM(1)→(7)
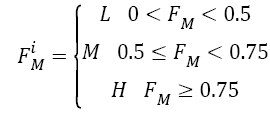
Using Equation 8 adjusts all the feature values in the specific interval from 0 to 1. Every value that ranges between the specified ranges is replaced with this interval value that transforms the input data to the discretized data. Consequently, the training dataset DTR is converted to the discretized format DD where, the entire data element DD contains only the L, M, and H.
 →(8)
→(8)
Where;
FiM→ith feature of the dataset
L-Low value of feature
M-medium value of feature
H-high value of feature
After discretization, the training dataset, DTR is converted to the discretized set DD where, all the data element DD (i, j) contain only the L, M or H for k=3.
Logical rule generation
Based on the discretized format DD, we generate the rule. The rule should have three different decisions such as N1 ….N3. Every row specifies the logical rule so that three logical rules are generated. The sample rules are given in a Table 1.
| Rules | FM(1) | FM(2) | FM(3) | FM(4) | …… | FM(54) | Decision |
|---|---|---|---|---|---|---|---|
| 1 | M | H | L | L | …… | L | N1 |
| 2 | L | M | H | M | …… | H | N2 |
| 3 | H | L | M | H | …… | M | N3 |
Table 1: Sample rules are fuzzy logic.
Based on the rule, rearrange the dataset DD into three groups, each group having the only one kind of cluster. The Table 2 shows the rearranged features of images according to the rule.
| Images | Images | |||||
|---|---|---|---|---|---|---|
| FM(1) | FM(2) | FM(3) | FM(4) | …… | FM(54) | |
| G1 | M | H | …. | L | L | M |
| . . . |
. . . |
. . . |
. . . |
. . . |
. . . |
|
| M | H | …. | L | L | M | |
| G2 | L | M | …. | H | M | H |
| . . . |
. . . |
. . . |
. . . |
. . . |
. . . |
|
| L | M | …. | H | M | H | |
| G3 | H | L | …. | M | M | L |
| . . . |
. . . |
. . . |
. . . |
. . . |
. . . |
|
| H | L | …. | M | M | L | |
Table 2: Rearranged data set features.
Solution representation
To optimize the rules, GABC algorithm initially creates an arbitrary population of solution. Here, n-number of solution or chromosomes S is generated to initialize our problem. According to this, five index values are selected for each group or class Gi. An index value represents a logical rule based on the Table 3. The dimension of the solution is M × N. M is the length of the solution and N number of solution or chromosomes. The solution encoding diagram is shown in Figure 2. The same rule cannot be repeated in the same solution.

Figure 2: Solution encoding.
| Length of the chromosome | Colony size | Qi | Cross over rate | Cycle |
|---|---|---|---|---|
| 30 | 10 | 0.5 | 0.1 | 50 |
Table 3: Hybrid algorithm parameter.
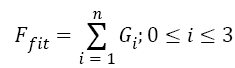
Fitness computation
After the initial solution is generated, the fitness is evaluated Using Equation 9. The fitness of the solution is calculated by performing the frequency count of the index value in the ith solution 0 < i < n. Here, each solution having Gi number of group, and each group having ηi number of index value described in Equation 10.
 →(9)
→(9)
Where;
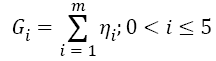 →(10)
→(10)
Where
Gi → ith
Gi → ith group of the solution
ηi → ith index value
Designing of Fuzzy System
When designing a fuzzy system, the definition of fuzzy membership function and fuzzy based rules are important to be considered.
Membership function
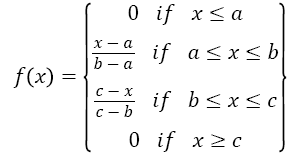
A Membership Function (MF) defines every point in the space is mapped to a membership value between 0 and 1. Here, the triangular membership function is chosen for converting the input into the fuzzified value. The triangular membership function consists of three vertices a, b and c of f (x) in a fuzzy set.
The formula to compute the membership values is given below in Equation 11,
 →(11)
→(11)
Figure 3 shows a triangular membership function used in a single fuzzy set. Figure 4 shows the plot considering all the three membership functions having overlapping values. Here, the curves for, low, medium and high are shown for one particular attribute. The membership function of the medium required three parameters and membership function of low and high are required two parameters.

Figure 3: Triangular membership function.

Figure 4: Triangular memberships function with defined parameters and their values.
Rule based fuzzy score computation
Using GA-ABC optimization algorithm, the fuzzy rule set is generated in Table 4. The rule based system contains fuzzy rule set which has, low high and medium features values. After the fuzzification process the fuzzy classifier generate the score value Fscore. Depends upon the score value the classification decision is taken out.
| NN1 | No.of iteration | Error | Training algorithm | No.of hidden layer | No.of neuron |
|---|---|---|---|---|---|
| 100 | 0.223 | Levenberg-Marquardt | 1 | 10 |
Table 4: Neural network parameters.
Artificial neural network
The Neural Network is one of the training algorithms used to classify the satellite image into particular group G based on the target value T. Here, two targets are assigned as original class target for each neural network target (NNT) and the corresponding Fuzzy Score (FS). The basic neural network contains three layers. These are input layer, tan-sigmoid hidden layer, and output layers. In the proposed methodology, we train the neural network using Levenberg-Marquardt algorithm. In order to work out non-linear least squares problems, Levenberg-Marquardt Algorithm (LMA), as well known as the Damped Least-Squares (DLS) method, is applied. These minimization problems occur particularly in least squares curve fitting. The Levenberg-Marquardt algorithm (LMA) method is fastest and powerful method for training the neural network.
Decision generation using neuro-fuzzy system
After fuzzy score is obtained for each class using fuzzy logic system, next the neural network is trained to neural network target NNT with fuzzy score Fs. i.e., neural network is trained using Levenberg-Marquardt Algorithm (LMA) and its target is assigned by concatenation of fuzzy score and neural network target. In testing stage, the beat classification is done using concatenation of two classifier output as mentioned in Equation 12. The training process of proposed neuro-fuzzy classifier is shown in Figure 5.

Figure 5: Proposed segmentation result.
DS=Concentration of [Fs and NNT] (12)
Where;
Fs score value obtained from fuzzy classifier
NT target assigned value from neural network
Result and Discussion
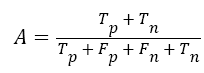
The performance of the proposed satellite image classification is utilized based on the accuracy measure. The accuracy can be computed using Equation 13,
 →(13)
→(13)
Where,
Tp → True positive
Tn → True negative
Fp → False positive
Fn → False negative
The main objective of proposed methodology is satellite image segmentation and classification using multi kernel fuzzy cmeans clustering with optimal neuro-fuzzy classifier. Mainly the proposed work mainly consists of two modules such as segmentation and classification. In segmentation stage, we used multi kernel fuzzy c-means clustering and classification stage we used optimal neuro-fuzzy classifier. The parameters of hybrid algorithm and neural network parameters are shows in Tables 3 and 4.
Comparative analyses
This section shows the results of comparison between several methods using enhanced satellite image classification. When comparing the result of different approaches the proposed result, performs better. The performance of satellite image classification is often measured in terms of accuracy.
The proposed methodology, classifies the satellite image into three classes such as road, building and tree. Figures 5-8 show the accuracy plot for road region by varying hidden neurons of the input image. Comparison of the proposed work is done with the existing methods such as KFCM+NN based satellite image classification and FCM+NN based classification. This has been tested on few more images. Table 5 shows the performance comparison of proposed approach based on overall accuracy. When analysing Table 5, the maximum average accuracy of 89% which is high compare to the existing approaches.

Figure 6: Accuracy plot for tree region.

Figure 7: Accuracy plot for building region.

Figure 8: Accuracy plot for road region.
| Images | Proposed NSKFCM+neuro-fuzzy | Existing kFCM+ANN | ||||
|---|---|---|---|---|---|---|
| Tree | Band | Road | het | Bad | Road | |
| Image 1 | 0.8049 | 0.81634 | 0.87322 | 0.7349 | 0.75634 | 0.80322 |
| Image 2 | 0.83093 | 0.8075 | 0.9564 | 0.74093 | 0.7875 | 0.8064 |
| Image 3 | 0.8041 | 0.81503 | 0.89685 | 0.7441 | 0.76503 | 0.81685 |
| Image 4 | 0.82166 | 0.82144 | 0.84049 | 0.79166 | 0.75144 | 0.78049 |
| Image 5 | 0.78866 | 0.79506 | 0.88772 | 0.75866 | 0.74506 | 0.80772 |
| Average | 0.81005 | 0.81107 | 0.89094 | 0.7504 | 0.761 | 0.8029 |
Table 5: Performance comparison of proposed approach based on overall accuracy.
Conclusion
In this paper, an efficient image categorization method for satellite images by means of MKFCM and GABC based neuro fuzzy classifier has been analysed. The satellite image classification frameworks introduced by this paper consist of two key components, mainly image segmentation and classification. The segmentation of the image based on MKFCM and classification by GABC based neuro fuzzy classifier. The experimental results indicate that the proposed classification framework have outperformed by having better accuracy of 89% when compared existing approach.
References
- Muhammad S, Aziz G, Aneela NM. Classification by object recognition in satellite images by using data mining. Proc World Cong Eng 2012.
- Chaichoke V, Supawee P, Tanasak V, Andrew KS. A Normalized Difference Vegetation Index (NDVI) time-series of idle agriculture lands: a preliminary study. Engineering J 2011; 15: 9-16.
- Zheng X, Sun X, Fu K, Hongqi W. Automatic annotation of satellite images viaMulti-feature joint sparse coding with spatial relation constraint. IEEE Geo-sci Remote SensLett 2013; 10: 652-656.
- James AS, Daniel BC. A comparison of classification methods for large imagery data sets. JSM Stat Technol Change Stat Comp 2002; 3205-3207.
- Govender M, Chetty K, Naiken V, Bulcock H. A comparison of satellite hyperspectral and multispectral remote sensing imagery for improved classification and mapping of vegetation. Water 2008; 34: 147-154.
- Argialas D, Harlow C. Computational image interpretation models: an overview and a perspective. Photogram Eng Remote Sens 1990; 56: 871-886.
- Myint SW, Gober P, Brazel A, Grossman-Clarke S, Weng Q. Per-pixel vs. object-based classification of urban land cover extraction using high spatial resolution imagery. Remote SensEnv 2011; 115: 1145-1161.
- Susheela D, Garg PK, Mahesh KJ. Building extraction from high resolution satellite images. International J Comp SciCommunTechnol 2013; 5: 1300-1305.
- Osman J, Inglada J, Christophe E. Interactive object segmentation in high resolution satellite images. Geosci Remote SensSymp 2009.
- Lee DS, Shan J, Bethel JS. Class-guided building extraction from Ikonos imagery, Photogram Eng Remote Sens 2003; 69: 143-150.
- Benediktsson JA, Pesaresi M, Amason K. Classification and feature extraction for remote sensing images from urban areas based on morphological transformations, IEEE Trans Geo Sci Remote Sens 2003; 41: 1940-1949.
- Shackelford AK, Davis CH. A combined fuzzy pixel-based and object-based approach for classification of high-resolution multispectral data over urban areas. IEEE Trans Geo Sci Remote Sens 2003; 41: 2354-2363.
- Tso B, Mather PM. Classification methods for remotely sensed data. Taylor Francis London 2001.
- Chang CI. Hyper-spectral imaging: Techniques for spectral detection and classification. Kluwer AcadPubl 2001.
- Varshney PK, Arora MK. Advanced image processing techniques for remote sensed hyper spectral data. Springer Verlag Germany 2004.
- Lu D, Weng Q. A survey of image classification methods and techniques for improving classification performance. Int J Remote Sens 2007; 28: 823-870.
- Jasinski MF. Estimation of sub pixel vegetation density of natural regions using satellite multispectral imagery. IEEE Trans Geosci Remote Sens 1996; 34: 804-813.
- Landgrebe D. Signal theory methods in multispectral remote sensing. John Wiley NJ 2003.
- Haralick RM, Shanmugam K, Dinstein I. Texture features for image classification. IEEE Trans Sys Man Cybernet 1973; 8: 610-621.
- Tuominen S, Pekkarinen A. Performance of different spectral and textural aerial photograph features in multi-source forest inventory. Remote SensEnv 2005; 94: 256-268.
- Liang H, Kun Y. A novel segmentation method of high resolution remote sensing image based on multi-feature object-oriented Markov random fields model. ProcIntConf Remote SensEnvTranspEng 2011; 8019-8024.
- Gaetano R, Zerubia J, Scarpaand G, Poggi G. Morphological road segmentation in urban areas from high resolution satellite images. ProcIntConf Dig Sig Process 2011; 1-8.
- Zhiqiang Z, Licheng J, Biao H, Shuang W, Jiaqi Z, Puhua C. Locality-constraint discriminant feature learning for high-resolution SAR image classification. J Neuro Comp 2016; 27: 772-784.
- Liujuan C, Cheng W, Jonathan L. Vehicle detection from highway satellite images via transfer learning. J Inform Sci 2016; 366: 177-187.
- Jalal AN, Mahmoud N, Sadoghi Y, Bahram N. ECG arrhythmia classification with support vector machines and genetic algorithm. Sim European Symp Comp Model Simul 2009.
- Sandya HB, Hemanth Kumar P, Himanshi B, Susham K. Fuzzy rule based feature extraction and classification of time series signal. Int J Soft Comp Eng 2013; 3: 42-47.
- Yorgos G, Costas P, Dimitrios IF, Aristidis L, Lampros KM. Automated ischemic beat classification using genetic algorithms and multi-criteria decision analysis. IEEE Trans Biomed Eng 2004; 51: 1717-1725.
- Berat D, Tamer O. Fuzzy clustering of ECG beats using a new meta-heuristic approach. Proc IWBBIO 2014.