ISSN: 0970-938X (Print) | 0976-1683 (Electronic)
Biomedical Research
An International Journal of Medical Sciences
Commentary - Biomedical Research (2018) Volume 29, Issue 20
Feature extraction based retinal image analysis for bright lesion classification in fundus image
Ganesh Naga Sai Prasad V, Ratna Bhargavi V*, Rajesh V
Department of Electronics and Communication Engineering, Koneru Lakshmaiah Education Foundation KLEF (KL Deemed to be University), Vaddeswaram, Guntur-22502, Andhra Pradesh, India
- *Corresponding Author:
- Ratna Bhargavi V
Department of Electronics and Communication Engineering
K L University
Andhra Pradesh, India
Accepted date: September 6, 2017
DOI: 10.4066/biomedicalresearch.29-16-2170
Visit for more related articles at Biomedical ResearchIn this paper a hybrid approach of fundus image classification for Diabetic Retinopathy (DR) lesions is proposed. Laplacian Eigenmaps (LE), a Nonlinear Dimensionality Reduction (NDR) technique is applied to a high dimensional Scale Invariant Feature Transform (SIFT) representation of fundus image for lesion classification. The applied NDR technique gives a low dimensional intrinsic feature vector for lesion classification in fundus images. The publicly available databases are used for demonstrating the implemented strategy. The performance of applied technique can be evaluated based on sensitivity, specificity, and accuracy using Support vector classifier. Compared to other feature vectors, the implemented LE based feature vector yielded better classification performance. The accuracy obtained is 96.6% for SIFT-LE-SVM.
Keywords
Diabetic retinopathy, SIFT, Feature extraction, Classification, LE-dimension reduction
Introduction
Diabetic Retinopathy (DR) is the main root cause of blindness and it happens to people with diabetes. According to International Diabetes Federation (IDF) people with diabetes may be increased to 552 million by 2030 [1]. Diabetes related complications are also increasing, that includes DR, which effecting 2-4% of people with diabetes [2-4]. It causes vision loss in the age group between 22-74 in most of the countries. So many computational systems are developed to support specialists in so many areas of health care, including DR [5-10].
So many screening systems are developed to identify different lesions simultaneously. A Bag-of-Visual Words (BoVW) model based on visual dictionaries developed [5,6,10]. This mode needs a visual dictionary for each lesion classification. Decenciere et al. [11] developed a technique for classifying referral patient’s data using heterogeneous information. They implemented wavelet based image characterization for the detection of DR signs like exudates, microaneurysms, and haemorrahages. They also used the diabetes related information like age, weight, diabetes type and demographic information.
Jelinek and Cree [12] given the explanation about proliferative retinopathy and it indicate immediate referring of ophthalmologist for treatment. Different types of multi resolution analysis techniques were used to recognize the lesion formation in retina and it showed the accuracy 88% [13]. Singh et al. [14] developed wavelet transform based feature extraction and genetic feature selection strategy for abnormality recognition. It is achieved the accuracy of 94.7%. Mookaiah et al. [15] developed system based on the existing published methods. They tested the system with collected private hospitals and STARE database samples. They achieved the accuracy of 95% with various ranked features. FU.D [16] proposed an automated DR screening method for retinal image grading assessment based on different morphological features using software. The result of this study yielded the sensitivity and specificity are reported to be 92% and 94% respectively. Agurto et al. [17] proposed multi-scale optimization approach for lesion detection. It uses AM-FM representations, where partial least square method has applied for classification in normal and abnormal images. Recently, Luca et al. [18] proposed bright lesion detection based on the probability maps, color, and wavelet analysis. The AUC (Area Under Curve) obtained is around 0.88 to 0.94. Ramon et al. [19] proposed soft assignment coding/max pooling for exudates detection; and for feature extraction Speeded up Robust Feature Extraction (SURF) algorithm is implemented. The reported AUC is 93.4%. For the detection of lesions, motion patterns are created for region of interest in color fundus images by Deepak and Sivaswamy [20]. For feature extraction Radon transform is used. The sensitivity and specificity are reported to be 100% and 74% respectively. Sohini et al. [21,22] proposed a novel technique based on maximum solidity and minimum intensity for lesion detection. Lesion classified based on hierarchical classification. The obtained sensitivity and specificity are 100% and 53.16% respectively. Grinsven et al. [23] proposed a bag of visual words approach to characterize the fundus image. They implemented decomposition of image as patches. From each image patch, various features are extracted and classification was done based on weighed nearest neighbor method. The resulted AUC is 0.90.
In this paper we used a novel combination of the existing techniques in literature in order to achieve a better sensitivity, specificity and accuracy compared to former implemented techniques. In our proposed method, the Contrast limited histogram equalization is applied as a preprocessing step, because fundus images in datasets are having noise and they are poorly illuminated. Contrast enhancement is done to increase the contrast between exudates and background. The image with fore ground lesions are segmented using active contour technique. In order to characterize the segmented lesions, features are extracted using Scale Invariant Feature Transform (SIFT). Now LE-NDR technique is applied to get low dimensionality feature vector. Finally Support Vector Machine classifier (SVM) is used based on low dimension feature vector for classification of both the lesions and nonlesions images.
Proposed method
The proposed method is having various stages for bright lesion detection in color fundus images. The first stage comprises preprocessing and the next stage is segmentation of anatomical structures and pathological parts. The third stage is feature extraction, stage four is about reduction of feature vector and the final stage is classification. Figure 1 shows the block diagram of proposed technique and the following sections will give detailed explanation about each method.

Figure 1: Block diagram of proposed system for lesion detection.
Image pre-processing
The color fundus images comprise Red (R), Green (G), Blue (B), intensity channels. Compared to other two channels, green channel is having most of the information about lesions. That is lesions appear brighter in this channel and other two channels are noisy. So we considered this channel for further processing. To increase the contrast between exudates and background Contrast Limited Adaptive Histogram Equalization (CLAHE) is applied to the green channel, it is shown in Figure 2. So that the sharp edges of lesions can be obtained.

Figure 2: (a) Color fundus image (b) Green channel extracted image (c) Histogram equalized image (d) Bilateral filter applied image (e) optic disk eliminated image.
Pre-processing step applied for all used images because images in databases are noisy and poorly illuminated. In order to suppress undesirable some visible spots, noise, lines, obstacles in CLAHE image, Bilateral Filter (BF) [24,25] is used. Because it smoothens flat surfaces while preserving sharp edges in image by having same pixels placed in every neighborhood. This is shown in Figure 2d.
Optic disk detection and elimination
There is higher order similarity in between Optic disk and exudates. By mistake, the system identifies the OD as a lesion. So the removing of OD is imperative for precise segmentation of exudates. The optic disk occupies maximum area in the fundus image and for this reason, by using connected component analysis, the OD is eliminated shown in Figure 2e.
Lesion segmentation
To identify the exudates region on the fundus image with proper description of their exact shape an Active Contour Technique (ACM) can be applied. By applying ACM the mostly likely boundary of extracted exudates region will be obtained. The binary image with exudates is used for initial position for active contour model in Figure 3. The precise boundary of exudates are obtained by using variational level set model [26,27], which is efficient in computation wise, and also the movement of contour towards the object boundary is more compared to other segmentation models such as snakes [28], Geometric Active Contours (GAC) [29], Gradient Vector Flow (GVF) [30], and traditional level sets [31].

Figure 3: (a) Thresholded image (b) Lesion segmented image.
In [32] signed pressure force (spf) function is implemented. It varies the strength of signs of pressure forces inside and outside the regions of interest. So that the contour shrinks when outside the object or expands when inside the object. The initial level set contour ϕ is defined around the detected lesions area is shown below.
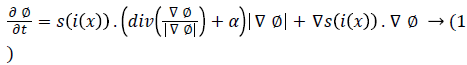
Where s is spf function and Δ is Laplacian operator.
This technique is robust to noise and it can handle without edges of objects in images. The level set evolution converges with 120 iterations by this technique compared to other segmentation models [28-31]. For these techniques the level set evolution converges with 6000 iterations.
Feature extraction
For extracting distinctive invariant features from images Lowe [33] given SIFT (Scale Invariant Feature Transform). SIFT that can be invariant to image scale and rotation. It is more robust to various changes in images like scaling, rotation, noisy, distorted, blurred. It locates the most key points compared to Speeded up robust feature extraction (SURF) algorithm [19] with less time. Here SIFT is applied for lesion features extraction in color fundus image shown in Figure 4. SIFT comprises four main stages: (a) scale-space detection, (b) key point localization, (c) orientation assignment and (d) key point descriptor. The first stage utilized Difference-of-Gaussian (DOG) function to identify potential interest points [33], which were invariant to scale and orientation. DOG was used instead of Gaussian to improve the computation speed [33-35].

Figure 4: SIFT applied image.
D (m, n, σ)=(G (m, n, k, σ) G (m, n, σ)) × I (m, n)=L (m, n, k, σ)-L (m, n, σ)
where × is the convolution operator, G (m, n, σ) is a variable scale Gaussian, I (m, n) is the input image D (m, n, σ) is Difference of Gaussians with scale k times.
Here the low contrast points and edge responses are eliminated in key point localization. Within a region around the key point, to obtain an orientation assignment, an orientation histogram was formed from the gradient orientations of sample points [33].
Dimensionality reduction using Lapalcian eigenmap (LE) function
Here the used SIFT, located more number of key points in fundus image. So it is necessary to reduce the dimension of the feature vector to have better classifier performance. Dimensionality reduction techniques are utilizing from so many years in pattern recognition and in other fields. PCA is one of the most popular linear dimension reduction methods because of its relative simplicity and effectiveness [36]. There exists other dimension reduction method like Isomap, Locally Linear Embedding (LLE). Belkin et al. proposed a dimension reduction method based on manifold embedding with Laplacian Eigen functions [37].
By applying LE technique, the data set {x1, x2,..., xn} in the high dimensional space Rh is mapped into the low-dimensional space Rl, which is represented as {y1, y2,...... ym}.
LE technique uses the construction of graph by considering each pattern as node and it computes graph Laplacian Eigen functions. Figure 5 shows the illustrations for dimensionality reduction for various patterns selected from lesions. Here Principal Component analysis (PC) [36] is compared with applied LE technique.

Figure 5: The highest two PCs (left graph) and LE functions (right graph) from various patterns from lesions.
Classification
After the reduction of features using LE technique, the obtained features given to Support Vector Machine (SVM) classifier. However, classification is important whether the detected pathologies are true exudates or not. SVM classifier is efficient for separating two different types of datasets and it is less complex. The SVM classifier is having a hyper plane to separate two datasets. In this system, SVM classifier is coupled with LE function. So that the number of false positives can be reduced and accuracy can be increased.
Experimental Results
Dataset
The proposed system is trained and tested by considering two publicly available datasets for normal and diseased patients. DIARETDB1 [38] dataset is having total 89 images with 500 field of view. These images are separated into two groups for training and testing. MESSIDOR [39] dataset contains total 1200 images with 450 field of view. We have implemented our CAD screening system on these images.
The statistical measures used for analyzing the performance of CAD screening system defined in terms of True Positives (TP), False Positives (FP), True Negatives (TN), and False Negatives (FN).
Sensitivity (sen)=TP/(TP+FN) × 100
Specificity (spe)=TN/(TN+FP) × 100
Accuracy (acc)=((sen+spe)/2) × 100
Where, TP-Number of abnormal images correctly identified as abnormal.
TN-Number of normal images correctly identified as normal.
FP-Number of normal images incorrectly identified as abnormal.
FN-Number of abnormal images incorrectly identified as normal.
To know the diagnosis performance we have to measure the sen, spe, and acc parameters. Figure 6 shows the ROC curve. If an ROC curve shows AUC=1, then it is perfect diagnosis, otherwise, if it shows 0.5, then it is worst case. In the proposed work SIFT-LE-SVM have achieved AUC=0.966 compared to SIFT-SVM AUC=0.953. The performance of proposed work is compared with previous researcher’s work shown in Table 1 and Figure 7.

Figure 6: ROC curve for proposed system.

Figure 7: Comparison of accuracies with proposed system.
| Technique | Sensitivity (%) | Specificity (%) | Accuracy (%) |
|---|---|---|---|
| Koh [40] | 89.37 | 95.57 | 92.4 |
| Xu [41] | 92 | 96.4 | 94.4 |
| Mookiah [15] | 90 | 100 | 95 |
| Anderson [5] | 94.7 | 96 | 95.3 |
| Luca [18] | 90.1 | 98 | 94.1 |
| Ramon [19] | 92 | 94.4 | 93.4 |
| Deepak [20] | 92 | 98 | 95 |
| Sohini [22] | 92.8 | 98 | 95.35 |
| SIFT-SVM | 90.6 | 100 | 95.3 |
| Proposed method SIFT-LE-SVM | 92.8 | 100 | 96.66 |
Table 1. Comparison of previous work and proposed work.
Conclusions
The proposed system applied automated feature extraction technique SIFT, LE and SVM for retinal image analysis for lesion identification. This system consisting of preprocessing, OD detection and elimination, exudates region detection using ACM and lesion classification. SIFT is applied to have an automated feature set for classification. LE method used to map high dimensional features to low dimensional features. So that SVM classifier performance can be raised. The proposed system is tested on two publicly available fundus image databases, i.e. diaretdb1and MESSIDOR. Our system has achieved a higher value of accuracy 96.6% compared to previous existing techniques. The efficiency of proposed system can be improved further by using a more accurate method for OD detection, lesion segmentation and by using the combination of classifiers.
References
- World Health Organization. Diab Prog 2012.
- Santhi D, Manimegalai D, Parvathi S, Karkuzhali S. Segmentation and classification of bright lesions to diagnose diabetic retinopathy in retinal images. Biomed Tech (Berl) 2016; 61: 443-453.
- Dai B, Wu X, Bu W. Retinal microaneurysms detection using gradient vector analysis and class imbalance classification. PLoS One 2016; 11: 0161556.
- Rosas-Romero R, Martinez-Carballido J, Hernandez-Capistran J, Uribe-Valencia LJ. A method to assist in the diagnosis of early diabetic retinopathy: Image processing applied to detection of microaneurysms in fundus images. Comput Med Imaging Graph 2015; 44: 41-53.
- Rocha A, Carvalho T, Jelinek H, Goldenstein S, Wainer J. Points of interest and visual dictionaries for automatic retinal lesion detection. IEEE Trans Biomed Eng 2012; 59: 2244-2253.
- Jelinek H, Pires R, Padilha R, Goldenstein S, Wainer J, Rocha A. Data fusion for multi-lesion diabetic retinopathy detection. Proc IEEE Comp Based Med Sys 2012; 1-4.
- Abramoff MD, Suttorp-Schulten MSA. Web-based screening for diabetic retinopathy in a primary care population: the eye check project. Telemed JE Health 2005; 11: 668-674.
- Peto T, Tadros C. Screening for diabetic retinopathy and diabetic macular edema in the United Kingdom. Curr Diab Rep 2012; 12: 338-345.
- Luckie A, Jelinek H, Cree M, Cesar R, Leandro J, McQuellin C, Mitchell P. Identification and follow-up of diabetic retinopathy in rural health in Australia: an automated screening model. Investigat Ophtalmol Visual Sci 2004; 45: 5245.
- Pires R, Jelinek HF, Wainer J, Rocha A. Retinal image quality analysis for automatic diabetic retinopathy detection. Proc IEEE Conf Graph Patterns Images (SIBGRAPI) 2012; 229-236.
- Decenciere E, Cazuguel G, Zhang X, Thibault G, Klein JC, Meyer F, Marcotegui B, Quellec G, Lamard M, Danno R. Teleophta: machine learning and image processing methods for teleophthalmology. Ingenierie Rec Biomed 2013; 34: 196-203.
- Jelinek H, Cree M. Automated image detection of retinal pathology. Boca Raton FL USA CRC Press 2010.
- Lahmiri S. High-frequency-based features for low and high retina haemorrhage classification. Healthc Technol Lett 2017; 4: 20-24.
- Singh A, Dutta MK, Partha Sarathi M, Uher V, Burget R. Image processing based automatic diagnosis of glaucoma using wavelet features of segmented optic disc from fundus image. Comput Methods Programs Biomed 2016; 124: 108-120.
- Mookiah MR, Acharya UR, Koh JE, Chandran V, Chua CK, Tan JH, Lim CM, Ng EY, Noronha K, Tong L, Laude A. Automated diagnosis of Age-related Macular Degeneration using greyscale features from digital fundus images. Comput Biol Med 2014; 53: 55-64.
- Fu D, Tong H, Zheng S, Luo L, Gao F, Minar J. Retinal status analysis method based on feature extraction and quantitative grading in OCT images. Biomed Eng Online 2016; 15: 87.
- Agurto C, Murray V, Barriga E, Murillo S, Pattichis M, Davis H, Russell S, Abramoff M, Soliz P. Multiscale AM-FM methods for diabetic retinopathy lesion detection. IEEE Trans Med Imag 2010; 29: 502-512.
- Luca FT, Seema G, Kenneth E. Exudate-based diabetic macular edema detection in fundus images using publicly available datasets. Med Imag Anal 2012; 16: 216-226.
- Ramon P, Herbert FJ, Jacques W, Siome GV, Anderson R. Assessing the need for referral in automatic diabetic retinopathy detection. IEEE Trans Biomed Eng 2013; 60: 3391-3398.
- Deepak K, Sivaswamy J. Automatic assessment of macular edema from color retinal images. IEEE Trans Med Imag 2012; 31: 766-776.
- Roychowdhury S, Koozekanani DD, Parhi KK. Screening fundus images for diabetic retinopathy. Proc Conf Record 46th Asilomar Conf Sign Sys Comp 2012; 1641-1645.
- Sohini K, Koozekanani DD. DREAM: Diabetic Retinopathy Analysis Using Machine Learning. IEEE J Biomed Health Inform 2014; 18.
- Van Grinsven MJJP, Chakravartyy A, Sivaswamy J, Theelen T, van Ginneken B, Sanchez CI. A bag of words approach for discriminating between retinal images containing exudates or Drusen. 2013 IEEE 10th International Symposium on Biomedical Imaging: From Nano to Macro San Francisco CA USA 2013.
- Eisemann E, Durand F. Flash photography enhancement via intrinsic relighting. ACM Trans Graph 2004; 23: 673-678.
- Petschnigg G, Szeliski R, Agrawala M, Cohen M, Hoppe H, Toyama K. Digital photography with flash and no-flash image pairs. ACM Trans Graph 2004; 23: 664-672.
- Li C, Xu C, Gui C, Fox MD. Level set evolution without re-initialization: a new variational formulation. Proc IEEE Conf Comp Vis Patt Recogn 2005; 1: 430-436.
- Lie J, Lysaker M, Tai XC. A variant of the level set method and applications to image segmentation. Math Comp 2006; 1155-1174.
- Kass M, Witkin A, Terzopouls D. Snake: active contour models. Proc Int J Comp Vis 1987; 321-331.
- Caselles V, Catte F, Coll T, Dibos F. A geometric model for active contours in image processing. Numerische Mathematik 1993; 66: 1-31.
- Xu C, Prince J. Snakes, shapes, and gradient vector flow. IEEE Trans Imag Proc 1998; 7: 359-369.
- Osher S, Fedkiw R. Level set methods: an overview and some recent results. J Comp Phys 2001; 169: 463-502.
- Kaihua Z, Lei Z, Huihui S, Wengang Z. Active contours with selective local or global segmentation: A new formulation and level set method. Imag Vis Comp 2010; 28: 668-676.
- Lowe DG. Object recognition from local scale invariant features. ICCV 1999; 1150-1157.
- Wang X. Robust image retrieval based on color histogram of local feature regions. Springer Netherlands 2009.
- Takacs G, Chandrasekhar V, Chen D, Tsai S, Grzeszczuk R, Girod B. Unified real-time tracking and recognition with rotation invariant fast features. IEEE Conf Comp Vis Patt Recogn (CVPR) 2010.
- Zhang YD, Wu L, Wei G. A new classifier for polarimetric SAR images. Prog Electromagn Res 2009; 94: 83-104.
- Belkin M, Niyogi P. Laplacian eigenmaps for dimensionality reduction and data representation. Neur Comp 2003; 15: 1373-1396.
- Kauppi T, Kalesnykiene V, Kmrinen JK, Lensu L, Sorr I, Raninen A, Voutilainen R, Uusitalo H, Klviinen H, Pietil J. Diaretdb1 diabetic retinopathy database and evaluation protocol. Proc 11th Conf Med Image Understand Anal 2007; 61-65.
- Methods to evaluate segmentation and indexing techniques in the field of retinal ophthalmology. Adics 2011.
- Koh JE, Acharya UR, Hagiwara Y, Raghavendra U, Tan JH, Sree SV, Bhandary SV, Rao AK, Sivaprasad S, Chua KC, Laude A, Tong L. Diagnosis of retinal health in digital fundus images using continuous wavelet transform (CWT) and entropies. Comput Biol Med 2017; 84: 89-97.
- Xu K, Zhu L, Wang R, Liu C, Zhao Y. Automated detection of diabetic retinopathy using deep convolutional neural networks. Med Phys 2016; 43: 3406.