ISSN: 0970-938X (Print) | 0976-1683 (Electronic)
Biomedical Research
An International Journal of Medical Sciences
Research Article - Biomedical Research (2017) Artificial Intelligent Techniques for Bio Medical Signal Processing: Edition-I
Effective ECG beat classification using colliding bodies.
Department of Computer Science and Engineering, Misrimal Navajee Munoth Jain Engineering College, Chennai, Tamil Nadu, India
- *Corresponding Author:
- Amutha Devi C
Department of CSE, Department of Computer Science and Engineering
Misrimal Navajee Munoth Jain Engineering College
Tamil Nadu, India
Accepted date: March 14, 2017
The proper functioning of the heart can be ascertained through ECG or Electro-Cardio-Gram. It is a form of signal that gives important information about the working of heart with respect to time and analysing ECG signals without manual intervention is an important application. Early detection of heart diseases or abnormalities is very important as it can help in prolonging life time and also to increase the quality of life. The ECG signals are captured by placing several electrode pads on the body at various positions. A better diagnosis of the heart disease can be achieved by using Multi-lead ECGs as it acquires signals simultaneously. This work focuses on the suggested Discrete Wavelet Transform (DWT) used in processing ECG recordings and also to extract certain attributes. The process of feature extraction and dimensionality reduction can be effectively performed using Principal Component Analysis (PCA). A population of knowledge structures is maintained in Genetic Algorithm (GA) called chromosomes. Each of these represents a candidate solution to the given problem. An algorithm having it basis on the governing laws of one dimensional collision between two bodies from physics was proposed and named as Colliding Bodies Optimization (CBO). This protocol is a modern populationbased stochastic optimization algorithm. Naïve Bayes, K-Nearest Neighbor (KNN) and Classification and Regression Tree (CART) classifiers are used. Through the outputs it is clear that the proposed method performs well when compared against other methods.
Keywords
Electro-cardio-gram (ECG), Beat classification, Discrete wavelet transform (DWT), Principal component analysis (PCA), Genetic algorithm (GA), Colliding bodies optimization (CBO).
Introduction
The electrical activity of heart can be recorded from the body surface using ECG. It is a monitoring tool and needs no incision made on the body surface. The actual functioning of the heart and the cardiovascular system can be accurately assessed using this method. An electrical impulse is generated by a process called depolarization. The required impulse is given by a group of nerve cells called the Sino Arterial node (SA). The impulse generated propagates through every cell in the heart. The waves due to depolarization results in contraction and relaxation of the cells in a particular order leading to heart beat. This action represents the flow of electricity and it is captured as ECG signals by the skin electrodes placed at different positions on the body surface [1]. The electrical signals propagate through the heart in a definite pattern. A usual ECG signal waveform of a normal heart beat is shown in Figure 1.

Figure 1: A typical ECG signal waveform.
Six upward and downward voltage deflections constitute an ECG signal. The initial deflection P is caused by the atrial complex [2] and ventricular complexes leads to other deflections namely Q, R, S, and T. If there is any variation apart from a normal ECG then it is an indication for some abnormal heart behaviour and indicates possible heart disease. If the heart disease is detected at early stages there is a possibility for treating it and sustain their lifetime. To combat heart diseases, many researches are being performed to study and analyse ECG signals. By classifying heart beats the possibility of heart disease can be determined. To arrive at a conclusion by this classification is quite tedious as certain heart disease does not appear frequently and long ECG measurements are required to capture them. To analyse these signals manually might consume more time as the data is huge, so automated analysis and classification can be adopted.
The heart rate is recorded as ECG signals. For clinical usage, the ECG must be acquired as a laboratory test result and it must be clinically assessed. The clinical assessment of these ECG may not be accurately performed by the clinicians and at times it is done under time constraints. To overcome this, automated analysis can be carried out as it helps clinicians to analyse ECG signals better. The ECG signals are traced on scaled paper and it consists of waves corresponding to electrical activity. The time is marked on horizontal axis while voltage is marked on the vertical axis. The ECG attributes are derived from these waves, as complexes, intervals, amplitudes and regularity of the features [3].
A particular type of diagnosis named as Arrhythmia depends upon the features of ECG pattern. The features of ECG must be accurately interpreted to recognise Arrhythmia. In order to accurately detect diseases from ECG pattern, the prime requirement is to precisely understand the normal pattern. If the waves are found to be irregular, then it might report some abnormality. The wave pattern in an ECG sample corresponds to the given parameters. There is an indication for arrhythmic pattern if the measurements do not adhere to the normal wave pattern. Further even disturbance in the order of waves and missing waves might indicate abnormalities.
The ECG wave pattern must be accurately interpreted and classified in coronary intensive unit. Classification of ECG beats is important in diagnosis. Cardiologists mainly depend on ECG reports to detect any abnormalities in heart behaviour. Consequently the signals must be analysed efficiently to identify and treat cardiac diseases. So far many algorithms were developed for recognising and classifying ECG signal. Time and frequency domain were used in developing the algorithms. Several specific attributes are defined to allow recognition between the beats belonging to different pathological classes. For a particular person the ECG wave pattern may differ to such an extent that two reports are unlike each other and on the other hand same for different type of beats. To classify ECG wave pattern techniques like Artificial Neural Network (ANN) and fuzzy-based methods were also used [4].
To diagnose arrhythmias is a tedious task as it is essential to assess each heartbeat of the ECG pattern which is acquired through holter monitor which can run for days or in some cases for days too. Further the possibility of human error is high since the process causes fatigue in humans. Computational methods are the best alternatives for manual assessment. There are four steps in classifying arrhythmia with the signal obtained from ECG wave pattern through a fully automated system. They are: 1) ECG signal pre-processing; 2) heartbeat segmentation; 3) feature extraction and 4) learning/ classification. Every step leads to an action and in the final step the type of heart beat is identified [5].
The second stage namely feature extraction stage is the main process in classifying the ECG signals to detect arrhythmia. A feature is, if information is extracted from the heartbeat it is used in differentiating the type of heartbeat. The several forms in which the feature is extracted are; directly from the ECG signal’s morphology in the time domain and/or in the frequency domain or from the cardiac rhythm. This paper work deals with DWT based feature extraction method.
Feature selection [6] is a procedure in which a subset is selected from the training set and this set is used as features in classification. There are two main advantages of feature selection. Firstly, it reduces the size of efficient features thereby making training and applying a classifier more effective. Secondly, due to feature selection there is increase in classification accuracy by removing unwanted features. If an unwanted or noisy feature is added to a document representation it tends to increase the classification error on new data. The two common methodologies in feature selection are filter and wrapper methods. In filter technique of feature selection, the subset is selected based on the characteristics of the data whereas in wrapper technique, a classifier is applied to achieve the optimal subset. Filter methods are computationally inexpensive when compared to wrapper methods. In this work, the efficacy of various standard features selection techniques such as PCA, GA is evaluated and a new method based on Colliding Bodies Optimization (CBO) is proposed.
Classification can be termed as form of data analysis in which models are extracted to describe data classes. There are several applications for classification and few of them are fraud detection, target marketing, performance prediction, manufacturing, and medical diagnosis due to its high accuracy, prediction rate and automatic method to search for hypothesis. Algorithms like Support Vector Machine (SVM), naïve Bayes, decision trees, hiking etc. are employed for varied classification and prediction. In this work, Naïve Bayes, KNN and CART classifiers are employed.
This work suggests the efficient ECG beat classification employing CBO. Section 2 reviews literature related to the proposed work. Section 3 explains methodology and Section 4 discusses the results of experiments conducted in proposed work. Section 5 concludes the work.
Related Works
Khazaee [7] suggested an innovative method to categorize ECG signals into normal beats and two manifestations of heart arrhythmia. The suggested method has three modules namely: a feature extraction module, a classifier module, and an optimization module. The feature extraction module consists of a standard set in which the shape features and timing features are combined. They form the efficient features of the patterns. A multi-class SVM-based classifier is suggested in the classifier module. Likewise in optimization module, a Particle Swarm Optimization (PSO) algorithm is presented to search for optimal value of the SVM parameters and also to search for best suited subset of features that can be fed to classifier.
Padmavathi and Ramanujam [8] suggested a Multivariate Maximal Time Series Motif with Naïve Bayes Classifier to classify an irregular ECG. The ECG signals of the patients are generally recorded using Holter monitor. These recordings are combined to form the dataset to evaluate the suggested model of predicting Time Series Motif. The efficacy of the suggested work was illustrated when it was compared with other existing feature extraction methods.
Alickovic and Subasi [9] investigated the design of an effective recognition method that could diagnose heart diseases. There are three main modules in this above said method: de-noising module, feature extraction module, and classifier module. In the de-noising module, Multi-Scale PCA (MSPCA) was employed to decrease the noise in ECG signals. In the feature extraction module, Auto-Regressive (AR) modelling was utilized for extracting features. In the classifier module, several classifiers are studied such as simple logistic, KNN, Multi- Layer Perceptron (MLP), Radial Basis Function (RBF) networks, and SVMs. The experimental results demonstrate that the classification accuracy attained through MSPCA denoising and AR modelling was about 99.93%.
Lin et al. [10] proposed a simple and reliable feature selection algorithm for ECG signals to detect abnormal heart conditions. In this work a popular technique namely PCA was employed for feature selection. Heart beats can be determined using fuzzy logic and Fisher’s Linear Discriminant Analysis (Fisher’s LDA). The suggested method has many advantages like simple mathematic operations, high speed, low memory space, good detection results and high reliability. Three major stages are considered in this work: (i) QRS extraction stage for detecting QRS waveform using the Difference Operation Method (DOM); (ii) qualitative features stage for qualitative feature selection from ECG signals using the PCA method; and (iii) classification stage for determining the heartbeat of a patient using fuzzy logic and Fisher’s LDA.
Pasolli and Melgani [11] suggested a new method to assist the cardiologist in labelling the training samples. These training samples have probable mislabelling problems and are removed using automatic means. This technique has its basis on a genetic optimization process. In this process every individual chromosome corresponds to a candidate solution used in validating or invalidating the training samples. Further the optimization procedure optimally joins two dissimilar criteria. The maximised statistical seperatability among classes and minimised number of invalidated samples. Experiments were conducted on real time ECG signals were extracted from the Massachusetts Institute of Technology-Beth Israel Hospital (MIT-BIH) arrhythmia database. The results proved the efficiency of the proposed method.
The diagnostic information present in ECGs is of great use to detect cardiac arrhythmia. By employing machine learning and data mining techniques the accuracy of ECG arrhythmia detection is improved. Kumari and Rajesh Kumar [12] suggested a multi-layer Perceptron neural network optimization in GA to classify ECG arrhythmia. The RR intervals are extracted by Symlet from ECG data as features while symmetric uncertainty guarantees feature reduction. GA optimizes learning rate and momentum.
Augustyniak [13] proposed an innovative technique in which optimization of ECG dataset for classifying heart beat is based on the subject. The protocol studies from arbitrarily chosen strips of the signal and preliminarily classifies the example beats. If the classified beats are approved by a human operator, then they are distributed to learning and testing sets. It is also given to GA with aggressive mutation to select features with best discriminative power. Few genes could be represented through integers. The algorithm restricts the initially available feature space of fifty-seven elements to three-five features optimized for a particular subject. (Changed and please check for meaning).
Murugan and Radhakrishnan [14] suggested an enhanced form of PCA and Independent Component Analysis (ICA) to extract feature and to classify the ischemic beats from ECG signal. In order to extract more appropriate features, Fuzzy C-Means (FCM) and GA were combined with PCA and ICA. The suggested techniques are called as Fuzzy-Genetic based PCA (FGPCA) and Fuzzy-Genetic based ICA (FGICA). Least Square Support Vector Machine (LSSVM) using features from the FGPCA and FGICA, classifies the beats into ischemic or non-ischemic.
Methodology
The recent trend in optimization methods is Meta-heuristics which are used in solving combinatorial optimization problems [15] as it manages to get good solutions efficiently for complex problems. It is especially useful in cases where traditional methods get stuck at local minima’s. The available stochastic search methods generally use the concept of simulating natural phenomena. GA draws inspiration from biological evolution theory proposed by Darwin. PSO [16] takes its ides by simulating the social interaction behaviour of birds flocking and fish schooling. Ant Colony Optimization (ACO) is based on ant colonies which finds shortest route between the food and their nest [17]. Similarly, the Harmony Search (HS) algorithm [18] derives its concept from the musical process in which a perfect harmony is searched for. CBO is a recently developed type of meta-heuristic algorithm that was introduced and applied to structural problems by Kaveh and Mahdavi. This section describes DWT based feature extraction technique, PCA, GA and CBO based feature selection techniques and naïve Bayes, KNN and CART classifiers.
Discrete wavelet transform (DWT) feature extraction
A method to assess the seismic data was proposed and named as the wavelet transform by Morlet in 1980s. The wavelet transforms are an effective replacement for Fourier algorithm as they can be applied to one and multi-dimensional data analysis and synthesis. They also have several applications such as in mathematics, physics, and digital image processing. The wavelets are applicable for both continuous-time signal and discrete-time signal. For instance, a wavelet depicting a discrete signal X ,that consists N samples can be computed by convolving X with the Low-Pass Filters (LPF) and High-Pass Filters (HPF) and down-sampling the output signal by 2, such that each of the two frequency bands contains N/2 samples. This method depends on the use of wavelets as the basis functions to represent other functions. A finite support in time and frequency domain is presented to these basis functions. Multi resolution analysis is attained by employing the mother wavelet and family of wavelets generated by translations and dilations of it.
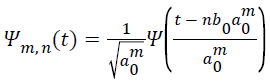
DWT [19] can be significantly used for analysing transients, a periodic and other non-stationary signal features. So, it could be effectively used in processing ECG signals. The DWT utilizes a dyadic grid which is an integer power of two scaling in a and b and ortho normal wavelet basis function as given below Equation 1.
 →(1)
→(1)
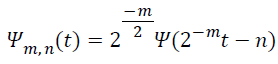
Here the integer m and n regulate wavelet dilation and translation respectively. The dyadic grid wavelet can be stated by substituting a0=2 and b0=1, as in Equation 2.
 →(2)
→(2)
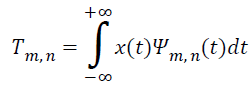
Now the DWT can be written as in Equation 3.
 →(3)
→(3)
Here Tm, n represents the wavelet (or detail) coefficient at scale and location indices (m, n). The ECG signals can be analysed efficiently by crucially selecting the wavelet and number of decomposition levels area. The Haar wavelet algorithm overlooks certain details and this can be rectified by the Daubechies wavelet algorithm though it is conceptually complicated. If a member of the db family does not perfectly represent a signal it could represented by another member of db signal. The most important factor in wavelet applications is choosing a wavelet function such that closely matches the signal to be processed. Daubechies wavelet family and QRS complex are analogous in shape and have energy spectrum concentrated around low frequencies.
Principal component analysis (PCA) feature selection
PCA [20] is a popular technique followed for feature extraction and dimensionality reduction. In this technique, it is assumed that most of the information pertaining to classes is directed along largest variation. PCA is mostly derived in terms of a standardized linear projection which increases the variance in the projected space. PCA can be effectively used for data compression in which the number of dimensions is reduced without much loss of information.
The steps are given below.
Step 1: Get the input data.
Step 2: Calculate the mean from the data set.
Step 3: Subtract the mean.
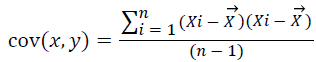
Step 4: Calculate the covariance from the Equation 4:
 →(4)
→(4)
Here  represents the mean of dataset. Evaluate the covariance
matrix.
represents the mean of dataset. Evaluate the covariance
matrix.
Step 5: Calculate the Eigen vectors and Eigen value of the covariance matrix.
Step 6: Choose components and form a feature vector.
Step 7: Derive a new data set by using the given Formula 5:
Final data=Row feature vector × Row data adjust → (5)
In the above statement the matrix with Eigen vectors in the column transpose is given by Row Feature Vector and mean adjusted transpose is given by Row data Adjust. PCA assumes the following for feature extraction and dimensionality reduction. It is that the information of the observation vectors is restricted in the subspace spanned by the first m principal axes, where m<pfor a p-dimensional data space. Therefore, each original data vector can be represented by its principal component vector with dimensionality m.
Feature selection based on genetic algorithm (GA)
One among the meta-heuristic optimization technique is GA, in which, simulated annealing, Tabu search, and evolutionary strategies are included. GA is based on the principle of natural evolution. It is a stochastic and a powerful tool that can effectively contribute optimal solutions for several diverse and complicated problems. The process of implementing GA is given below: In the first step, any potential solution is described as numerical vector and encoded to generate a random population. A brief description on the concept and operation of GA is given below [21].
Selection operator: The individuals from a given population are selected based on its fitness values.
Recombination: Through cross over operation new individuals are created from old ones. Crossover is based on probability where there is exchange of information between two or more parent individuals to generate new child individuals.
Mutation operator: For a specific individual, mutation can be applied to generate a modified mutant child.
Fitness function: By using fitness function the quality of the solutions can be evaluated.
The pseudo code for GA contains:
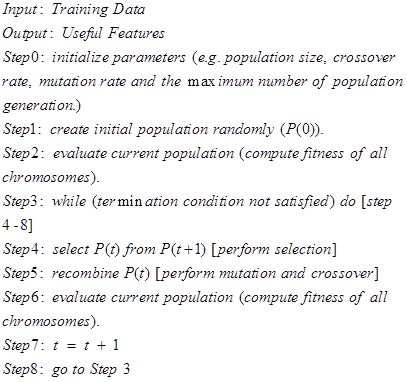
The disadvantages of GA are that it doesn’t achieve global optimum when overall solution has various population, encoding of chromosomes is not easy for complex problems, and the output maybe not be able to understandable to the user.
Proposed feature selection based on colliding bodies optimization (CBO)
Kaveh and Mahdavi [22] developed a modern meta-heuristic search algorithm named CBO [18]. There is decreased energy level when two bodies collide with each other. The idea of CBO is simple and it is independent of any internal parameter. Every individual colliding body (CB), Xi, has a specified mass given by the Equation 6:
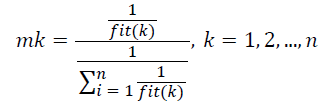 →(6)
→(6)
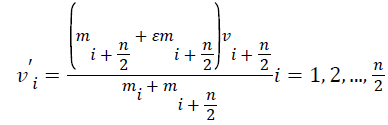
Here fit (i) represent the objective function value of the ith CB and n is the number of colliding bodies. For collision, the object pairs are sorted in terms of their mass in descending order and divided into two equal groups. In order to select pairs of objects for collision (i) stationary group, (ii) moving group. The stationary objects are collided by the moving objects in order to improve their position and also the position of the moving object. The velocities of the stationary and moving bodies before collision (vi) are evaluated by Equations 7 and 8.
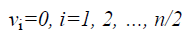 →(7)
→(7)
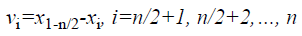 →(8)
→(8)
After collision, the velocity of stationary and moving CBs (vi) are evaluated by Equations 9-11.
 →(9)
→(9)
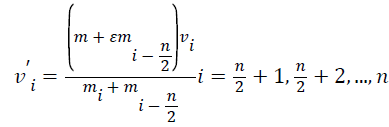 →(10)
→(10)
 →(11)
→(11)
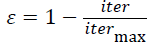
From the above equation, iter and itermax represent the current iteration number and the total number of iteration for optimization process respectively. ε is the Coefficient of Restitution (COR).
New positions of each group are updated by Equations 12 and 13.
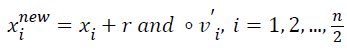 →(12)
→(12)
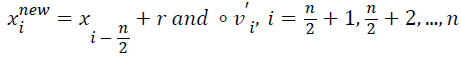 →(13)
→(13)
Where xinew, xi, vi’ represent the new position, previous position and the velocity attained after collision of the ith CB, respectively. r and represents a random vector which is uniformly distributed within the range of [-1, 1] and the sign ‘‘°’’ indicates element-by-element multiplication.
The objective of the proposed CBO feature selection is to minimize the mean square error. Each entity is represented by a subset of features. The proposed algorithm then converges at the optimal subset of features.
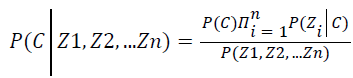
Naïve Bayes classifier
The Naïve Bayes classifier [23] is also named as simple Bayesian classifier built on Bayes’ theorem. The classifier is typically a simple Bayesian Network (BN) and it is most suitable for instances where the dimensionality of the inputs are high. Bayes rule is used to compute the posterior of classification variable. Posterior of classification variable C depends on the feature variables Z1, Z2… Zn as given below Equation 14.
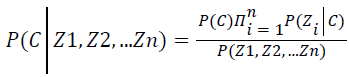 →(14)
→(14)
Assuming it as independent of class conditional, it can be written as Equation 15.
 →(15)
→(15)
From the above equation it could be inferred that the joint conditional probability is given by the product of all the marginal conditional probabilities. The second assumption is that all features Z1, Z2… Zn directly depends on the classification variable C. On imposing the above two assumptions on general BN classifier, it can attain the Naïve Bayes classifier as Equation 16.
 →(16)
→(16)
Hence to predict the class of each sample it derives the model as Equation 17.
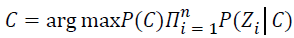 →(17)
→(17)
The above equation can be used to predict the class of each sample.
K-Nearest neighbour algorithm (KNN) classifier
The KNN [24] is one of the well-known statistical classification algorithms employed for classifying objects based on closest training examples in the feature space. The algorithm is lethargic in learning as the KNN function is estimated locally and all computations are postponed until classification. In the training stage there is no actual model or learning performed. Though it requires a training dataset, it is only used in populating a sample of search space with the instances of known classes. Due to this, the algorithm is also termed as lazy learning algorithm. It could be deduced that the training data is not employed in generalization but instead it is required in testing phase. For a known class instance, when given for evaluation, the algorithm processes its K closest neighbours. The class is assigned by voting among those neighbours. In using KNN algorithm one can compute the training phase easily but on the other hand testing is costly in terms of time and memory.
The KNN algorithm has two phases: Training phase and Classification phase. In training phase, the training examples are represented as vectors assigned with a class label in a multi-dimensional feature space. This phase stores the feature vectors and class labels of training samples. In the classification phase, K is a constant defined by the user, a query or test point i.e. an unlabelled vector is classified by assigning a label. This is the mostly repeated among the K training samples nearest to that query point. In other words, the KNN method makes a comparison between the query points or an input feature vector with a library of reference vectors. The query point is labelled with the nearest class of library feature vector. It is simple to categorize query points based on their distance to points in a training data set. It is an effective way to classify new points.
The main advantage of the KNN method is that it requires only few parameters to tune in classifying the objects; K and the distance metric is used to achieve high classification accuracy. The most critical task in KNN based implementations are in choosing the best of K and distance metric for computing the nearest distance. Typically k with large values reduces the noise effect but instead make boundaries between classes indistinct. Considering a special instance in which the class is predicted to be the class of the closest training sample (i.e. when K=1) is called the nearest neighbour algorithm. In binary classification problems, when k is chosen to be an odd number it avoids tied votes. Hence the K value is defined to produce high correct classification rate.
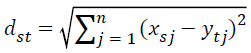
This is generally used in computing the distance between two objects. It examines the root of square differences between coordinates of a pair of objects and can be given by below Equation 18.
 →(18)
→(18)
Classification and regression tree (CART) classifier
CART [25] that are based on class label produces an output that is either classification or regression. For a categorical class label, CART gives a classification tree and for a numeric class label a regression tree is give. The attribute values of the given data are used in creating a decision tree. Every rule that is created depends on the attribute values. Till the last node namely the class node is reached, the rules are applied to the nodes.
A CART is a binary tree in which for a given an input X an output Ÿ is produced, approximating random variable of interest Y, stochastically related to X. The following is the deterministic mapping. Every internal node of the tree is related to a binary function of input X and each external node is connected to specific output label Y. The input X is tested by the binary function from the root node. Depending on the result, for instance if the output is ‘0’ the left branch is followed and if the output is ‘1’ the right branch is followed. The process continues until an external node/leaf is reached when associated label Y is the output. The expected loss between Y and Ÿ is minimized by the tree.
Results and Discussion
In this section, feature selection based PCA, GA and CBO methods and naïve Bayes, KNN and CART classifiers are evaluated. The accuracy, precision, recall and f measure as shown in and Figures 2-5.

Figure 2: Accuracy.

Figure 3: Precision.

Figure 4: Recall.

Figure 5: F measure.
From the Figure 2, it can be observed that the CBO has higher accuracy by 5.6%, 7.98% and 7.52% for PCA and by 1.9%, 2.52% and 2.3% for GA when compared with naive Bayes, KNN and CART classifiers respectively.
From the Figure 3, it can be observed that the CBO has higher precision by 7.51%, 10.75% and 10.27% for PCA and by 2.65%, 3.51% and 3.75% for GA when compared with naive Bayes, KNN and CART classifiers respectively.
From the Figure 4, it can be observed that the CBO has higher recall by 7.25%, 9.72% and 8.95% for PCA and by 2.4%, 2.01% and 2.16% for GA when compared with naive Bayes, KNN and CART classifiers respectively.
From the Figure 5, it can be observed that the CBO has higher f measure by 7.44%, 10.41% and 9.79% for PCA and by 2.61%, 2.78% and 2.98% for GA when compared with naive Bayes, KNN and CART classifiers respectively.
Conclusion
A heart disease can be detected using an ECG which is an electrical recording of the heart. The signals of ECG are classified as normal and abnormal signals. Techniques such as DWT based feature extraction technique, PCA, GA and CBO based feature selection techniques and naïve Bayes, KNN and CART classifiers are proposed. The suggested CBO is based on the governing laws of collision from the physics where each solution vector is considered as a colliding body. The process of movement in CBs is determined by these laws. The CBO is simple and there is no need for internal parameter for tuning. Through results it could prove that CBO has higher accuracy by 5.6%, 7.98% and 7.52% for PCA and by 1.9%, 2.52% and 2.3% for GA when compared with naive Bayes, KNN and CART classifiers respectively same as precision, recall and f measure.
References
- Emanet N. ECG beat classification by using discrete wavelet transform and Random Forest algorithm. Soft computing with words and perceptions in system analysis decision and control 2009. ICSCCW Fifth International Conference 2009; 1-4.
- De Gaetano A, Panunzi S, Rinaldi F, Risi A, Sciandrone M. A patient adaptable ECG beat classifier based on neural networks. Appl Math Comp 2009; 213: 243-249.
- Aslantas G, Gürgen F, Salah AA. GA-NN approach for ecg feature selection in rule based arrhythmia classification. Neural Network World 2014; 24: 267.
- Karpagachelvi S, Arthanari M, Sivakumar M. Classification of ECG signals using extreme learning machine. Comp Inform Sci 2011; 4: 42.
- Luz EJDS, Schwartz WR, Camara-Chavez G, Menotti D. ECG-based heartbeat classification for arrhythmia detection: A survey. Comp Methods Programs Biomed 2016; 127: 144-164.
- Kohli N, Verma NK. Arrhythmia classification using SVM with selected features. Int J Eng Sci Technol 2011; 3: 122-131.
- Khazaee A. Heart beat classification using particle swarm optimization. Int J Intel Sys Appl 2013; 5: 25.
- Padmavathi S, Ramanujam E. Naïve Bayes classifier for ecg abnormalities using multivariate maximal time series Motif. Procedia Computer Science 2015; 47: 222-228.
- Alickovic E, Subasi A. Effect of multiscale PCA de-noising in ECG beat classification for diagnosis of cardiovascular diseases. Circuits Sys Sign Proc 2015; 34: 513-533.
- Lin LC, Yeh YC, Chu T. Feature selection algorithm for ECG signals and its application on heartbeat case determining. Int J Fuzzy Sys 2014; 16: 483-496.
- Pasolli E, Melgani F. Genetic algorithm-based method for mitigating label noise issue in ECG signal classification. Biomed Sign Proc Control 2015; 19: 130-136.
- Kumari VSR, Rajesh KP. Optimization of multi-layer perceptron neural network using genetic algorithm for arrhythmia classification. J Communications 2015; 3: 150-157.
- Augustyniak P. Subject-optimized feature selection for accurate classification of cardiac beats. Comp Cardiol 2014; 617-620.
- Murugan S, Radhakrishnan S. Improving ischemic beat classification using fuzzy-genetic based PCA and ICA. Int J Comput Sci Eng 2010; 2: 1532-1538.
- Rodrigues D, Pereira LA, Nakamura RY, Costa KA, Yang XS, Souza AN, Papa JP. A wrapper approach for feature selection based on bat algorithm and optimum-path forest. Exp Sys Appl 2014; 41: 2250-2258.
- Inbarani HH, Azar AT, Jothi G. Supervised hybrid feature selection based on PSO and rough sets for medical diagnosis. Comp Methods Prog Biomed 2014; 113: 175-185.
- Kashef S, Nezamabadi H. An advanced ACO algorithm for feature subset selection. Neurocomputing 2015; 147: 271-279.
- Inbarani HH, Bagyamathi M, Azar AT. A novel hybrid feature selection method based on rough set and improved harmony search. Neural Comp Appl 2015; 26: 1859-1880.
- Sambhu D, Umesh AC. Automatic classification of ECG signals with features extracted using wavelet transform and support vector Machines. Int J Adv Res Electrical Electronics Instrumentation Eng 2013; 2: 235-241.
- Patra D, Das MK, Pradhan S. Integration of FCM, PCA and neural networks for classification of ECG arrhythmias. IAENG Int J Comp Sci 2010; 36: 24-62.
- Nasiri JA, Sabzekar M, Yazdi HS, Naghibzadeh M, Naghibzadeh B. Intelligent arrhythmia detection using genetic algorithm and emphatic SVM (ESVM). Comp Model Simul Third UKSim European Symposium 2009; 112-117.
- Kaveh A, Ilchi Ghazaan M. Computer codes for colliding bodies optimization and its enhanced version. Int J Optim Civil Eng 2014; 4: 321-332.
- Janani R. Evaluation of wavelets and classifiers in classifying cardiovascular disorders using wavelet transform. Int J 2014; 2.
- Saini I, Singh D, Khosla A. QRS detection using K-Nearest Neighbor algorithm (KNN) and evaluation on standard ECG databases. J Adv Res 2013; 4: 331-344.
- Kumar RG. Performance analysis of soft computing techniques for classifying cardiac arrhythmia. Ind J Comp Sci Eng (IJCSE) 2014; 4: 6.