ISSN: 0970-938X (Print) | 0976-1683 (Electronic)
Biomedical Research
An International Journal of Medical Sciences
Research Article - Biomedical Research (2017) Volume 28, Issue 3
Dysregulated pathways in type 2 diabetes mellitus
1Central Laboratory of Xinjiang Medical University, China
2Cancer Institute, the Affiliated Cancer Hospital of Xinjiang Medical University, China
3Clinical Laboratory Diagnostic Center, General Hospital of Xinjiang Military Region, China
4Chinese Medicine School of Xinjiang Medical University, China
Accepted on September 13, 2016
Objective: Type 2 Diabetes Mellitus (T2DM) is a leading health problem worldwide. In this study, we aimed to identify the pathways significantly relevant to T2DM, and a brief review based on these pathways was made.
Materials and Methods: The genes associated with T2DM were extracted by text mining tool from literature database. Then we employed the Fisher’s exact test based on the cumulative hypergeometric distribution to evaluate the pathways relevant to T2DM.
Result: A total of 135 genes associated with T2DM were confirmed and 76 pathways significantly relevant to T2DM were identified from 880 cellular pathways. These 76 pathways could be classified mainly in five classes: adipocytokine, inflame, PPAR, insulin and T2DM pathway. Adipocytokine pathway from KEGG database was the most relevant pathway.
Conclusion: Disregulation of adipocytokine and inflammatory pathway is the hallmark of T2DM originated from the organism in the status of excess energy over long time span.
Keywords
Type 2 diabetes mellitus, Pathways, Dysregulation, Adipocytokine, Insulin.
Introduction
Type 2 Diabetes (T2DM) has become a leading health problem worldwide. According to the International Diabetes Federation, the total number of the patients with diabetes is predicted to rise to 552 million by the year of 2030 [1]. Furthermore, the patients with T2DM tended to develop cardiovascular disease and other vascular complications such as peripheral vascular disease, diabetic nephropathy, and diabetic retinopathy and so on. It is widely accepted that T2DM is a complex disease as a joint action of genetic background and environmental factor. Therefore, great efforts have been made to identify the genes associated with T2DM, and a number of genes have been identified. The genes always performed biological function in cooperation way rather than alone, particularly in complex diseases. In the development of T2DM, the signaling pathway of pathological mechanism was more important than individual genes. Admittedly, there were a great number of signaling pathways related to T2DM, which were discussed in the medicine literature database.
In this study, we reviewed signaling pathways related to T2DM, which was identified as dysregulated pathway associated with disease [2-5]. As refer to system review, meta-analysis was also employed to evaluate the parameters from different studies. The genes associated with T2DM by text mining tool were extracted from literature database. Then we employed the Fisher’s exact test based on the cumulative hypergeometric distribution to evaluate the pathways relevant to T2DM.
Method
Construction of cellular pathways database
All of the pathways with the gene members were downloaded from an integrated pathway database Molecular Signatures Database (MSigDB) [6], which is a large collection of annotated functional gene sets. There are 880 canonical pathways with 6804 genes members in the database, including the metabolic and signaling pathways collected from Biocarta (www.Biocarta.com), KEGG [7], and Reactome [8].
Extraction of genes related to T2DM from the literature
We searched candidate genes associated with T2DM by PolySearch text mining system, which can produce a list of concepts relevant to the user’s query by analyzing multiple information sources including PubMed, OMIM, DrugBank and Swiss-Prot. It covers many types of biomedical concepts including diseases, genes/proteins, drugs, metabolites, SNPs, pathways and tissues [9]. The query type is ‘Disease-Gene/ Protein Association’ and the query keyword is ‘type 2 diabetes’. PolySearch system returns 1325 literatures. To check the accuracy, we manually confirmed whether these genes were associated with the T2DM. Finally a total of 135 candidate genes were obtained (Table 1).
| SN | Pathway Name | Class | p-value |
|---|---|---|---|
| 1 | KEGG adipocytokine signaling pathway | Adipocytokine | 3.17E-07 |
| 2 | KEGG type ii diabetes mellitus | T2DM | 4.88E-07 |
| 3 | BIOCARTA PPARA pathway | PPAR | 6.56E-07 |
| 4 | BIOCARTA cytokine pathway | Inflammation | 1.91E-06 |
| 5 | BIOCARTA INFLAM pathway | Inflammation | 1.68085E-05 |
| 6 | Reactome regulation of lipid metabolism by peroxisome proliferator activated receptor alpha |
PPAR | 2.28286E-05 |
| 7 | BIOCARTA IL5 pathway | Inflammation | 2.74777E-05 |
| 8 | Reactome signal attenuation | Insulin | 4.28557E-05 |
| 9 | BIOCARTA DC pathway | Inflammation | 5.60284E-05 |
| 10 | KEGG PPAR signaling pathway | PPAR | 5.65648E-05 |
Table 1. Top 10 statistically relevant pathways with T2DM ranked by P-value
Identification of dysregulated pathways associated with T2DM
To examine the association of the pathway with T2DM, Fisher’s exact test based on the cumulative hypergeometric distribution was employed. The P-value was calculated to evaluate statistical significance of a given pathway by the formula as follow.
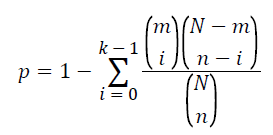
In this formula, N represents the total number of genes in the background population; n represents the number of genes related to T2DM extracted from literatures; m denotes the number of genes within the given pathways. The number of genes that overlapped with both T2DM related genes and this pathway are denoted as k. In this study, the pathway is considered association with T2DM if its P-value is less than 0.05.
Result
Pathways associated with T2DM
Of eight hundreds and eighty pathways, three hundreds and seventy four pathways contain at least one gene of the one hundred and thirty five genes related to T2DM (Table 2). Seventy six pathways statistically associated with T2DM were identified (p<0.05, Table 2).
| SN | Pathway name | P-value | Number of genes in the pathway | Number of overlapped genes |
|---|---|---|---|---|
| 1 | KEGG adipocytokine signaling pathway | 3.17E-07 | 67 | 12 |
| 2 | KEGG type ii diabetes mellitus | 4.88E-07 | 47 | 9 |
| 3 | BIOCARTA PPARA pathway | 6.56E-07 | 58 | 9 |
| 4 | BIOCARTA cytokine pathway | 1.91E-06 | 21 | 6 |
| 5 | BIOCARTA INFLAM Pathway | 1.68085E-05 | 29 | 6 |
| 6 | Reactome regulation of lipid metabolism by peroxisome proliferator activated receptor alpha | 2.28286E-05 | 61 | 8 |
| 7 | BIOCARTA IL5 pathway | 2.74777E-05 | 10 | 4 |
| 8 | Reactome signal attenuation | 4.28557E-05 | 11 | 4 |
| 9 | BIOCARTA DC pathway | 5.60284E-05 | 22 | 5 |
| 10 | KEGG PPAR signaling pathway | 5.65648E-05 | 69 | 8 |
| 11 | KEGG leishmania infection | 7.72476E-05 | 72 | 8 |
| 12 | Reactome PI3K cascade | 8.67844E-05 | 38 | 6 |
| 13 | KEGG maturity onset diabetes of the young | 0.00010699 | 25 | 5 |
| 14 | Reactome IRS related events | 0.000150919 | 79 | 8 |
| 15 | Reactome downstream signaling of activated FGFR | 0.000177383 | 43 | 6 |
| 16 | BIOCARTA GH pathway | 0.000190377 | 28 | 5 |
| 17 | KEGG JAK STAT signaling pathway | 0.000228524 | 155 | 11 |
| 18 | BIOCARTA IL10 pathway | 0.000283718 | 17 | 4 |
| 19 | Reactome chylomicron mediated lipid transport | 0.000283718 | 17 | 4 |
| 20 | KEGG cytokine cytokine receptor interaction | 0.000754833 | 267 | 14 |
| 21 | BIOCARTA insulin pathway | 0.000808775 | 22 | 4 |
| 22 | BIOCARTA leptin pathway | 0.00110817 | 11 | 3 |
| 23 | BIOCARTA NTHI pathway | 0.001138568 | 24 | 4 |
| 24 | KEGG aldosterone regulated sodium reabsorption | 0.001321971 | 42 | 5 |
| 25 | KEGG hematopoietic cell lineage | 0.001688182 | 88 | 7 |
| 26 | Reactome lipoprotein metabolism | 0.001797438 | 27 | 4 |
| 27 | BIOCARTA granulocytes pathway | 0.002341151 | 14 | 3 |
| 28 | SIG insulin receptor pathway in cardiac myocytes | 0.002654552 | 49 | 5 |
| 29 | BIOCARTA stem pathway | 0.002884567 | 15 | 3 |
| 30 | KEGG toll like receptor signaling pathway | 0.003910244 | 102 | 7 |
| 31 | BIOCARTA PML pathway | 0.00418812 | 17 | 3 |
| 32 | Reactome regulation of insulin like growth factor activity by insulin like growth factor binding proteins | 0.00418812 | 17 | 3 |
| 33 | KEGG cytosolic DNA sensing pathway | 0.004764438 | 56 | 5 |
| 34 | Reactome metabolism of lipids and lipoproteins | 0.005288124 | 228 | 11 |
| 35 | KEGG insulin signaling pathway | 0.005574524 | 137 | 8 |
| 36 | KEGG allograft rejection | 0.006395459 | 38 | 4 |
| 37 | SIG PIP3 signaling in cardiac myoctes | 0.007857084 | 63 | 5 |
| 38 | BIOCARTA HER2 pathway | 0.00882709 | 22 | 3 |
| 39 | KEGG graft versus host disease | 0.009127855 | 42 | 4 |
| 40 | Reactome GPCR ligand binding | 0.010184646 | 392 | 15 |
| 41 | KEGG type I diabetes mellitus | 0.010740936 | 44 | 4 |
| 42 | KEGG intestinal immune network for IGA production | 0.014493763 | 48 | 4 |
| 43 | KEGG adherens junction | 0.016001105 | 75 | 5 |
| 44 | Reactome nuclear receptor transcription pathway | 0.016645491 | 50 | 4 |
| 45 | BIOCARTA NKT pathway | 0.017231882 | 28 | 3 |
| 46 | ST STAT3 pathway | 0.018967271 | 11 | 2 |
| 47 | KEGG T cell receptor signaling pathway | 0.01971209 | 108 | 6 |
| 48 | KEGG asthma | 0.020755172 | 30 | 3 |
| 49 | BIOCARTA NFAT pathway | 0.021524131 | 54 | 4 |
| 50 | BIOCARTA ASBCELL pathway | 0.022469461 | 12 | 2 |
| 51 | BIOCARTA ACE2 pathway | 0.026215434 | 13 | 2 |
| 52 | BIOCARTA TCRA pathway | 0.026215434 | 13 | 2 |
| 53 | Reactome SOS mediated signalling | 0.026215434 | 13 | 2 |
| 54 | BIOCARTA IL1R pathway | 0.026726425 | 33 | 3 |
| 55 | Reactome platelet adhesion to exposed collagen | 0.03019464 | 14 | 2 |
| 56 | Reactome SHC related events | 0.03019464 | 14 | 2 |
| 57 | BIOCARTA carm ER pathway | 0.031163931 | 35 | 3 |
| 58 | KEGG prion diseases | 0.031163931 | 35 | 3 |
| 59 | Reactome regulation of insulin secretion by glucagon like peptide 1 | 0.031983614 | 61 | 4 |
| 60 | KEGG nod like receptor signaling pathway | 0.033682644 | 62 | 4 |
| 61 | BIOCARTA longevity pathway | 0.034396291 | 15 | 2 |
| 62 | BIOCARTA nuclearrs pathway | 0.034396291 | 15 | 2 |
| 63 | Reactome class C3 metabotropic glutamate pheromone receptors | 0.034396291 | 15 | 2 |
| 64 | SA MMP cytokine connection | 0.034396291 | 15 | 2 |
| 65 | BIOCARTA toll pathway | 0.035963655 | 37 | 3 |
| 66 | Reactome PI3K akt signalling | 0.035963655 | 37 | 3 |
| 67 | Reactome G alpha S signalling events | 0.038177788 | 126 | 6 |
| 68 | Reactome glucose transport | 0.038497865 | 38 | 3 |
| 69 | BIOCARTA rela pathway | 0.038809538 | 16 | 2 |
| 70 | Reactome diabetes pathways | 0.038839459 | 383 | 13 |
| 71 | BIOCARTA IL17 pathway | 0.043426096 | 17 | 2 |
| 72 | BIOCARTA IL7 pathway | 0.043426096 | 17 | 2 |
| 73 | BIOCARTA lair pathway | 0.043426096 | 17 | 2 |
| 74 | BIOCARTA NO2IL12 pathway | 0.043426096 | 17 | 2 |
| 75 | KEGG renin angiotensin system | 0.043426096 | 17 | 2 |
| 76 | Reactome regulation of gene expression in beta cells | 0.049148321 | 101 | 5 |
| 77 | BIOCARTA biopeptides pathway | 0.052485943 | 43 | 3 |
| 78 | BIOCARTA TH1TH2 pathway | 0.053227544 | 19 | 2 |
| 79 | BIOCARTA TID pathway | 0.053227544 | 19 | 2 |
| 80 | Reactome CD28 dependent PI3K AKT signaling | 0.053227544 | 19 | 2 |
| 81 | Reactome MYD88 cascade | 0.053227544 | 19 | 2 |
| 82 | Reactome downstream events in GPCR signaling | 0.058232248 | 448 | 14 |
| 83 | Reactome regulation of insulin secretion by free fatty acids | 0.05839479 | 20 | 2 |
| 84 | Reactome G alpha I signalling events | 0.060669959 | 177 | 7 |
| 85 | Reactome class A1 rhodopsin like receptors | 0.062787056 | 292 | 10 |
| 86 | BIOCARTA IL6 pathway | 0.069217801 | 22 | 2 |
| 87 | Reactome regulation of beta cell development | 0.074677825 | 114 | 5 |
| 88 | BIOCARTA IL12 pathway | 0.074856758 | 23 | 2 |
| 89 | BIOCARTA NFKB pathway | 0.074856758 | 23 | 2 |
| 90 | Reactome phospholipase cmediated cascade | 0.074856758 | 23 | 2 |
| 91 | Reactome toll like receptor 9 cascade | 0.074856758 | 23 | 2 |
| 92 | BIOCARTA CSK pathway | 0.080636382 | 24 | 2 |
| 93 | BIOCARTA PGC1A pathway | 0.080636382 | 24 | 2 |
| 94 | KEGG nicotinate and nicotinamide metabolism | 0.080636382 | 24 | 2 |
| 95 | Reactome activated TLR4 signalling | 0.080636382 | 24 | 2 |
| 96 | KEGG hypertrophic cardiomyopathy HCM | 0.086981297 | 85 | 4 |
| 97 | KEGG neuroactive ligand receptor interaction | 0.088943124 | 272 | 9 |
| 98 | KEGG TGF beta signaling pathway | 0.0898965 | 86 | 4 |
| 99 | Reactome platelet degranulation | 0.0898965 | 86 | 4 |
| 100 | Reactome hemostasis | 0.092072368 | 274 | 9 |
| 101 | Reactome FGFR ligand binding and activation | 0.098749518 | 27 | 2 |
| 102 | Reactome FRS2mediated cascade | 0.098749518 | 27 | 2 |
| 103 | SIG IL4receptor in B lyphocytes | 0.098749518 | 27 | 2 |
| 104 | Reactome the role of NEF in HIV1 replication and disease pathogenesis | 0.105020165 | 28 | 2 |
| 105 | Reactome toll like receptor 4 cascade | 0.105020165 | 28 | 2 |
| 106 | KEGG thyroid cancer | 0.111395597 | 29 | 2 |
| 107 | Reactome CD28 co stimulation | 0.111395597 | 29 | 2 |
| 108 | Reactome regulation of glucokinase by glucokinase regulatory protein | 0.111395597 | 29 | 2 |
| 109 | ST PAC1 receptor pathway | 0.112893641 | 6 | 1 |
| 110 | Reactome cell surface interactions at the vascular wall | 0.114852428 | 94 | 4 |
| 111 | BIOCARTA HDAC pathway | 0.117870092 | 30 | 2 |
| 112 | Reactome peptide ligand binding receptors | 0.127151728 | 173 | 6 |
| 113 | KEGG alanine aspartate and glutamate metabolism | 0.131089449 | 32 | 2 |
| 114 | Reactome glucagon type ligand receptors | 0.137822509 | 33 | 2 |
| 115 | ST G alpha I pathway | 0.144630194 | 34 | 2 |
| 116 | Reactome TRKA signalling from the plasma membrane | 0.146132767 | 103 | 4 |
| 117 | KEGG regulation of autophagy | 0.15150708 | 35 | 2 |
| 118 | Reactome costimulation by the CD28 family | 0.160167933 | 70 | 3 |
| 119 | Reactome formation of platelet plug | 0.161866188 | 186 | 6 |
| 120 | ST interferon gamma pathway | 0.164501309 | 9 | 1 |
| 121 | KEGG RIG I like receptor signaling pathway | 0.164970398 | 71 | 3 |
| 122 | BIOCARTA barrestin pathway | 0.181032002 | 10 | 1 |
| 123 | BIOCARTA EPHA4 pathway | 0.181032002 | 10 | 1 |
| 124 | BIOCARTA FREE pathway | 0.181032002 | 10 | 1 |
| 125 | BIOCARTA SARS pathway | 0.181032002 | 10 | 1 |
| 126 | BIOCARTA SODD pathway | 0.181032002 | 10 | 1 |
| 127 | KEGG limonene and pinene degradation | 0.181032002 | 10 | 1 |
| 128 | Reactome calcitonin like ligand receptors | 0.181032002 | 10 | 1 |
| 129 | Reactome ethanol oxidation | 0.181032002 | 10 | 1 |
| 130 | Reactome regulation of RHEB GTPASE activity by AMPK | 0.181032002 | 10 | 1 |
| 131 | Reactome removal of the flap intermediate from the C strand | 0.181032002 | 10 | 1 |
| 132 | KEGG tryptophan metabolism | 0.186746657 | 40 | 2 |
| 133 | BIOCARTA EPONFKB pathway | 0.197238684 | 11 | 1 |
| 134 | BIOCARTA IL4 pathway | 0.197238684 | 11 | 1 |
| 135 | BIOCARTA monocyte pathway | 0.197238684 | 11 | 1 |
| 136 | BIOCARTA SET pathway | 0.197238684 | 11 | 1 |
| 137 | BIOCARTA TCAPOPTOSIS pathway | 0.197238684 | 11 | 1 |
| 138 | Reactome CD28 dependent VAV1 pathway | 0.197238684 | 11 | 1 |
| 139 | Reactome HDL mediated lipid transport | 0.197238684 | 11 | 1 |
| 140 | Reactome recycling of bile acids and salts | 0.197238684 | 11 | 1 |
| 141 | Reactome signaling by VEGF | 0.197238684 | 11 | 1 |
| 142 | Reactome G ALPHA Q signalling events | 0.198766887 | 157 | 5 |
| 143 | KEGG pathways in cancer | 0.199838877 | 328 | 9 |
| 144 | Reactome metabolism of vitamins and cofactors | 0.201152563 | 42 | 2 |
| 145 | ST differentiation pathway in PC12 cells | 0.201152563 | 42 | 2 |
| 146 | KEGG FC EPSILON RI signaling pathway | 0.204794347 | 79 | 3 |
| 147 | Reactome metabolism of carbohydrates | 0.208609462 | 119 | 4 |
| 148 | BIOCARTA VDR pathway | 0.213126719 | 12 | 1 |
| 149 | Reactome amino acid synthesis and interconversion | 0.213126719 | 12 | 1 |
| 150 | Reactome facilitative NA independent glucose transporters | 0.213126719 | 12 | 1 |
| 151 | Reactome hormone sensitive lipase HSL mediated triacylglycerol hydrolysis | 0.213126719 | 12 | 1 |
| 152 | Reactome PECAM1 interactions | 0.213126719 | 12 | 1 |
| 153 | BIOCARTA CHREBP2 pathway | 0.215684056 | 44 | 2 |
| 154 | KEGG amino sugar and nucleotide sugar metabolism | 0.215684056 | 44 | 2 |
| 155 | BIOCARTA CARM1 pathway | 0.228702605 | 13 | 1 |
| 156 | Reactome death receptor signalling | 0.228702605 | 13 | 1 |
| 157 | Reactome early phase of HIV life cycle | 0.228702605 | 13 | 1 |
| 158 | Reactome notch HLH transcription pathway | 0.228702605 | 13 | 1 |
| 159 | Reactome platelet activation | 0.234452963 | 167 | 5 |
| 160 | Reactome class B2 secretin family receptors | 0.235974908 | 85 | 3 |
| 161 | Reactome toll receptor cascades | 0.241254985 | 86 | 3 |
| 162 | Reactome regulation of insulin secretion | 0.24157095 | 212 | 6 |
| 163 | BIOCARTA PS1 pathway | 0.243972659 | 14 | 1 |
| 164 | BIOCARTA THELPER pathway | 0.243972659 | 14 | 1 |
| 165 | Reactome polymerase switching | 0.243972659 | 14 | 1 |
| 166 | Reactome regulation of AMPK activity via LKB1 | 0.243972659 | 14 | 1 |
| 167 | Reactome removal of the flap intermediate | 0.243972659 | 14 | 1 |
| 168 | Reactome SEMA3A plexin repulsion signaling by inhibiting integrin adhesion | 0.243972659 | 14 | 1 |
| 169 | KEGG glycerolipid metabolism | 0.252357662 | 49 | 2 |
| 170 | KEGG prostate cancer | 0.257208586 | 89 | 3 |
| 171 | BIOCARTA ERYTH pathway | 0.258942366 | 15 | 1 |
| 172 | BIOCARTA HIF pathway | 0.258942366 | 15 | 1 |
| 173 | BIOCARTA HSP27 pathway | 0.258942366 | 15 | 1 |
| 174 | BIOCARTA PITX2 pathway | 0.258942366 | 15 | 1 |
| 175 | Reactome repair synthesis of patch 27 30 bases long by dna polymerase | 0.258942366 | 15 | 1 |
| 176 | Reactome SEMA3A PAK dependent axon repulsion | 0.258942366 | 15 | 1 |
| 177 | BIOCARTA CDMAC pathway | 0.273617327 | 16 | 1 |
| 178 | BIOCARTA GATA3 pathway | 0.273617327 | 16 | 1 |
| 179 | BIOCARTA IL22BP pathway | 0.273617327 | 16 | 1 |
| 180 | BIOCARTA P53 pathway | 0.273617327 | 16 | 1 |
| 181 | KEGG pantothenate and COA biosynthesis | 0.273617327 | 16 | 1 |
| 182 | KEGG riboflavin metabolism | 0.273617327 | 16 | 1 |
| 183 | Reactome CRMPS in SEMA3A signaling | 0.273617327 | 16 | 1 |
| 184 | Reactome trafficking OF GLUR2 containing AMPA receptors | 0.273617327 | 16 | 1 |
| 185 | KEGG MTOR signaling pathway | 0.274461925 | 52 | 2 |
| 186 | KEGG starch and sucrose metabolism | 0.274461925 | 52 | 2 |
| 187 | KEGG amyotrophic lateral sclerosis als | 0.281827569 | 53 | 2 |
| 188 | KEGG autoimmune thyroid disease | 0.281827569 | 53 | 2 |
| 189 | BIOCARTA 41BB pathway | 0.288004756 | 17 | 1 |
| 190 | Reactome activated AMPK stimulates fatty acid oxidation in muscle | 0.288004756 | 17 | 1 |
| 191 | Reactome energy dependent regulation of MTOR by LKB1 AMPK | 0.288004756 | 17 | 1 |
| 192 | Reactome chemokine receptors bind chemokines | 0.29654026 | 55 | 2 |
| 193 | Reactome signaling in immune system | 0.297591031 | 366 | 9 |
| 194 | BIOCARTA CARDIACEGF PATHWAY | 0.302108705 | 18 | 1 |
| 195 | BIOCARTA CCR5 pathway | 0.302108705 | 18 | 1 |
| 196 | Reactome synthesis and interconversion of nucleotide DI and triphosphates | 0.302108705 | 18 | 1 |
| 197 | Reactome TIE2 signaling | 0.302108705 | 18 | 1 |
| 198 | BIOCARTA MAL pathway | 0.315935373 | 19 | 1 |
| 199 | BIOCARTA TGFB pathway | 0.315935373 | 19 | 1 |
| 200 | Reactome unfolded protein response | 0.315935373 | 19 | 1 |
| 201 | ST WNT CA2 CYCLIC GMP pathway | 0.315935373 | 19 | 1 |
| 202 | KEGG pathogenic Escherichia coli infection | 0.325816274 | 59 | 2 |
| 203 | BIOCARTA NKCELLS pathway | 0.329490364 | 20 | 1 |
| 204 | Reactome lagging strand synthesis | 0.329490364 | 20 | 1 |
| 205 | KEGG acute myeloid leukemia | 0.333091259 | 60 | 2 |
| 206 | BIOCARTA IGF1 pathway | 0.342778444 | 21 | 1 |
| 207 | BIOCARTA TOB1 pathway | 0.342778444 | 21 | 1 |
| 208 | Reactome CTLA4 inhibitory signaling | 0.342778444 | 21 | 1 |
| 209 | Reactome NEF mediates down modulation of cell surface receptors by recruiting them to clathrin adapters | 0.342778444 | 21 | 1 |
| 210 | KEGG colorectal cancer | 0.347572803 | 62 | 2 |
| 211 | KEGG glycolysis gluconeogenesis | 0.347572803 | 62 | 2 |
| 212 | KEGG beta alanine metabolism | 0.355805397 | 22 | 1 |
| 213 | Reactome E2F transcriptional targets AT G1 S | 0.355805397 | 22 | 1 |
| 214 | Reactome regulation of insulin secretion by acetylcholine | 0.355805397 | 22 | 1 |
| 215 | BIOCARTA IGF1R pathway | 0.368575513 | 23 | 1 |
| 216 | KEGG mismatch repair | 0.368575513 | 23 | 1 |
| 217 | Reactome collagen mediated activation cascade | 0.368575513 | 23 | 1 |
| 218 | Reactome cytosolic TRNA aminoacylation | 0.368575513 | 23 | 1 |
| 219 | Reactome integrin ALPHAIIBBETA3 signaling | 0.368575513 | 23 | 1 |
| 220 | ST MYOCYTE AD pathway | 0.368575513 | 23 | 1 |
| 221 | BIOCARTA CXCR4 pathway | 0.381093919 | 24 | 1 |
| 222 | BIOCARTA ECM pathway | 0.381093919 | 24 | 1 |
| 223 | BIOCARTA EIF4 pathway | 0.381093919 | 24 | 1 |
| 224 | BIOCARTA TPO pathway | 0.381093919 | 24 | 1 |
| 225 | Reactome further platelet releasate | 0.381093919 | 24 | 1 |
| 226 | Reactome translocation of ZAP70 to immunological synapse | 0.381093919 | 24 | 1 |
| 227 | BIOCARTA stress pathway | 0.393366933 | 25 | 1 |
| 228 | KEGG ascorbate and aldarate metabolism | 0.393366933 | 25 | 1 |
| 229 | ST granule cell survival pathway | 0.393366933 | 25 | 1 |
| 230 | KEGG pancreatic cancer | 0.404331386 | 70 | 2 |
| 231 | KEGG renal cell carcinoma | 0.404331386 | 70 | 2 |
| 232 | BIOCARTA WNT pathway | 0.40539825 | 26 | 1 |
| 233 | KEGG galactose metabolism | 0.40539825 | 26 | 1 |
| 234 | KEGG glycosaminoglycan biosynthesis heparan sulfate | 0.40539825 | 26 | 1 |
| 235 | Reactome phosphorylation of CD3 and TCR zeta chains | 0.40539825 | 26 | 1 |
| 236 | Reactome platelet aggregation plug formation | 0.40539825 | 26 | 1 |
| 237 | KEGG melanoma | 0.411269367 | 71 | 2 |
| 238 | KEGG leukocyte transendothelial migration | 0.4139359 | 118 | 3 |
| 239 | BIOCARTA GSK3 pathway | 0.417192519 | 27 | 1 |
| 240 | Reactome GS alpha mediated events in glucagon signalling | 0.417192519 | 27 | 1 |
| 241 | Reactome metabolism of bile acids and bile salts | 0.417192519 | 27 | 1 |
| 242 | Reactome mtor signalling | 0.417192519 | 27 | 1 |
| 243 | ST GAQ pathway | 0.417192519 | 27 | 1 |
| 244 | KEGG viral myocarditis | 0.425026476 | 73 | 2 |
| 245 | BIOCARTA ERK pathway | 0.428754508 | 28 | 1 |
| 246 | Reactome extension of telomeres | 0.428754508 | 28 | 1 |
| 247 | ST tumor necrosis factor pathway | 0.428754508 | 28 | 1 |
| 248 | Reactome transmembrane transport of small molecules | 0.43253684 | 218 | 5 |
| 249 | BIOCARTA TNFR1 pathway | 0.440088451 | 29 | 1 |
| 250 | BIOCARTA VEGF pathway | 0.440088451 | 29 | 1 |
| 251 | KEGG histidine metabolism | 0.440088451 | 29 | 1 |
| 252 | Reactome PD1 signaling | 0.440088451 | 29 | 1 |
| 253 | KEGG arrhythmogenic right ventricular cardiomyopathy arvc | 0.445347369 | 76 | 2 |
| 254 | KEGG O glycan biosynthesis | 0.45119977 | 30 | 1 |
| 255 | Reactome inhibition of insulin secretion by adrenaline noradrenaline | 0.45119977 | 30 | 1 |
| 256 | Reactome trafficking of AMPA receptors | 0.45119977 | 30 | 1 |
| 257 | KEGG neurotrophin signaling pathway | 0.455945611 | 126 | 3 |
| 258 | KEGG peroxisome | 0.458673954 | 78 | 2 |
| 259 | BIOCARTA EGF pathway | 0.462091982 | 31 | 1 |
| 260 | BIOCARTA NO1 pathway | 0.462091982 | 31 | 1 |
| 261 | Reactome dna strand elongation | 0.462091982 | 31 | 1 |
| 262 | BIOCARTA PDGF pathway | 0.472768962 | 32 | 1 |
| 263 | Reactome integration of energy metabolism | 0.475275159 | 229 | 5 |
| 264 | Reactome integrin cell surface interactions | 0.478314638 | 81 | 2 |
| 265 | KEGG propanoate metabolism | 0.483236372 | 33 | 1 |
| 266 | Reactome E2F Mediated Regulation OF dna replication | 0.483236372 | 33 | 1 |
| 267 | Reactome global genomic NER | 0.483236372 | 33 | 1 |
| 268 | ST phosphoinositide 3 kinase pathway | 0.483236372 | 33 | 1 |
| 269 | Reactome glucose and other sugar SLC transporters | 0.484766066 | 82 | 2 |
| 270 | BIOCARTA AT1R pathway | 0.493496954 | 34 | 1 |
| 271 | BIOCARTA MPR pathway | 0.493496954 | 34 | 1 |
| 272 | KEGG butanoate metabolism | 0.493496954 | 34 | 1 |
| 273 | Reactome glucagon signaling in metabolic regulation | 0.493496954 | 34 | 1 |
| 274 | ST adrenergic | 0.493496954 | 34 | 1 |
| 275 | KEGG ECM receptor interaction | 0.497520685 | 84 | 2 |
| 276 | KEGG huntingtons disease | 0.499771774 | 185 | 4 |
| 277 | KEGG base excision repair | 0.503555775 | 35 | 1 |
| 278 | KEGG primary immunodeficiency | 0.503555775 | 35 | 1 |
| 279 | Reactome downstream signal transduction | 0.503555775 | 35 | 1 |
| 280 | Reactome generic transcription pathway | 0.503555775 | 35 | 1 |
| 281 | Reactome innate immunity signaling | 0.506625831 | 136 | 3 |
| 282 | KEGG progesterone mediated oocyte maturation | 0.510074735 | 86 | 2 |
| 283 | KEGG natural killer cell mediated cytotoxicity | 0.511562943 | 137 | 3 |
| 284 | BIOCARTA AGR pathway | 0.513415813 | 36 | 1 |
| 285 | KEGG dna replication | 0.513415813 | 36 | 1 |
| 286 | KEGG apoptosis | 0.522423923 | 88 | 2 |
| 287 | BIOCARTA ALK pathway | 0.52308166 | 37 | 1 |
| 288 | BIOCARTA MET pathway | 0.52308166 | 37 | 1 |
| 289 | Reactome generation of second messenger molecules | 0.52308166 | 37 | 1 |
| 290 | KEGG systemic lupus erythematosus | 0.526218712 | 140 | 3 |
| 291 | BIOCARTA IL2RB pathway | 0.532556772 | 38 | 1 |
| 292 | BIOCARTA integrin pathway | 0.532556772 | 38 | 1 |
| 293 | ST JNK MAPK pathway | 0.532556772 | 38 | 1 |
| 294 | ST B cell antigen receptor | 0.541845322 | 39 | 1 |
| 295 | KEGG dilated cardiomyopathy | 0.546496153 | 92 | 2 |
| 296 | KEGG pyruvate metabolism | 0.550950289 | 40 | 1 |
| 297 | Reactome tRNA aminoacylation | 0.550950289 | 40 | 1 |
| 298 | KEGG bladder cancer | 0.568625212 | 42 | 1 |
| 299 | KEGG fatty acid metabolism | 0.568625212 | 42 | 1 |
| 300 | Reactome amine ligand binding receptors | 0.568625212 | 42 | 1 |
| 301 | KEGG ABC transporters | 0.585609257 | 44 | 1 |
| 302 | KEGG lysine degradation | 0.585609257 | 44 | 1 |
| 303 | KEGG nucleotide excision repair | 0.585609257 | 44 | 1 |
| 304 | KEGG valine leucine and isoleucine degradation | 0.585609257 | 44 | 1 |
| 305 | KEGG vasopressin regulated water reabsorption | 0.585609257 | 44 | 1 |
| 306 | Reactome transcription coupled NER | 0.585609257 | 44 | 1 |
| 307 | ST T cell signal transduction | 0.585609257 | 44 | 1 |
| 308 | BIOCARTA keratinocyte pathway | 0.601929247 | 46 | 1 |
| 309 | SIG BCR signaling pathway | 0.601929247 | 46 | 1 |
| 310 | KEGG melanogenesis | 0.602930248 | 102 | 2 |
| 311 | BIOCARTA TCR pathway | 0.60984844 | 47 | 1 |
| 312 | KEGG NOTCH signaling pathway | 0.60984844 | 47 | 1 |
| 313 | Reactome downstream TCR signaling | 0.60984844 | 47 | 1 |
| 314 | KEGG MAPK signaling pathway | 0.612801313 | 267 | 5 |
| 315 | KEGG proteasome | 0.61761117 | 48 | 1 |
| 316 | Reactome signalling by NGF | 0.619395375 | 215 | 4 |
| 317 | Reactome glucose regulation of insulin secretion | 0.621608973 | 161 | 3 |
| 318 | KEGG regulation of actin cytoskeleton | 0.623069227 | 216 | 4 |
| 319 | Reactome nucleotide excision repair | 0.625220656 | 49 | 1 |
| 320 | KEGG endometrial cancer | 0.64715898 | 52 | 1 |
| 321 | KEGG taste transduction | 0.64715898 | 52 | 1 |
| 322 | Reactome hormone biosynthesis | 0.64715898 | 52 | 1 |
| 323 | KEGG alzheimers disease | 0.654370368 | 169 | 3 |
| 324 | KEGG arginine and proline metabolism | 0.661071062 | 54 | 1 |
| 325 | KEGG oocyte meiosis | 0.663511038 | 114 | 2 |
| 326 | KEGG basal cell carcinoma | 0.667821884 | 55 | 1 |
| 327 | KEGG steroid hormone biosynthesis | 0.667821884 | 55 | 1 |
| 328 | KEGG vibrio cholerae infection | 0.674438596 | 56 | 1 |
| 329 | BIOCARTA HIVNEF pathway | 0.687282801 | 58 | 1 |
| 330 | Reactome host interactions of HIV factors | 0.690930426 | 120 | 2 |
| 331 | Reactome platelet activation triggers | 0.693515301 | 59 | 1 |
| 332 | Reactome toll like receptor 3 cascade | 0.693515301 | 59 | 1 |
| 333 | Reactome steroid metabolism | 0.711481452 | 62 | 1 |
| 334 | Reactome signaling by PDGF | 0.722874284 | 64 | 1 |
| 335 | Reactome TCR signaling | 0.722874284 | 64 | 1 |
| 336 | KEGG cell cycle | 0.724623084 | 128 | 2 |
| 337 | KEGG axon guidance | 0.728611171 | 129 | 2 |
| 338 | Reactome insulin synthesis and secretion | 0.728611171 | 129 | 2 |
| 339 | KEGG chemokine signaling pathway | 0.730600953 | 190 | 3 |
| 340 | Reactome transmission across chemical synapses | 0.732550442 | 130 | 2 |
| 341 | Reactome semaphorin interactions | 0.73382026 | 66 | 1 |
| 342 | Reactome phase 1 functionalization of compounds | 0.739131451 | 67 | 1 |
| 343 | KEGG epithelial cell signaling in helicobacter pylori infection | 0.744336963 | 68 | 1 |
| 344 | KEGG cell adhesion molecules CAMS | 0.747829139 | 134 | 2 |
| 345 | Reactome NCAM signaling for neurite out growth | 0.749439776 | 69 | 1 |