ISSN: 0970-938X (Print) | 0976-1683 (Electronic)
Biomedical Research
An International Journal of Medical Sciences
Research Article - Biomedical Research (2017) Volume 28, Issue 1
Development of four stress levels in group stroop colour word test using HRV analysis
Vanitha L1*, Suresh GR2, Chandrasekar M3, Punita P3
1Department of Electronics and Communication, Prathyusha Institute of Technology and Management, Tamilnadu, India
2Department of Electronics and Communication, Easwari Engineering College, Tamilnadu, India
3Department of Physiology, Meenakshi Medical College Hospital and Research Institute, Tamilnadu, India
- *Corresponding Author:
- Vanitha L
Department of Electronics and Communication
Prathyusha Institute of Technology and Management
India
Accepted on April 20, 2016
Background: Stress has become an integrated part of our life. Stress was modelled as four stages by Hans Selye’s in his General Adaptation Syndrome (GAS) model. Objective: The main objective of this work is to design an efficient laboratory Group Stroop Colour Word Test (GSCWT) to induce distinct four levels of stress that is, no stress, low, medium and high stress, which mimics a real time working memory (WM) load for the subject and thus cause stress for the subject.
Subjects and Method: Healthy and normal 50 subject’s Heart Rate Variability (HRV) is considered for analysis. GSCWT is developed using software Matlab 2013 and is validated by recording ECG both at rest and while performing the different levels of stroop task. The time domain, frequency domain parameters of HRV is determined using kubios software and the influence of GSCWT between the different levels of stress is analysed using statistical t-test to compare the features between each state and one-way Anova test is used to compare the features between all states. SPSS software is used for statistical analysis.
Results: The results show that, all the HRV parameters are sensitive to WM demands, thus sensitive to stress and are sensitive indicators of different levels of mental stress. The developed GSCWT satisfies the Hans Selye’s GAS model of stress.
Conclusion: The developed GSCWT test significantly differs between the four levels of stress compared to the previously developed Stroop colour test, the feature which makes this test as an efficient tool for conducting laboratory test, which can be used to develop a mental stress level measuring system that can efficiently distinguish between the different stress levels. The test can be conducted even with illiterate subjects as the only requirement of the subject to take up the test is to discriminate colours.
Keywords
Mental stress, HRV, Stress levels, Group stroop colour word test.
Introduction
In medicine and psychophysiology applications, stress quantification is important. As stress levels cannot be measured directly, stress inducer is used to generate stressful events corresponding to three levels of stress, that is, low, medium, high and relate their response to the physiological signals, which has strong correlation with the changes in the emotional behaviour. Though in literature many other stress inducement stimuli like mental arithmetic tasks, cold pressure test, public speaking, Stroop colour test are available, Stroop colour test are widely used as it can induce stress in very short time within laboratory environment [1]. In this work, Stroop colour test is modified and an efficient GSCWT is developed which can induce distinct four levels of stress, which models GAS.
Mental stress is caused by an imbalance between external demands and an individual's ability to meet them [2]. High workload, family circumstances, poor relationship etc. are some of the causes of stress [3]. Although stress has a psychological origin, it affects several physiological processes in the human body like increased muscle tension in the neck, change in concentration of several hormones and a change in heart rate (HR) and heart rate variability (HRV) [4]. The mental stress influences physiological functions like blood pressure, heart rate, catecholamine and cortisol secretions [5]. Excess mental stress causes physiological problems like muscle aches, heart disease, obesity, arthritis or psychological problems like memory loss, depression, difficult to focus, etc. The jobs, with high demand, long working hours, monotonous work and low social support, increases the mental stress [6].
Scientist Hans Selye developed General Adaptation Syndrome (GAS) model which consists of three elements of stress. In the first phase of alarm stage, body activates the fight or flight response system and releases stress hormones, cortisol, adrenaline, and noradrenaline, to provide instant energy. If stressful condition still persists, body moves to ‘Eustress’ phase where the body takes effort to resist and remain in a state of arousal [7]. If stressful condition still exists then the body’s ability to resist is lost and becomes exhausted, the state defined as ‘Distress’ [8]
Literature survey
The Stroop Effect demonstrates the interference in the reaction time of a task. When a word blue, green, red, etc. is printed in a colour different from its actual colour, a delay occurs in the processing of the word's colour, leading to slower test reaction times and an increase in mistakes. This effect is called Stroop effect. The Stroop colour test is used to study the human psycho-physiological responses to mental stress. According to Renaud and Blondin this tool is used for various cognitiveperceptual processes [9]. According to Williams et al. it is a colour naming task, and is a typical pattern in neurophysiological assessments of mental fitness [10]. Salahuddin et al. found that the analysis of HRV describes the activity of the autonomic nervous system which is indirectly related to mental stress [11]. Stress induces changes in autonomic responses of Sympathetic Nervous System (SNS) and Parasympathetic Nervous System (PSNS), which is related to changes in HRV [12]. According to Patrice et al, stroop performance was accompanied by heightened HR levels during the performance of a stroop task [9]. According to Langewitz et al. mental stress induced due to the inability to cope with high demands is closely associated with ANS, exhibiting a strong interrelationship with HRV [13]. There is a considerable decrease in mean R-R due to mental stress [14]. Stroop test is found to activate all the components of SNS and is well suitable as a mental stressor [15,16]. P. Karthikeyan et al. has done a detail literature survey of previous stroop colour test developed [1]. The stroop colour test was used as a stressor for the subject [17]. The test was developed by Stroop using cards. The stroop colour test is also designed using computer and the response is calculated [18]. In [19] computerized stroop test is used and HRV is analysed for two states, that is no stress and stress state. The GSCWT is developed with the objective to improve the existing test in such a way the test is efficient to include four levels compared to most of the previous stroop test, which is two level, ‘stress’ and ‘no stress’. The test can be performed with almost all categories of subjects as the test includes only identification of colours and not spell the name of the colours. All the time domain and frequency domain parameters differ significantly between each stress levels, which indicates that stress induced at different levels vary significantly, which is an essential feature to develop an efficient mental stress level measuring system that can identify the stress levels of an individual with significantly less errors.
Design of GSCWT
In this work GSCWT is designed for three mental states, that is, low, medium and high. The test is designed in such a way, that it consists of source screen and destination screen. In the source screen, one colour word, which is referred as the stimulus word is displayed on the subject’s computer screen. The colour name is displayed in a colour that is same (Congruent) as or different (Incongruent) from the displayed word. The destination screen displays 12 words which is a combination of 6 colours out of which one word will have the same colour as the source word colour. The subject should aim in selecting an answer from the given list corresponding to the colour of the source word. If word RED is displayed in RED colour (Congruent) in source screen then the subject should select the word from the destination list which consists of RED colour. If a GREEN word is displayed in BLUE colour, the subject had to select the word in BLUE colour from the answer list. The GSCWT is designed with six colours, RED, BLUE, GREEN YELLOW, PINK and CYAN. GSCWT is designed based on the principle observed by stroop that it takes more time to read incongruent word than congruent word [20,21].
The test is designed with two level of interference. First one is congruent and incongruent interference combination between source and destination screen, which is combined in 6 different ways and forms stage (1-6). The second interference is the sequence in which the stages are displayed to the subject. For low interference, the stages (1-6) are displayed in sequence, thus forming 6 complex groups - Low CGL (1-6). For medium interference, the stages (1-6) are shuffled by following a pattern, thus forming 6 complex groups - Medium CGM (1-6). For high interference, the stages (1-6) are randomly displayed to the subject thus forming 6 complex groups - High CGH (1-6).
The first interference is formed by developing 6 stages. In Stage 1 (ST1), the Source word is displayed in the colour to which it refers, while the corresponding word in the Destination list is displayed in the White colour. This is called as “Congruent-White” (Figure 1). Stage 2 (ST2) is designed with the Source word displayed in a colour different from the one to which it refers, and the corresponding word in the Destination list is displayed in the White colour. This is called as “Incongruent-White”. Similarly 6 stages are designed and the colour of the source and destination words for the 6 stages is tabulated in the Table 1. The source and destination screen of stage 1 and stage 4 are shown in Figure 1 and Figure 2. The second interference is developed by forming low, medium and high sectors which consists of 6 Complex Groups (CG) separately for Low (CGL 1-6), Medium (CGM 1-6) and High Interference (CGH 1-6). The ordered display of stroop stages causes low complexity levels whereas the increased randomness in the display of stroop stages causes the complexity level to be increased [20,21]. Each CG consists of 6 Stages (ST), sequenced in such a way to create low, medium and high difficulty levels. The design of CG is tabulated in Table 2.

Figure 1: Stroop Colour Test - Stage 1 (ST1): The Source word BLUE is displayed in the blue colour, and the word BLUE in destination list is displayed in white colour. “Congruent-White”.

Figure 2: Stroop Colour Test - Stage 4 (ST4): The Source word RED is displayed in pink colour, and in the destination list the word PINK is displayed in pink colour. This is referred to as “Incongruent- Congruent”.
| Stage (ST) | Source word - colour name and colour of the word | Destination word - colour name and colour of the word | Stage name |
|---|---|---|---|
| ST1 | Congruent | White | Congruent White |
| ST2 | Incongruent | White | Incongruent White |
| ST3 | Congruent | Congruent | Congruent Congruent |
| ST4 | Incongruent | Congruent | Incongruent Congruent |
| ST5 | Congruent | Incongruent | Congruent Incongruent |
| ST6 | Incongruent | Incongruent | Incongruent Incongruent |
Table 1. Stages (ST1-6): Interference developed due to the congruent and incongruent combinations of source screen and destination screen colour name and colour of the word.
| COMPLEX GROUP | DESIGN FOR LOW INTERFERENCE STROOP SECTOR (L) | DESIGN FOR MEDIUM INTERFERENCE STROOP SECTOR (M) | DESIGN FOR HIGH INTERFERENCE STROOP SECTOR (H) | |||||||||||||||
|---|---|---|---|---|---|---|---|---|---|---|---|---|---|---|---|---|---|---|
| CG1 | ST 1 |
ST 2 |
ST 3 |
ST 4 |
ST 5 |
ST 6 |
ST 1 |
ST 2 |
ST 3 |
ST 4 |
ST 5 |
ST 6 |
ST 1 |
ST 3 |
ST 5 |
ST 2 | ST 6 | ST 4 |
| CG2 | ST 2 |
ST 3 |
ST 4 |
ST 5 |
ST 6 |
ST 1 |
ST 1 |
ST 2 |
ST 3 |
ST 6 |
ST 5 |
ST 4 |
ST 2 |
ST 5 |
ST 1 |
ST 3 | ST 4 | ST 6 |
| CG3 | ST 3 |
ST 4 |
ST 5 |
ST 6 |
ST 1 |
ST 2 |
ST 3 |
ST 2 |
ST 1 |
ST 4 |
ST 5 |
ST 6 |
ST 3 |
ST 1 |
ST 4 |
ST 6 | ST 2 | ST 5 |
| CG4 | ST 4 |
ST 5 |
ST 6 |
ST 1 |
ST 2 |
ST 3 |
ST 6 |
ST 5 |
ST 4 |
ST 3 |
ST 2 |
ST 1 |
ST 4 |
ST 6 |
ST 3 |
ST 1 | ST 5 | ST 2 |
| CG5 | ST 5 |
ST 6 |
ST 1 |
ST 2 |
ST 3 |
ST 4 |
ST 6 |
ST 5 |
ST 4 |
ST 1 |
ST 2 |
ST 3 |
ST 5 |
ST 2 |
ST 6 |
ST 4 | ST 1 | ST 3 |
| CG6 | ST 6 |
ST 1 |
ST 2 |
ST 3 |
ST 4 |
ST 5 |
ST 4 |
ST 5 |
ST 6 |
ST 3 |
ST 2 |
ST 1 |
ST 6 |
ST 4 |
ST 2 |
ST 5 | ST 3 | ST 1 |
Table 2. Complex Group (CG) : Low, Medium, High : Interference developed due to the sequence of stage screens displayed to the subject.
The subject is presented with the stimulus word for duration of 1 second. The stimulus word is followed by the response screen, which is displayed for 3 seconds during which the subject should click on the answer from the options. The time interval of 0.5 second is kept between the two tasks. Thus to complete one stage (ST) a total of 4.5 seconds is required. Each ST is presented twice to the subject, thus the total time taken to complete the low interference stroop sector is approximately 5 minutes. ECG is recorded during the 5 minutes when stroop test is performed. Similarly, for medium interference stroop sector 5 minutes is required and also for high interference stroop sector 5 minutes is required. ECG is recorded during the 5 minutes of medium stroop test and also during 5 minutes of high stroop test period. The baseline measurement (‘No Stress’ sector), ECG is recorded for 5 minutes, and 10 minutes rest period is given between low stress & medium stress and also 10 minutes rest between medium stress & high stress. Thus for one subject the stroop experiment is conducted approximately for 45 minutes. The noisy ECG is removed and HRV analysis is performed using Kubios software.
Materials and Methods
Study protocol
Subjects: Eighty healthy subjects with 40 male and 40 female aged 18-28, volunteered for the study. All the subjects gave written consent prior to participation in the study. The consent form contained all the information about the experiment. The subjects were given Depression Anxiety Stress Scale 21 (DASS 21) [22-24] psychometric stress scale questionnaire to evaluate the stress level of subjects.
Inclusion criteria: Healthy and normal subjects with stress level ‘NIL’ in DASS 21 scale are included for the study.
Exclusion criteria: The subjects who are diagnosed with cardiovascular or psychiatric disorders or under medication which alter their heart rate were excluded from test. The subjects who have colour blindness or dyslexic were also excluded from the test.
Procedure: The stress level was evaluated using DASS 21 tool for 80 subjects and was found NIL for 60 subjects. Thus the GSWCT was performed for 60 subjects. External stimuli, such as room lighting and environmental temperature were kept the same for all the subjects. The subjects were briefed in detail about the experimental procedure. The ECG electrodes were connected for lead II. Then subjects were first asked to sit comfortably and take rest for 10 minutes. Then Blood Pressure is recorded. The subjects were asked to be in a relaxed state with their eyes closed, and lead II ECG was acquired at the rate of 200 samples/second for 5 minutes with the normal breath rate of 12-18/min using Biopac MP36 data acquisition system. Then the subjects were asked to perform the GSWCT for different levels of low stress, medium stress and high stress and ECG lead II is recorded for 5 minutes for each level individually with 10 minutes of rest in-between each levels. The Profile of Mood States (POMS) questionnaire is given to the subjects and they were asked to fill it. POMS is a standard validated psychological test used to assess mood changes over the period of the intervention [25]. Tension (stress) of the subject is assessed by POMS questionnaire. The ECG signals not properly recorded were not considered for further analysis. Thus, a total of 50 subject’s ECG data which were perfect in all the stages of recording were considered for further analysis.
Heart rate variability analysis
The Task Force recommendation for HRV analysis is followed [26]. After exclusion of artefacts RR series was chosen and analysed with Kubios software. The RR series was resampled at 4 Hz, Low Frequency (LF) and High Frequency (HF) spectral powers were determined by integrating the power spectrum between 0.04 and 0.15 Hz and between 0.15 and 0.4 Hz, respectively. The calculations of time domain and frequency domain parameters are summarized in Table 3.
| Variable | Units | Description | Equation |
|---|---|---|---|
| Mean RR | ms | The mean of RR intervals - the distance between subsequent R wave peaks in ECG | 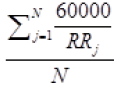 |
| Mean HR | 1/min | The mean heart rate | |
| SDNN | ms | Standard deviation of normal to normal RR intervals. | |
| RMSD | ms | The square root of the mean of the sum of the squares of differences between adjacent NN intervals | 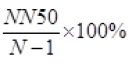 |
| NN50 | Number of pairs of adjacent NN intervals differing by more than 50 ms in the entire recording. | ||
| pNN50 | % | NN50 count divided by the total number of all NN intervals. | |
| RR Triangular Index | Total number of all NN intervals divided by the height of the histogram of all NN intervals measured on a discrete scale with bins of 7·8125 ms (1/128 s). |  |
|
| LF n.u | Normalized unit | Low Frequency 0·04-0·15 Hz power in normalized units | LF/(Total Power-VLF) × 100 |
| HF n.u. | normalized unit | HF 0·15-0·4 Hz power in normalized units | HF/(Total Power-VLF) × 100 |
| LF/HF | Ratio of LF / HF | ||
| pNN50 | % | NN50 count divided by the total number of all NN intervals. | |
| RR Triangular Index | Total number of all NN intervals divided by the height of the histogram of all NN intervals measured on a discrete scale with bins of 7·8125 ms (1/128 s). | ||
| LF n.u | Normalized unit | Low Frequency 0·04-0·15 Hz power in normalized units | LF/(Total Power-VLF) × 100 |
| HF n.u. | normalized unit | HF 0·15-0·4 Hz power in normalized units | HF/(Total Power-VLF) × 100 |
| LF/HF | Ratio of LF/HF |
Table 3. HRV time domain and frequency domain parameters [26].
Time domain analysis: The raw R-R interval time series is used to calculate time-domain parameters. Mean and standard deviation of the R-R intervals is calculated. The mean and standard deviation of the heart rate is also calculated. The NN50 parameter, which represents the number of consecutive R-R intervals differing by more than 50 ms, is also used for analysis. The pNN50 is represented as the percentage of NN50 intervals [26].
Frequency domain analysis: Power spectral density (PSD) of the R-R series is calculated for frequency-domain analysis. The estimation of PSD is based on the Fast Fourier Transform (FFT). The PSD was analysed by calculating the powers and the peak frequencies of different frequency bands. The frequency bands used in this experiment were: very low frequency (VLF, 0-0.04 Hz), low frequency (LF, 0.04-0.15 Hz), and high frequency (HF, 0.15-0.4 Hz). Frequency domain parameters were calculated using normalized values of LF, HF and ratio of LF/HF [26].
Satistical analysis
All the statistical analysis is performed using SPSS -11. The data expressed as mean ± standard deviation. The variation in parameters between the four groups, No Stress (1), Low Stress (2), Medium Stress (3), High Stress (4) (1&2, 1&3, 1&4, 2&3, 2&4, 3&4) were tested using student’s independent t-test and the overall variation between groups (1-4) was determined using one-way ANOVA test. P-value equal to or less than 0.05 values was taken as significant value.
Results
The ECG is recorded using Biopac MP36 for subjects during rest and during the performance of GSCWT. Both time domain and frequency domain HRV parameters were calculated using Kubios software.
Accuracy
The ECG recorded for 60 subjects, in which 6 recordings were not properly recorded. Thus a total of 54 subject’s ECG recordings were considered for all the 4 stages. The subject’s feedback is collected using POMS after performing stroop test and compared with the stroop test classification which is tabulated in Table 4. The results show that there is no deviation in Normal and High stress stage classification. The Low stress and Medium stress stage is misclassified by a total of 4 subjects. Thus total of 50 subject’s ECG recording were considered for further HRV analysis.
| Normal | Low Stress | Medium Stress | High Stress | Total | |
|---|---|---|---|---|---|
| ECG properly recorded | 54 | ||||
| Stroop Test correctly classified by POMS | 54 | 53 | 51 | 54 | 50 |
| % correctly classified | 100 | 98.15 | 94.44 | 100 | 92.59 |
| Accuracy | Correctly classified | 92.59 | |||
| True Positive (a) | correctly identified that stress is present | 158 | |||
| False Negative (b) | incorrectly identified that stress is present | 4 | |||
| False Positive (c) | incorrectly rejected | 0 | |||
| True Negative (d) | correctly rejected that stress is not present | 54 | |||
| Sensitivity | probability that a test result will be positive when the disease is present | a / (a+b) | 97.53 | ||
| Specificity | probability that a test result will be negative when the disease is not present | d / (c+d) | 100 | ||
Table 4. Accuracy, sensitivity and specificity of GSCWT.
HRV parameters
Table 5 summarizes the HRV features for the 4 states, No Stress, Low Stroop Interference (Low Stress), Medium Stroop Interference (Medium Stress), and High Stroop Interference (High Stress). The values shows that for time domain parameters from No Stress to High Stress state the Mean HR value increases and the other time domain parameters Mean RR, SDNN, RMSD, NN50, pNN50 decreases. Table 6 shows the significant p values compared between No stress and Low stress state, No stress and Medium Stress, No Stress and High Stress, Low stress and Medium stress, Low stress and High stress, Medium stress and High stress. Table 7 tabulates the psignificant value between all the groups.
| HRV Features | No Stress (Relax) | Low Stroop Interference | Medium Stroop Interference | High Stroop Interference |
|---|---|---|---|---|
| Mean RR | 741.50 ± 84 | 732.70 ± 68 | 728.45 ± 66 | 713.65 ± 70 |
| Mean HR | 83.15 ± 9 | 85.34± 8 | 87.81 ± 8 | 89.32 ± 8 |
| SDNN | 68.40 ± 38 | 58.36 ± 30 | 56.80 ± 29 | 51.08 ± 13 |
| RMSD | 61.48 ± 50 | 49.78 ± 43 | 43.13 ± 39 | 35.61 ± 17 |
| NN50 | 108.13 ± 82 | 88.73 ± 65 | 78.05 ± 44 | 68.5 ± 41 |
| pNN50 | 27.49 ± 19 | 22.30 ± 15 | 19.41 ± 11 | 17.36 ± 11 |
| LF (n.u.) | 51.69 ± 13 | 60.16 ± 14 | 68.35 ± 13 | 75.34 ± 11 |
| HF (n.u.) | 48.13 ± 13 | 39 ± 14 | 31.49± 13 | 24.57 ± 11 |
| LF/HF | 1.31 ± 0.94 | 1.90 ± 1 | 2.67 ± 1 | 3.80 ± 1 |
RR-The distance between subsequent R wave peaks in ECG, HR-Heart Rate, SDNN-Standard Deviation of normal to normal RR interval, RMSSD-Root Mean Square Standard Deviation, NN50- normal to normal RR interval differing more than 50 ms, pNN50-percentage of NN50, LF-Low Frequency, HF-High Frequency, n.u.-normalized unit
Table 5. HRV features for four mental states.
| Mean RR | STD RR (SDNN) | Mean HR | STD HR | RMSSD | NN50 | pNN 50 | RR tri | Power (n.u.) | LF / HF | ||
|---|---|---|---|---|---|---|---|---|---|---|---|
| LF (0.04-0.15 Hz) | HF (0.15-0.4 Hz) | ||||||||||
| Normal & Low stress | 0.619 | 0.211 | 0.928 | 0.432 | 0.282 | 0.259 | 0.199 | 0.808 | 0.01 | 0.01 | 0.019 |
| Normal & Medium stress | 0.457 | 0.145 | 0.757 | 0.316 | 0.081 | 0.051 | 0.029 | 0.909 | 0 | 0 | 0 |
| Normal & High stress | 0.124 | 0.011 | 0.308 | 0.061 | 0.004 | 0.01 | 0.007 | 0.376 | 0 | 0 | 0 |
| Low stress & Medium stress | 0.784 | 0.82 | 0.813 | 0.78 | 0.484 | 0.409 | 0.357 | 0.879 | 0.012 | 0.012 | 0.01 |
| Low stress & High stress | 0.235 | 0.183 | 0.314 | 0.264 | 0.064 | 0.111 | 0.118 | 0.548 | 0 | 0 | 0 |
| Medium stress & High stress | 0.349 | 0.284 | 0.441 | 0.289 | 0.28 | 0.338 | 0.437 | 0.396 | 0.016 | 0.016 | 0.003 |
RR-The distance between subsequent R wave peaks in ECG, HR-Heart Rate, SDNN-Standard Deviation of normal to normal RR interval, RMSSD-Root Mean Square Standard Deviation, NN50- normal to normal RR interval differing more than 50 ms, pNN50-percentage of NN50, LF-Low Frequency, HF-High Frequency, n.u.-normalized unit, RRtri-RR triangular index
Table 6. HRV features compared between different states based on the p-values calculated using t-test.
| Mean RR | STD RR | Mean HR | STD HR | RMSSD | NN 50 | pNN 50 | RR triangular index | LF (0.04 − 0.15 Hz) | HF(0.15 − 0.4 Hz) | LF/HF | |
| 0.623 | 0.194 | 0.052 | 0.643 | 0.345 | 0.652 | 0.345 | 0.058 | 0.012 | 0.031 | 0.059 | |
RR-The distance between subsequent R wave peaks in ECG, HR-Heart Rate, SDNN-Standard Deviation of normal to normal RR interval, RMSSD-Root Mean Square Standard Deviation, NN50- normal to normal RR interval differing more than 50ms, pNN50-percentage of NN50, LF-Low Frequency, HF-High Frequency, n.u.-normalized unit, RRtri-RR triangular index
Table 7. p - Significant Value - One Way ANOVA between all groups.
Discussion
The values show, that the adjacent states differ in HRV values less significantly compared to the states which are apart. The HRV parameters, SDNN, RMSSD, NN50, pNN50, LF, HF, LF/HF differ significantly between states, thus these are sensitive indicators of mental states (Figure 3). Table 7 shows the one way ANOVA test p - significant values between all groups. It can be observed that STD RR, STD HR, RMSSD, pNN50, LF, HF and LF/HF values differ significantly between states. It can be observed from the results tabulated in Table 5, that there is a significant difference in time domain and frequency domain parameters of HRV. As far as time domain measures are concerned, there is a significant increase in Mean HR from Relax state to High stress state. Similarly, SDNN, estimate of overall HRV showed a significant decrease from Relax state to High stress state. Other time domain measures like Mean RR, RMSSD, NN50, pNN50 showed a significant decrease from Relax state to High Stress State.

Figure 3: HRV analysis comparison between different stress levels.
Among the different Frequency domain measures we considered LF n.u, HF n.u and LF/HF ratio. The power spectral components are compared in the form of normalized units (n.u) because the normalization minimizes the effects of changes in the total power of the values of LF and HF components by excluding the less reliable VLF components from its estimates. In our study The LF n.u value increases from relax state to High Stress state. HF n.u value decreases from Relax state to High Stress state. Thus the LF/HF ratio increases from No Stress state to High Stress state. Earlier studies have shown that the HF component is mainly due to parasympathetic modulation and the LF component is influenced by both sympathetic and parasympathetic systems [27-29]. In our study there was a decrease in HF component from Relax state to High Stress state and there was a significant increase in LF component from relaxed state to High Stress state. This shows that there is an increase in sympathetic outflow when the complexity of GSCWT was increased that is from low stress to high stress state. Mean RR, RMSSD, SDNN, NN50, pNN50 decreases from relax state to High Stress State. Thus there is a shift of sympathovagal balance towards sympathetic limb which is a normal adaptation of an individual to stressful situation.
The anxiety to complete the task increases as the level of complexity increases and this will lead to increase in sympathetic discharge and decrease in parasympathetic tone. This is evident from the results that we have obtained on comparison of HRV parameters of different stress levels to the baseline. Many studies have shown that increase in mental workload increases the stress level which brings about changes in various physiological parameters including HRV [27-29]. Thus, in this work, a combination of congruent, neutral and incongruent segments is used to create a GSCWT, which increases the demands on working memory thus increase the stress level. The heart rate variability (HRV) parameters during high, medium and low working memory (WM) that is the stress level induced during the Stroop task is analysed. Therefore, for the designed GSCWT, it can be said that the task type can be identified based on the frequency and time domain estimates. All the power spectral components followed the expected trend, which healthy people would follow when subjected to stress. Thus all the time domain and frequency parameters are considered as sensitive indicators of mental states. Thus from the result, the designed GSCWT time domain and frequency domain parameters can efficiently distinguish between the four stress levels and also the GSCWT satisfies the GAS model.
Limitations
Short term HRV limits the ability of measurement of time domain analysis accurately. Thus to improve the analysis of HRV parameters during GSCWT sample entropy, wavelet analysis could be included.
Conclusions
The GSCWT is designed using Matlab which mimics real world problem and can induce three stress levels in subjects that can be used as mental stressor to induce stress for laboratory experiments. The GSCWT is validated using traditional questionnaire method. ECG is recorded for the subject at rest and while performing the different levels of stroop test and HRV is calculated using Kubios and standard ttest is used to calculate the statistical significance for different HRV parameters, at Rest, High Stroop Interference, Medium Stroop Interference and Low Stroop Interference. The statistical analysis proves that the developed test correlates with GAS stress model and thus GSCWT is a valid psychological test for laboratory experiments.
Future work
In future, this test can be used as a psychological tool to develop a mental stress level measuring system which can identify four stress levels. Traditionally, mental stress is measured through psychological methods, by conducting interviews or filling questionnaires which are subjective way of evaluation, in which information is collected after the event has occurred and there is possibility of faking the effect. On the other hand, objective methods GSCWT, which provides real time data, can be adopted to develop a stress level measuring system which can efficiently distinguish between four stress levels.
References
- Karthikeyan P, Murugappa M, Yaacob S. “Detection of Human Stress Using Short-term ECG and HRV analysis”. J Mech Medi Biol. 2013; 13: 1350038-1350067
- Frankenhaeuser M, Lundberg U, Augustson H, Nilsson S, Hedman H, Wahlsto MK. "Work, stress, job satisfaction," Swedish Work Environment Fund, Stockholm. 1989.
- Smith MJ, Conway FT, Karsh BT. "Occupational stress in human computer interaction," Industrial Health. 1999; 37: 157-173.
- Taelman J, Vandeput S, Spaepen A, Van Huffel S. “Influence of mental Stress on Heart Rate Variability”, 4th European conference of the international federation for medical and biological engineering . Antwerp, Belgium. 2008; 23-27.
- Krantz G, Forsman M, Lundberg U. "Consistency in physiological stress responses and electromyographic activity during induced stress exposure in women and men," Int Psyc Beh Sci. 2004; 39: 105-118.
- Kain J, Jex S. “Research in Occupational Stress and Well-being". 2010; 237-268.
- Selye H. “The stress of life” second edition, New York, The McGraw Hill companies. 1978.
- Ursin H, Eriksen H. "The cognitive activation theory of stress," Psych neuroendocrinology. 2004; 29: 567-592,
- Renaud P, Blondin JP. "The Stress of Stroop Performance: Physiological and Emotional Responses to Color-Word Interference, Task Pacing, and Pacing Speed," Int J Psycphy. 1997; 27: 87-97.
- Williams JMG, Mathews A, MacLeod C. "The Emotional Stroop Task and Psychopathology," Psychological Bulletin. 1996; 120: 3-24.
- Salahuddin L, Desok K. "Detection of Acute Stress by Heart Rate Variability Using a Prototype Mobile ECG Sensor," Proc. Hybrid Information Technology. International Conference on. 2006; 453-459.
- Critchley HD, Mathias CJ, Josephs O, O‟Doherty J, Zanini S, Dewar BK, Cipolotti L, Shallice T, Dolan RJ. "Human cingulate cortex and autonomic control: converging neuroimaging and clinical evidence," Oxford University Press. 2003.
- Langewitz W, Ruddel H, Schächinger H, Lepper W, Mulder LJ, Veldman JH, van Roon A. "Changes in sympathetic and parasympathetic cardiac activation during mental load: an assessment by spectral analysis of heart rate variability," Homeost Health Dis. 1991; 33: 23-33.
- Taelman J, Vandeput S, Spaepen S, Van Huffel S. "Influence of Mental Stress on Heart Rate and Heart Rate Variability," Proc. IFMBE Proceedings. 2008; 1366-1369.
- Lundberg U. “Stress hormones in health and illness: the roles of work and gender”, Psychoneuroendocrinology. 2005; 30: 1017-1021.
- Grillot M, Fauvel JP, Cottet-Emard JM. “Spectral analysis of stress-induced change in blood pressure and heart rate in normotensive subjects”. J Cardiovas Pharmacol. 1995; 25: 448-452.
- Stroop JR. Studies of interference in serial verbal reactions. Journal of Experimental Psychology. 1935; 18: 643-662.
- Dongrui Wu. “Optimal Arousal Identification and Classification for Affective Computing Using Physiological Signals: Virtual Reality Stroop Task”, IEEE Transactions on Affective Computing”. 2010; 1: 2.
- Priyanka S, Krishnan M, Kabali B, Shanmuga p. “Heart rate variability changes during stroop colour and word test among genders”. Indian J Physiol Pharmacol 2015; 59: 9-15.
- Peter W. “A Stroop Effect for Spatial Orientation”. J Gen Psych. 2007; 134: 285-294.
- Julie MB, Larry LJ, Jeffrey PT. “Multiple Levels of Control in the Stroop Task”. J. Memory and Cognition. 2008; 36: 1484-1494.
- Lovibond SH, Lovibond PF. Manual for the Depression Anxiety Stress Scales second edition Sydney: Psychology Foundation, 1995.
- Lovibond SH, Lovibond PF. Depression Anxiety Stress Scale -21 (DASS-21). 2008.
- Lovibond SH, Lovibond PF. Overview of the DASS and its uses. 2008
- McNair DM, Lorr M, Droppelman LF. EdITS manual: Profile of Mood States, SanDiego, CA: Educational and Industrial Testing Service.1981.
- Task Force of the European Society of Cardiology and the North American Society of Pacing and Electrophysiology. Heart rate variability: standards of measurement, physiological interpretation, and clinical use Circulation. 1996; 93: 1043-1065.
- Mathias CJ, Bannister R. Investigation of autonomic disorders. Autonomic failure a textbook of clinical disorders of the autonomic nervous system. 1999; 4: 169-195.
- Malik M, Camm AJ. Components of heart rate variability: what they really mean and what we really measure. Am J Cardiol. 1993; 72: 821-822.
- Verrier RL, Tan A. Heart rate, autonomic markers, and cardiac mortality. Heart Rhythm 2009; 6: S68- S75.