ISSN: 0970-938X (Print) | 0976-1683 (Electronic)
Biomedical Research
An International Journal of Medical Sciences
Research Article - Biomedical Research (2018) Volume 29, Issue 7
Detection of retinal hemorrhage from fundus images using ANFIS classifier and MRG segmentation
1Computer Science and Information Technology, Maria College of Engineering and Technology, Tamil Nadu, India
2Center for Information Technology and Engineering, Manonmaniam Sundaranar University, Tamil Nadu, India
- *Corresponding Author:
- Godlin Atlas L
Computer Science and Information Technology
Maria College of Engineering and Technology, India
Accepted on February 02, 2018
DOI: 10.4066/biomedicalresearch.29-18-281
Visit for more related articles at Biomedical ResearchDiabetic Retinopathy is a medicinal condition in which the retina is impaired based on fluid breaks from veins into the retina. The occurrence of hemorrhages in the retina is the most prompt effect of diabetic retinopathy. The number and state of hemorrhages are used to display the significance of the disorder. This research paper analyzed hemorrhage detection in retinal fundus images using classifier and segmentation methods. All the database images into the pre-processing steps and some meaning full features are extracted from the images. Then ANFIS classifier utilized to normaland abnormal images, this abnormal category into the hemorrhage detection process with help of segmentation technique. Here Region growing (RG) with threshold optimization techniques are considered its known as Modified RG (MRG) to get the maximum accuracy in the hemorrhage segmenting process. As regards the threshold optimization, Grey Wolf Optimization (GWO) technique used, this proposed work compared to our existing work getting maximum accuracy, sensitivity and specificity performance metrics.
Keywords
Retinal fundus image, Hemorrhage detection, ANFIS classifier, Feature extraction, Segmentation, and Optimization.
Introduction
Retinal images are extensively utilized by ophthalmologists and main care physicians for the screening of epidemic eye diseases, like Diabetic Retinopathy (DR) [1]. Ophthalmologists have long utilized fundus images to measure the health condition of an eye. Colour fundus images give anatomical data about the retina and are more appropriate for automatic analysis schemes. Retinal fundus images apprehended with the help of a fundus camera [2]. DR is the leading ophthalmic pathological reason of blindness before the age of 50 years amongst people of working age in developed countries [3]. Ophthalmologists typically scrutinize the presence of hemorrhages, microaneurysms, and exudates in order to analyze DR. With the help of fluoresce in angiograms; ophthalmologists can perceive hemorrhages and microaneurysms [4]. DR can be approximately categorized as Non-Proliferative Diabetic Retinopathy (NPDR) and Proliferative Diabetic Retinopathy (PDR). Contingent on the prevalence of features on the retina, the phases of DR can be documented [5]. DR is an eye disease in that diabetes distresses the blood vessels present in human retina that becomes one among the foremost sources of vision impairment [6]. The harshness of DR is unwavering by the number and kinds of lesions present on the surface of the retina [7]. The rate of diabetes is increasing, not only in developed countries but in undersized countries too. It is assessed that 75% of people with diabetic retinopathy live in emerging countries [8].
The worldwide occurrence of diabetes is anticipated to rise to 4.4% of the worldwide population by 2030. A real treatment to avert vision loss is accessible, but diabetic retinopathy is asymptomatic until late in the disease procedure [9]. The recognition of Micro Aneurysms (MAs) is indispensable in the procedure of DR grading, as it customs the basis of determining whether an image of a patient’s eye should be measured healthy or not [10]. Microaneurysms are focal dilatations of retinal capillaries and seem as small round dark red dots [11]. Approaches for the recognition of microaneurysms with the help of a watershed transform in fluoresce in angiograms [12]. Fluoresce in angiography (FA) is an imaging method for assessment of retinal vascular disease, predominantly DR. Fluoresce in dye is inserted intravenously and the fluorescence within retinal vessels is then photographed via a matched combination [13]. The blood supply of the retina is principally (65%) through the choroid and secondarily (35%) through the retinal vasculature that lies on top of the retina [14]. Proper and early management of diabetes is cost effective as the insinuations of poor or late treatment are costly [15]. Computer recognition of diabetic retinopathy in digital photographs could offer economic aids to diabetic retinal screening by decreasing the costs of grading and quality assurance [16]. Automatic Optic Disc (OD) detection is utilized to create a retinal coordinate scheme that can be utilized to regulate the position of other retinal abnormalities, like exudates, drusen, and hemorrhages [17]. Computer-Aided Diagnosis (CAD) scheme for the recognition of these lesions can aid ophthalmologists and physicians who assess the mass screening exams in diagnosing DR [18].
Literature Review
In 2015 Prasad et al. [19] had explained is a retinal disease due to high blood sugar. Initial detection is essential to uphold our vision. Small and large retinal hemorrhages can be noticed by feature classification by extracting features from fundus images with the help of filters bank outputs. Image level clarification can be performed with the help of difference of first and second order offshoots of Gaussian filters from green channel result. Lastly, a group of extracted features is designated by filter method and wrapper method. K-Nearest Neighbor (k-NN) classifier is utilized for final feature classification. The final goal of retinal hemorrhage detection by feature classification is to perceive whether the image containing hemorrhages or not.
Retinal images are attained from the fundus camera and classified by skilled professionals were described by In 2015 Jadhav et al. [20]. Though there is a substantial shortage of expert observers has fortified computer-assisted monitoring. Appraisal of blood vessels network shows an important mission in a diversity of medical diagnosis. Appearances of many vascular disorders, like diabetic retinopathy, depend on recognition of the blood vessels network. In the above work, the fundus RGB image is utilized for obtaining the traces of blood vessels and arenas of blood vessels are utilized for recognition of Diabetic Retinopathy (DR). The algorithm developed usages morphological operation to extract blood vessels. Mostly two stages are utilized: primarily enhancement operation is implemented to original retina image to eradicate noise and increase the contrast of retinal blood vessels.
In 2015 Ganesh et al. [21] had projected DR is an aberration of the eye in that the human retina is affected because of an aggregate amount of insulin in the blood. The initial detection and analysis of DR are vital to save the vision of diabetic patients. The initial signs of DR that appear on the surface of the retina are microaneurysms, hemorrhages, and exudates. This article offered an automated screening scheme for DR using Kirsch’s edge detection algorithm. Kirsch template method is utilized for the extraction blood vessels from retinal images. The Kirsch edge detection algorithm uses a single mask of size 3 × 3 and rotates it in 45-degree increases. Meanwhile, the retinal blood vessels can be measured as obligatory foreground data from fundus images, Kirsch algorithm can be effectively implemented.
In 2014, a dynamic threshold based image processing method for the detection of hemorrhages in retinal images were deliberated by Sharma et al. [22]. The algorithm usages the data about color and size of hemorrhages as a tool for classifying hemorrhages from other dark lesions existent in the retinal images. The algorithm uses the concepts of contrast augmentation, background assessment and intensity variation at edges that is gradient magnitude data supported by some morphological operations. The algorithm trails a simple method of the stage by stage elimination of unwanted features from beleaguered images by concepts of threshold and morphology without cooperating with accuracy and time of execution. The experimental solutions designate that hemorrhages are perceived with good accuracy in the retinal images.
In 2013 Tang et al. [23] had projected a new splat feature classification technique is accessible with the implementation of retinal hemorrhage detection in fundus images. Reliable recognition of retinal hemorrhages is significant in the expansion of automated screening schemes that can be translated into practice. Under our supervised method, retinal color images are segregated into no overlapping segments casing the entire image. Each section, i.e., splat, contains pixels with analogous color and spatial location. A group of features is extracted from each splat to designate its features relative to its surroundings, retaining responses from a variability of the filter bank, exchanges with neighboring splats, and shape and texture data. An optimal subset of splat features is designated by a filter method followed by a wrapper method.
In 2012 Jitpakdee et al. [24] had projected the DR is a medical condition in which the retina is scratched due to the fluid leaks from blood vessels into the retina. The availability of hemorrhages in the retina is the original symptom of DR. The number and shape of hemorrhages are utilized to specify the severity of the disease. Early computerized hemorrhage detection can aid decrease the occurrence of blindness. In the above procedure, they review methods, algorithms, and methodologies utilized for the recognition of hemorrhage from diabetic retinopathy retinal images. Automatic recognition of hemorrhage can be confused by other dark areas in the image like the blood vessels, fovea, and microaneurysms.
Motivation for the research
In the existing literature many authors focusing on detection of retinal hemorrhage from fundus images. From that studies some of the techniques are time-dependent, consuming more energy and expensive. In this topic, the raw retinal fundus images are difficult to process by machine learning algorithms. In the study classify the images by the way of pre-processing and feature extraction process. In these processes, transform the raw images into more informative images.
Proposed Methodology
Image processing tools can performance as diagnostic tools for recognition of abnormalities in Fundus retinal images. This novel research work investigation progresses the model for hemorrhage classification and segmentation process. Primarily consider the database images to pre-processing and abstracted some meaning full information’s from all images. The features like GLCM, GLRLM, and SIFT features are deliberated. After feature extraction, the vectors are measured to hemorrhage classification by Adaptive Neuro-fuzzy Interface system (ANFIS). The ANFIS is a Fuzzy Inference System (FIS) applied in the outline of an adaptive fuzzy neural network. The classification is completed in two imperative phases, specifically, the training phase and the testing phase. In the training phase, the classifier is skilled with the extracted features of the training information.
After the classification process, getting the abnormal and normal fundus images, the abnormal images are to the segmentation analysis, our existing work segmentation analysis using threshold optimization process, overcome the draw back and improve the segmentation performance we are using Region growing (RG) with optimization process that is Modified RG (MRG). This MRG procedure select seed point and the threshold value, enhance this threshold with the help of the inspired optimization systems such as GA, Grey Wolf Optimization (GWO) utilized to segment the hemorrhage portion from the image. This novel research work associated with our remaining segmentation method and also assesses numerous measures in classification and segmentation hemorrhage detection procedure. The block diagram of the projected technique is assumed hereunder in Figure 1.

Figure 1: Block diagram for proposed method.
Preprocessing
The adaptive median filter is used to permit the flexibility of the filter to change its size as needs be founded on the estimate of local noise density. The Adaptive median filters on ahead a trans-conductance comparator, in that drenching current, can be attuned to go about as a neighborhood weight administrator. As the measure of the channel is altered in accordance with the neighboring clamor content, this sort of middle channel is called a filter. In this filter, if the image is noisy and the target pixels neighboring pixel value is anywhere around 0's and 255's when we supplant pixel regard with the middle value.

Feature extraction
The feature extraction method comprises the examination of retinal fundus images and for this image feature extraction, the spectral investigation technique is conveyed. By feature extraction what is obscure is the adaptation of the input information into the group of features. The features can extract the given images from their particular specified models. The aim of feature extraction and portrayal alludes to the process of recognizing points in a picture (interest points) that can be utilized to depict the images content, for example, Edges, corners, ridges and blobs [25,26]. In our inspection, the features thought utterly about are
• Gray Level Co-Occurrence Matrix (GLCM)
• Grey Level Run Length Matrix (GLRLM)
• Scale Invariant Feature Transform (SIFT)
Gray level co-occurrence matrix (GLCM): The Gray-Level Co-Occurrence Matrix (GLCM), also known the gray level spatial reliance framework represents a factual technique of reviewing surface that deliberates the spatial relationship of pixels. The GLCM capacities spend the surface of an image by assessing the recurrence of events of the groups of the pixel with right values and in a specific spatial relationship in an image, along these lines manufacturing a GLCM, and therefore blackmailing factual measures from this outline. The Gray level co-occurrence matrix can uncover express qualities about the spatial assumption of the grey levels in the surface image. The preparation of Gray Level Co-Occurring Probabilities (GLCP) is considered underneath:
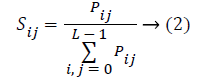
Where Pij represents the frequency of occurrence between two grey levels, L-Number of quantized grey levels, i and j for a given displacement vector for the specified window size.
GLCMs attain more than a few statistics from them retaining the gray co props function. These statistics offer data about the texture of an image [25]. The statistics like Energy, Entropy, Cluster shade, Homogeneity, and Maximum probability are deliberated earlier.
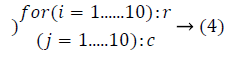
Grey-level run-length matrix (GLRLM): GLRLM is a matrix from which the texture features can be extricated for texture analysis. A texture is comprehended as an example of gray intensity pixel in a specific heading from the reference pixels. The run length is the quantity of the nearby pixels that have the same gray force in a specific direction [26]. Gray level run length matrix is a two-dimensional matrix where every element z(i,j/θ) is the number of elements j with the intensity i in the direction θ. The Gray Level Run Length matrix is developed as takes after:

Where Mg the maximum is gray level, Gmax is the maximum length, and i,j is a matrix size values.
GLRLM attain more than a few statistics from them retaining the grey co-props function. These statistics offer data about the texture of an image. These features are Short Run Emphasis (SRE), Long Run Emphasis (LRE), Gray-Level Nonuniformity (GLN), Run Length Nonuniformity (RLN) and Run Percentage (RP) is assessed.
Scale invariant feature transform (SIFT): The SIFT represents a computer vision technique which effectively extorts the distinct features from an image. It was initially employed for the object identification and subsequently used for the content-based image retrieval. The features extorted by the SIFT are invariant to image scale, rotation, and variable perspectives. This feature extraction process four different is considered to evaluate the vectors.
Classification using ANFIS
Adaptive Neuro-Fuzzy Inference System is the mix of finest sorts of Fuzzy Inference System (FIS) and Artificial Neural Network (ANN). It joints the express data illustration of a FIS and the learning power of the artificial neural network. The aim of the ANFIS is to coordinate the best features of the fuzzy system and the neural networks. ANFIS aid as a principle for building a set of fuzzy if-then rules with appropriate enrollment capacities to give the stipulated input-output pairs. This is a fuzzy inference scheme with a back engendering that tries to diminish the error and augments the execution. The block diagram of ANFIS structural design is assumed in Figure 2.

Figure 2: ANFIS Architecture.
Figure 2 x and y are the crisp inputs. Ai and Bi are the linguistic labels (low, medium, high, etc.) (i=1 or 2) and w is a weight of the ANN procedure. The association of ANFIS is encompassed of five layered feed-forward neural networks is revealed in Figure 2. ANFIS architecture contains five layers of nodes. Out of five layers, the first and the fourth layers obtain adaptive nodes while the second, third and fifth layers obtain fixed nodes. From this ANFIS process classify hemorrhage affected and non-affected images in the database.
Segmentation process
In this segment, we have efficiently ghettoized the hemorrhage image using the mighty Region Growing (RG) method with the optimization way that is MRG. Parenthetically, the image segmentation represents the task of segmenting a digital image into multiple segments that are a group of pixels based on assured resemblance benchmark such as the color, intensity or texture, with an eye on placing and locating objects and boundaries in an image. The classification of the hemorrhage image is nominated as the input to the segmentation procedure in order to extort the hemorrhage part of the image that is unveiled in Figure 3.

Figure 3: Block diagram for Segmentation procedure.
Region growing (RG) with threshold optimization
In the normal region growing technique, when the intensity constraint is scrutinized by the neighboring pixels, some drawback arises in the normal region growing method as the shading in the real images cannot be distinguished and also the chance for noise to occur in the intensity value may result in over-segmentation. The optimal threshold value is predicted for the better segmentation and this will increase the accuracy of the segmented image optimization techniques that are utilized. This optimal threshold process Grey wolf optimization (GWO) is used to improve the accuracy thereby leading to the optimization of the MRG method comprising four steps as follows.
• Gridding
• Seed point selection
• Finding optimal threshold value
• Applying region growing to the seed point
Gridding: Primarily, the image is alienated into numerous blocks (bs), and as it bears a resemblance to implementing a grid on the image, this procedure is recognized as gridding. The gridding is performed to assign each spot with individual sections.
Seed point selection: In this procedure, the histogram equalization is engaged to usher in the seed point. In the aspect of the fact that the histogram method is utilized for every pixel in the block, the value of the pixel lies within 0 and 255, and the most frequently happening pixel value is assigned to be the seed point. In the case of each and every image, the blocks are ghettoized and the seed point is fixed.

Finding optimal threshold value: This process is carried out to attain the segmented image, and for the purpose, the optimization technique is applied. In the threshold optimization the maximum accuracy is obtained in the Grey Wolf Optimization (GWO) compared to a couple of techniques. This optimization technique block diagram is shown in Figure 4.

Figure 4: Flow diagram for GWO.
The grey wolves efficiently form a portion of the Canidae family and are believed as the apex predators representing their position at the pinnacle of the food chain. They routinely exhibit a tendency to survive as a group. The heads constitute a male and a female, considered as an alpha that is usually responsible for taking appropriate decisions regarding numerous factors like the hunting, sleeping place, time to wake, and the like. The decisions made by the alpha are transported to the group. The Beta signifies the second rank in the hierarchy of the grey wolves. They are, in the core, secondary wolves that efficiently bid a helping hand to the alpha in the decision-making or alike group performances. The omega that is at the deepest strata of the grey wolf pack, usual performances as a scapegoat giving in to the other leading wolves almost on every occasion and are permitted to have only the small leftovers subsequent a grand feast using the leader wolves. A wolf is considered as subordinate or as delta infrequently if it does not belong to the set of an alpha, beta, or omega. Though these delta wolves have to produce to the alphas and betas, they, though, have a real dominance over the omegas. In our technique, the alpha (α) is considered as the most suitable result with an aspect to copying systematically the social hierarchy of wolves though inventing the GWO. As a solution, the second and the third best results are categorized as beta (ß) and delta (δ) correspondingly. The remaining candidate results are considered to be the omega (ω). In the GWO method, the hunting (optimization) is guided using the, and ω.
Initialization process
In the region growing process, we choose the seed point and the threshold to segment the image. Initially, the image is arranged as a formation of blocks and split based on the fixed threshold value. Here we initialize the threshold Ti and certain algorithm parameters a, A and C are coefficient vectors.
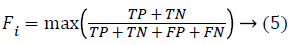
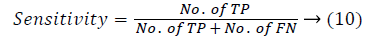
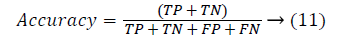
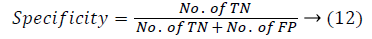
Fitness evaluation
In each block of the image we proceed to locate the fitness Fi in a segmented part and here the fitness is the maximum accuracy of the segmented part. The accuracy is found using the parameters such as True Positive (TP), True Negative (TN), False Positive (FP) and False Negative (FN).
Separate the solution based on the fitness: Now, we find the separate solution (threshold) based on the fitness value. Let the first best fitness solutions be α, the second best fitness solutions ß and the third best fitness solutions δ.
Update the position: We assume that the alpha (best candidate solution), beta and delta have the improved knowledge about the potential location of the prey in order to reproduce mathematically the hunting behavior of the grey wolves. As a result, we hoard the first three best solutions attained so far and require the other search agents (including the omegas) to revise their positions according to the position of the best search agent. For repetition, the new solution T(t+1) is estimated by using the formulae mentioned below.


To have hyper-spheres with different random radii, the arbitrary parameters A and C help the candidate solutions. Investigation and utilization are guaranteed by the adaptive values of A and a. These adaptive values permit the GWO to transit them smoothly along with the analysis and the utilization. With lessening A, half of the iterations are committed to the investigation (|A|<1) and the other half is devoted to the utilization. Encircling the behavior, the succeeding equations are engaged in order to offer a mathematical model.
The coefficient vectors are found by the equation (28)
Where t indicates the current iteration, A and C are coefficient vectors, Tp is the position vector of the prey T and indicates the position vector of a grey wolf. The components of a are linearly decreased from 2 to 0 over the course of iterations and r1,r2 are random vectors in [0, 1].
The GWO has only two foremost parameters (A and C) to be adjusted. Though, we have kept the GWO algorithm as simple as imaginable with the fewest operators to be accustomed. The procedure will be sustained until the maximum accuracy is attained.
Applying region growing to the seed point: The last procedure is the region growing procedure, wherein the value that is achieved from the optimal threshold computation procedure leads to an accurate extorted hemorrhage part of the image.
Result and Discussion
The projected hemorrhage detection procedure experiments in the working platform of MATLAB 2015a with the system configurations as ani5 processor with 4GB RAM and the assessment is done in respect of the classification and also the segmentation. Subsequently, in the segmentation, the performance evaluation is carried out in terms of sensitivity, specificity, accuracy and some performance parameters. These proposed work results are compared to existing work results to prove new research work is better.
Database description
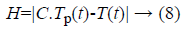
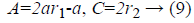
Retinal fundus images are the interior surface of the eye stipulate opposite portion of the lens includes retina, optic disc, macula, fovea and posterior pole. These images should examine and confirmed by ophthalmoscopy. Fundus images are composed of Messidor (Methods to assess segmentation and indexing method in the field of diabetic retinopathy) data set. In this database has more than 50 images; from that 80% are used for training and 20% are used for testing purpose. It is one amongst the publically available dataset comprises the images in the form of uncompressed tagged image file format with 1450 × 1960 pixel resolution that is about 3.8MB/image, its collected fromthe web (Figure 5).

Figure 5: Sample database images.
Experimental results of classification process
In this section, we present the experimental solution of classification procedure on the hemorrhage detection in retinal fundus images in ANFIS classifier. The projected technique can best categorize with normal and abnormal images the performance metrics accuracy, sensitivity, and specificity shown in below table.
The classification process in hemorrhage detection in the numerous test images by ANFIS process is exemplified in Table 1 and Figure 6. In classification procedure, four testing images are taken to produce the accuracy of 0.91 % in first confirmation technique, and then it’s associated with other validation where the variance is 0.93%. In the second validation procedure, 0.92% maximum accuracy fashioned in ANFIS classifier associated with other validation. The other metrics sensitivity and specificity also getting better results in hemorrhage detection procedure.
| Validations | Images | Accuracy |
|---|---|---|
| Validation 1 |  |
0.90 |
| Validation 2 |  |
0.92 |
| Validation 3 | 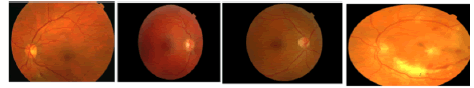 |
0.89 |
Table 1. Results for classification process.

Figure 6: Results analysis.
Segmentation performance
In the segmentation process, the hemorrhage part is segmented by the proposed technique ‘Modified Region Growing (MRG) process. This MRG process GWO technique used in the threshold optimizing the process. Here analyzed the parameters such as sensitivity, specificity, accuracy, NPV, PPV, FPR and FDR are considered. This evaluation based on the TP, TN, FP, and FN values based.
True positive (TP): Hemorrhage part correctly marked as haemorrhage
True Negative (TN): Normal area correctly unmarked as haemorrhage
False positive (FP): Normal area wrongly marked as haemorrhage
False Negative (FN): Hemorrhage area wrongly unmarked as haemorrhage
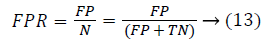
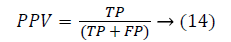
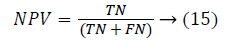
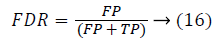
Tables 2 and 3 display segmented hemorrhage retinal fundus images with numerous statistical performance measures for projected MRG and RG. The maximum sensitivity attained is 0.91 (for image 1) when testing the four test images. For image 2, these disclosures the better performance of the projected method associated with the other methods. All the performance valuation parameters retain best values in GWO when they come in comparison with the other two procedures. Regarding the specificity measure, if the images numbered 3 and 4 are taken as samples, the value thus attained by GWO is 0.80% whereas the value attained with the help of the other two methods is 98%. When this technique (MRG-GWO) comes in assessment with the RG for Table 3 the positive predictive and negative predictive values show better performance as 0.69 and 0.99 when all the images are measured. Moreover, the false positive and false discovery rates accomplished in GWO technique are of minimum values. Henceforth, overall, the recommended technique has specified the accuracy of 0.92% associated with the other methods.
| Sl.no | Original image | Segmented part | Ground truth | Sensitivity | Specificity | accuracy | PPV | NPV | FPR | FDR |
|---|---|---|---|---|---|---|---|---|---|---|
| 1 |  |
 |
 |
0.91 | 1 | 1 | 0.79 | 1 | 0 | 0.21 |
| 2 |  |
 |
 |
0.82 | 1 | 1 | 0.80 | 1 | 0 | 0.20 |
| 3 |  |
 |
 |
0.92 | 1 | 1 | 0.91 | 1 | 0 | 0.09 |
| 4 |  |
 |
 |
0.80 | 1 | 1 | 0.79 | 1 | 0 | 0.2.1 |
Table 2. Proposed (MRG) Segmentation results (RG-GWO).
| Sl. no | Original image | Segmented part | Sensitivity | Specificity | Accuracy | PPV | NPV | FPR | FDR |
|---|---|---|---|---|---|---|---|---|---|
| 1 |  |
 |
1 | 0.31 | 0.31 | 0 | 1 | 0.69 | 1 |
| 2 |  |
 |
1 | 0.26 | 0.27 | 0.01 | 1 | 0.74 | 0.99 |
| 3 |  |
 |
0.70 | 1 | 1 | 0.34 | 1 | 0 | 0.66 |
| 4 |  |
 |
0.00 | 0.95 | 0.94 | 0.00 | 1 | 0.05 | 1 |
Table 3. Segmentation results for RG.
On a close scrutiny of the plotted graph, it is evident that the performance of the innovative method (RG-GWO) has incredibly enhanced the hemorrhage detection when compared with the Region Growing and existing threshold optimization process. The analysis graphs in terms of the sensitivity, specificity, and accuracy are effectively exhibited in the figure appearing below.
Figure 7 gracefully displays the comparison graph for the Modified region growing in GWO optimization procedure and RG then our first paper is associated. The sensitivity of the GWO in relation to the other methods illustrates divergences of 0.85% and 0.24% correspondingly. The specificity of the GWO amounts to a whopping 99.39% when it comes in contrast with the other two methods viewing a tiny variation of 0.85%. Similarly, the accuracy of the MRG with GWO being 99.05%, the higher accuracy level has soundly displayed without any iota of doubt that the innovative method graph is exemplary and best suggested in locating the hemorrhage detection fundus image.

Figure 7: Comparative analysis.
The typical Figure 8 beautifully exemplifies one set of input images and features of the process. The new method is achieved in the MATLAB platform designated in the related graph. The hemorrhage detection process efficiently hires the graphical user interface (GUI) model that establishes a classification and segmentation performance metrics.

Figure 8: GUI.
Conclusion
Eye vision shows vigorous role in our senses. Image mining is cooperative to the diagnosis of diseases. In this work, one of the eye disorder Diabetic Retinopathy is absorbed. Many of the hemorrhage splat overlaps with the blood vessels and results in misclassification. Splat based image representation makes it easier for clinicians to annotate the boundaries of target objects that may lower the cost of attaining reference standard information for training. From our research work accuracy classified hemorrhage affected and non-affected image and with exact segmentation procedure is examined. This novel segmentation process attained 92.56% accuracy in the region growing with GWO technique associated with existing procedure. The accuracy level has clearly demonstrated that the projected algorithm is decidedly efficient in perceiving the affected portions of the retinal image.
It is, consequently, that the projected technique made alive will set up a high attraction next to bringing in yet another milestone in the field of biomedical engineering and in the history of humanism and mankind too!
References
- Sánchez C, Garcia M, Mayo A, López M, Hornero R. Retinal image analysis based on mixture models to detect hard exudates. J Med Image Anal 2009; 13: 650-658.
- Guven A. Automatic detection of age-related macular degeneration pathologies in retinal fundus images. J Comput Methods Biomech Biomed Eng 2013; 16: 425-434.
- Marin D, Aquino A, Gegúndez-Arias ME, Bravo JM. A new supervised method for blood vessel segmentation in retinal images by using gray-level and moment invariants-based features. J Med Imaging 2011.
- Mizutani A, Muramatsu C, Hatanaka Y, Suemori S, Hara T, Fujita H. Automated microaneurysm detection method based on thedouble-ring filter in retinal fundus images. J Med Imaging 2009; 7260: 1-8.
- Acharya UR,Lim CM,Ng EY,Chee C,Tamura T. Computer-based detection of diabetes retinopathy stages using digital fundus images. J Eng Med 2009; 223: 1-10.
- Akrama U, Khalid S, Khan S. Identification and classification of microaneurysms for early detection of diabetic retinopathy. J Pattern Recognit 2013; 46: 107-116.
- Akrama U, Khalid S, Tariq A, Khan S, Azam F. Detection and classification of retinal lesions for grading of diabetic retinopathy. J Comput Biol Med 2014; 45: 161-171.
- Faust O, Acharya R, Hoong K, Suri J. Algorithms for the automated detection of diabetic retinopathy using digital fundus images: A review. J Med Syst 2012; 36: 145-157.
- Sopharak A, Uyyanonvara B, Barman S. Automatic microaneurysm detection from non-dilated diabetic retinopathy retinal images using mathematical morphology methods. J Comput Sci 2011; 38: 1-7.
- Lazar I, Hajdu A. Retinal micro aneurysm detection through local rotating cross-section profile analysis. J Med Imaging 2013; 38: 1-8.
- Sopharak A, Uyyanonvara B, Barman S, Williamson T. Automatic detection of diabetic retinopathy exudates from non-dilated retinal images using mathematical morphology methods. J Comput Med Imaging Graphics 2008; 32: 720-727.
- Hatanaka Y, Nakagawa T, Hayashi Y, Hara T, Fujita H. Improvement of automated detection method of hemorrhages in fundus Images. J Med Imaging 2008; 978: 5429-5432.
- Zhang B, Wu X, You J, Li Q, Karray F. Detection of microaneurysms using multi-scale correlation coefficients. J Pattern Recognit 2010; 43: 2237-2248.
- Abràmoff M, Garvin M, Sonka M. Retinal imaging and image analysis. J Biomed Eng 2010; 3: 169-208.
- Kauppi T, Kalesnykiene V, Kamarainen JK, Lensu L, Sorri I, Raninen A, Voutilainen R, Uusitalo H, Kalviainen H, Pietila J. DIARETDB1 diabetic retinopathy database and evaluation protocol. J Med Imaging 2007; 3: 1-18.
- Fleming A, Goatman KA, Philip S, Williams G, Prescott G, Scotland G, McNamee P, Leese G, Wykes WN, Sharp P, Olson J. The role of haemorrhage and exudate detection in automated grading of diabetic retinopathy. J Clin Sci 2010; 94: 706-711.
- Lu S, Lim HJ. Automatic optic disc detection from retinal images by a line operator. J Biomed Eng 2011; 58: 88-94.
- Mizutani A, Muramatsu C, Hatanaka Y, Suemori S, Hara T, Fujita H. Automated microaneurysm detection method based on double-ring filter in retinal fundus images. J Med Imag 2009; 7260: 1-8.
- Prasad P. Retinal hemorrhage detection using feature classification. J Eng Comput Sci 2015; 4: 10960-10963.
- Jadhav AS, Patil PB. Classification of diabetes retina images using blood vessel area. J Cybernet Informat 2015; 4: 251-257.
- Ganesh S, Basha AM. Automated detection of diabetic retinopathy using retinal optical images. J Sci Technol Manage 2015; 4: 136-144.
- Sharma A, Dutta MK, Singh A, Travieso C. Dynamic thresholding technique for detection of hemorrhages in retinal Images. J Med Imag 2014; 978: 1-4.
- Tang L, Niemeijer M, Reinhardt J, Garvin MK, Abramoff M. Splat feature classification with application to retinal hemorrhage detection in fundus Images. IEEE Transact Med Imag 2013; 32: 364-375.
- Jitpakdee P, Aimmanee P, Uyyanonvara B. A survey on hemorrhage detection in diabetic retinopathy retinal images. 9th International Conference on Electrical Engineering/Electronics, Computer, Telecommunications and Information Technology, Phetchaburi, 2012.
- Mohanaiah P, Sathyanarayana P, Guru Kumar L. Image texture feature extraction using GLCM approach. Int J Sci Res Publicat 2013; 3: 1.
- Ghribi O, Sellami L, Slima MB, Mhiri C, Dammak M, Hamida AB. Multiple sclerosis exploration based on automatic MRI modalities segmentation approach with advanced volumetric evaluations for essential feature extraction. J Biomed Signal Process Control 2018; 40: 473-487.