ISSN: 0970-938X (Print) | 0976-1683 (Electronic)
Biomedical Research
An International Journal of Medical Sciences
Research Article - Biomedical Research (2018) Volume 29, Issue 7
Decision support system based on the support vector machines and the adaptive support vector machines algorithm for solving chest disease diagnosis problems
Amani Yahyaoui1* and Nejat Yumuşak2
1Software Engineering Department, Faculty of Engineering and Natural Sciences, Sabahattin Zaim University, Istanbul, Turkey
2Department of Computer Engineering, Faculty of Computer and Information Sciences, Sakarya University, Turkey
- *Corresponding Author:
- Amani Yahyaoui
Software Engineering Department
Faculty of Engineering and Natural Sciences
Sabahattin Zaim University, Turkey
Accepted date: January 30, 2018
DOI: 10.4066/biomedicalresearch.29-17-3594
Visit for more related articles at Biomedical ResearchSeveral diseases threaten human health by affecting longevity and its well-being in many ways. Among them, chest diseases as Tuberculosis (TB), Chronic Obstructive Pulmonary Disease (COPD), pneumonia, asthma, and lung cancer are considered as serious health complications and one major cause of death in both developing and developed countries. Doctors confirm that the earlier a disease is diagnosed, the higher is the patient cure probability. In this context, expert systems and different artificial intelligence techniques have been successfully used to solve different problems in various domains including medical diagnosis. In this paper, we use the Support Vector Machines (SVM) method to diagnose chest diseases and for the first time, we examine the performance of the Adaptive Support Vector Machine (ASVM) method for chest disease diagnosis. This involves improving the SVM by finding its most appropriate Bias term value. These approaches are evaluated using an experimental dataset from Diyarbakir chest diseases hospital and comparing them with the Neural Network method used in previous studies. The experimental results showed the efficiency of these methods, especially ASVM, which could achieve promising results and confirmed that it, can be efficiently used in chest diseases.
Keywords
Artificial intelligence techniques, Chest diseases, Support vector machine, Adaptive support vector machine
Introduction
Making decisions is usually very difficult and sometimes impossible for some complicated systems: accordingly, researchers are increasingly interested in the use of decision support systems especially in crucial domain including business, engineering, and medicine etc.
Nowadays, decision support systems are among the powerful tools in medicine that help doctors to diagnose diseases and to make decisions. In our paper, we will focus on the use of the decision support systems based on some artificial intelligence techniques in order to help doctors diagnose chest diseases.
The chest is the human body region located between the neck and the abdomen that contains the essential organs including the heart and the lungs. It has crucial roles; in particular, it ensures the proper functioning of the lungs and the protection of vital organs as the heart, the lungs (en.wikipedia.org/wiki/ Thorax). The chest is vulnerable to certain dangerous diseases, including TB, COPD, pneumonia, asthma and lung cancer, etc. [1].
In fact, TB is a dangerous, infectious, contagious and deadly disease that affects the lungs. The World Health Organization (WHO) reported that in 2015, 1.8 million of person died from the TB (www.who.int/mediacentre/factsheets/fs104/en/). This disease mainly affects people who suffer from malnutrition and children with an immunology nuisance, for which, the body immunity is weak. [2-4]. This disease can be identified by certain symptoms such as a cough with sputum and blood, chest pains, weakness, weight loss, fever and night sweats [5,6], (www.who.int/mediacentre/factsheets/fs104/en/).
In addition to TB, COPD is among the dangerous chronic diseases causing an increase in the mortality rates in the recent years [7] and it is estimated that by 2030, the COPD will be the third leading cause of death (www.who.int/mediacentre/factsheets/fs315/en/). This illness is deadly and manifested by a shortness of breath and a severe cough. According to the medical research, smoking, respiratory infections, and air pollution are among the major causes of this disease [7].
In addition to the COPD, pneumonia is among the most dangerous epidemics that affect the chest, since both virus and bacteria [8] can cause it. Pneumonia affects people of all ages in particular children from 2 months to 7 y. In 2015, according to the WHO [9], pneumonia killed about 922,000 children.
This disease can be diagnosed by several symptoms such as coughing, difficulty in breathing, fatigue, low blood pressure, chest pain and temperature that can reach 41°C. Asthma is also considered among the most common noncommunicable lung diseases, which can affect people independently of age. According to the WHO, about 300 million people suffer from asthma worldwide (www.who.int/mediacentre/factsheets/fs307/en/).
This disease is characterized by shortness of breath, chest pain, sleep disorders, cough and wheezing. Some of the causes of this disease are air pollution and tobacco.
Some researchers consider cancer to be the most dangerous disease. It is a rapid and uncontrolled growth of cells that can damage vital organs of the human body as the brain, the liver, the bone (www.who.int/mediacentre/factsheets/fs297/en/).
According to the WHO statistics, Lung cancer is among the most common causes of cancer death that caused 1.59 million cases of death in 2012. (library.iaslc.org/search-speaker? search_speaker=31613). It affects the lungs and usually appears in smokers. Its symptoms appear especially in advanced stages of illness and include cough, coughing up blood, shortness of breath, chest pain, wheezing and losing weight.
Hence, the majority of the diseases previously detailed have explicit symptoms, which help doctors in diagnosing these illnesses. Experts and doctors affirm that the early detection of chest diseases profoundly affects the treatment, can save several lives and increases the patient cure probability.
In this context, in the literature, many techniques have been applied to study and diagnosis the chest diseases, namely Artificial Neural Networks (ANN). In fact, several ANN structures have been used for chest diagnosis, for example, a comparison of ANN structures has been performed in [1] using the same database. In this research, the Multilayer Neural Network (MLNN), the Probabilistic Neural Network (PNN), the Learning Vector Quantization (LVQ) and the Radial Basis Function (RBF) presented similar results. Indeed, the MLNN reported an efficiency of 90% for TB, 88.73% for COPD, 91.67% for Pneumonia, 90.91% for asthma and 93.75% for lung cancer. The PNN reported approximately an efficiency of 88% for TB, 88.73% for COPD, 88.33% for pneumonia, 90.91% for asthma and 93.75% for lung cancer. Furthermore, the LVQ reported an efficiency of 84% for TB, 84.51% for COPD, 86.67% for pneumonia, 86.37% for asthma and 93.75% for lung cancer. Finally, the RBF performed an efficiency of 86% for TB, 87.32% for COPD, 90% for Pneumonia, 88.64% for asthma and 90.63% for lung cancer [1].
Moreover, other research focuses on the use of the Artificial Immune System (AIS) method for chest disease diagnosis [10]. The results obtained using this method are interesting since it achieved an efficiency of 90% for TB, 92.96% for COPD, 93.33% for pneumonia, 90.91% for asthma and 93.75% for lung cancer [10].
In addition to the ANN and the AIS techniques, many researchers were interested in the chest disease diagnosis using the SVM and proved, in several studies that it is a powerful tool for chest disease diagnosis.
In [11], the authors present a comparative study between the SVM performance and other methods for the lung cancer detection such as Boosting, Decision Trees, k-nearest neighbours, LASSO regressions, Neural Networks and Random Forest methods. The Boosting method achieves 88% diagnosis accuracy, whereas the Decision Trees method reports 75% diagnosis accuracy. Moreover, the k-nearest neighbours realises 73% diagnosis accuracy, while the LASSO regressions reports 90% diagnosis accuracy. In addition, this research finds that the Neural Networks accuracy is 89%, while the Random Forests method reports 90% diagnosis accuracy. However, the highest diagnosis accuracy is achieved by SVM, which reaches 93% [11].
In addition, SVM provided good results in diagnosing the breast disease [12]. Indeed, using WISCONSIN breast cancer dataset and compared to two others machine learning classifiers, which are Naive Bayes and RBF, SVM show that it achieves the best performance since it provides the highest diagnosis accuracy with 93.75%, followed by the NB with 71.67% and 70.01% for RBF [12]. SVM gave also good results in diagnosing the Tuberculosis. This was the case in [13] in which the results obtained showed the ability of this method in predicting about 84% of infected people.
Hence, as it has been previously detailed, SVM presents the best results in problems related to chest diseases diagnosis. Based on this, in this paper, we use the SVM to diagnose chest disease. We compare the performance of SVM with previous studies. Then, we employ the ASVM in order to improve the success percentage of SVM.
The present paper is organized as follows: firstly, the chest diagnosis principle using SVM and the ASVM are explained in section 2. The results of the chest diseases diagnosis using SVM and using the ASVM are presented and interpreted in section 3. Finally, conclusions are presented.
Methods
In this section, a comparative study between the SVM and the ASVM is performed to diagnose chest diseases.
Support vector machines
SVM is one machine learning technique for solving discrimination and regression problems, which was first introduced by Cortes and Vapnik in 1990 for binary data classification [14-19]. Today, it is used in several research areas such as face recognition [20], speaker recognition [21], medical diagnosis [22], etc.
In fact, as shown in Figure 1, SVM consists in constructing the maximum margin hyperplane that optimally separates two classes of a datasets D=where and the class label of . However, many hyperplanes can separate the two classes. Thus, SVM uses a training phase to find the optimal hyperplane called Optimal Separating Hyperplane (OSH) which fulfils, where w is an m-dimensional vector and b is a “Bias” term that separates two classes and maximizes the margin between two classes [21].

Figure 1: SVM basic idea for linear case [23].
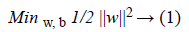
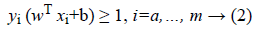
Hence, following Figure 1 the optimal hyperplane H verifies that the hyperplanes H1 and H2 are parallel through it and pass through the closest points to H which are called Support Vectors (SVs) [21]. Thus, SVMs choose the optimal hyperplane that maximizes the margin between the two classes which is the distance between H1 and H2. The hyperplane with the largest margin is defined by 2/||w||. Mathematically, this optimal hyperplane with a maximum margin can be found by minimizing Equation 1 under the constraint of Equation 2 using Quadratic Programming (QP) optimization problem as it is explained as follows [23].
The above problem is solved by using the method of Lagrangian multipliers expressed in Equation 3 as follows.
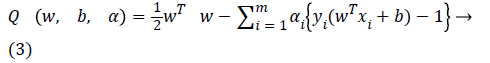
Where αi are the multiplier of Lagrange. The optimum of objective function Q is obtained by minimizing it with respect to w and b and by maximizing Q with respect to αi using Equation 4.
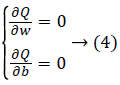
Using Equation 4 we deduce:
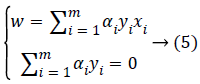
Hence, substituting Equations 4 and 5 in Equation 3, the following dual problem to maximize is obtained.
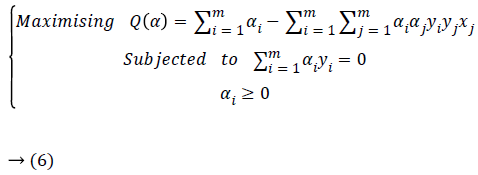
Where the examples x having Lagrange coefficients are αi ≠ 0 called support vectors.
The problem of classifying a new data x is solved then by the following decision function given by Equation 7.
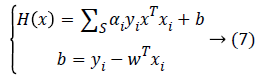
Thus, the class decision can be made as follows:
- If H (x)>0 then x ε +1
- If H (x)<0 then x ε -1
- If H (x)=0 then x is not classifiable
Since the data is not linearly separable as the case in Figure 2, the idea is to map the non-linear space in a new linear higherdimensional space, where the training set is linearly separable by a kernel function expressed as follows in Equation 8.

Figure 2: SVM concept for non-linear case [23].
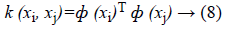
Indeed, this transformation space is performed using a “mapping function” F=(ф (x)|x ε X}which is implicitly defined by the choice of SVM kernel. The new space is called "Features space"(Figure 3) [23].

Figure 3: Mapping space concept [23].
Many kernel functions have been used when applying SVM. Among the most popular functions, we shall mention linear, polynomial, RBF, sigmoid kernels [23].
Chest disease diagnosis using SVM
The choice of SVM’s kernel is still an unsolved problem and presents a limitation of SVM’s performance. Generally, to choose the right kernel, researchers have to perform tests. Here, in our study, the standard linear kernel was used, the other kernel functions will be tested and performed in our follow-up work. The SVM structure used in our study is shown in Figure 4. Hence, the data will be first divided into two groups of train and test using the cross-validation as a data partitioning method. The cross-validation method used is the hold-out method; it consists of dividing the data into two samples: the first is for training and the second is for the test. The model is built on the training sample and validated on the test sample. Thus, during the classification task, SVM begins by training the train data given with their classes’ variables, to construct the reference model. The test data are then classified by predicting their classes based on the model already obtained. As a consequence, patients with class values “1” belongs to the person affected by TB, while patients with class values “2” belongs to the person affected by COPD. Moreover, class values “3” belongs to the patients affected by Pneumonia, while class values “4” belongs to the patients affected by Asthma. In addition, patients with class values “5” belongs to the person affected by Lung cancer, while patients with class values “6” belongs to healthy people.

Figure 4: Chest disease diagnosis system using SVM.
Chest disease diagnosis using ASVM
As it has previously been explained in the previous section, SVM includes a rectified term called “Bias” b through the optimal hyperplane equation f (x)=wTx+b. In order to acquire the highest success rate in diagnosing diseases, the ASVM is studied here. In fact, the ASVM idea consists of applying an algorithm which finds the most appropriate Bias value ‘b’ of SVM [24]. Using the minimum and maximum values of Bias bmin and bmax, the minimum and maximum number of fragmentations Smin and Smax of Bias space given by the researcher, the algorithm idea consists in splitting the Bias space values into equal fragments, testing the different Bias values from each fragment and keeping the most appropriate fragments that give the highest success rate in diagnosing diseases. The ASVM algorithm [24] consists of:
Begin
Set D=((x1, y1)..... (xn, yn)) x ε Rn, and yi ε (-1, 1).
Set bmin, bmax (minimum and maximum values of Bias parameters), Smin, Smax (minimum and maximum number of separators), Δmin (minimum difference between bmin and bmax).
While bmax-bmin>Δmin and Smin<Smax Repeat
In the (bmin, bmax) interval, determine Smin-2 points with equal distances.
Train the SVM model with the train data: model=svmtrain (D (x), y......)
Test the system with the different Smin-2 Bias values.
Select the two highest correct classification rate R1, R2.
If R1 and R2 are given by bmin or bmax then
Smin=Smin+1
Else
Assign bmin to the Bias that gave the second highest correct classification rate R2.
Assign bmax to the Bias that gave the second highest correct classification rate R1.
End if
End while
Assign the Bias with the highest classification rate as the ideal Bias value.
End
Hence, the ASVM main idea is to find the ideal Bias value that will be used to carry out the classification process after the training phase. The ASVM structure used in our study is shown in Figure 5.

Figure 5: Chest disease diagnosis system using ASVM.
Results and Discussion
Description of the case study
In this paper, as a system performance evaluating method, we used the classification accuracy which is obtained by dividing the correct classified instances by the total number of instances [1]. Hence, our tests have been performed by “MATLAB R2008a”, using a set of data taken from Diyarbakir Chest Diseases Hospital (Southeast Turkey) [1]. In fact, the data set contains six classes and 357 samples distributed as follows:
Class 1: TB (50). Class 2: COPD (71). Class 3: Pneumonia (60). Class 4: Asthma (44). Class 5: Lung Cancer (32). Class 6: Normal (100).
The dataset contains 38 features [1], for some features, two indices are given which are the min value that can be accepted by the system for uninfected patient and the max value that can be accepted by the system for uninfected patient; for example, as mentioned in Table 1, the value of the Glucose in a patient body must be between 70 as min value and 110 as max value to be considerate as uninfected patient. For some other features, the standard values can be 1, that means the existence of the feature and 0, that means the nonexistence of the feature. For example, if the patient has chest pain the standard value will be 1 otherwise 0, if the patient is smoking, the standard value will be 1 otherwise 0.
| Features | Min | Value | Max | Features | Min | Value | Max |
|---|---|---|---|---|---|---|---|
| Cough | - | 0 or 1 | - | ALT | 5 | - | 41 |
| Body temperature | - | 0 or 1 | - | Amylase | 28 | - | 100 |
| Chest pain | - | 0 or 1 | - | AST | 5 | - | 37 |
| Weakness | - | 0 or 1 | - | Bilirubin | 0 | - | 1 |
| Shortness of breath | - | 0 or 1 | - | Creatine kinase | 15 | - | 170 |
| Wheezing | - | 0 or 1 | - | CK-MB | 6 | - | 24 |
| Chest narrow | - | 0 or 1 | - | IRON | 37 | - | 145 |
| Sputum | - | 0 or 1 | - | GGT | 8 | - | 61 |
| Respiratory system | - | 0 or 1 | - | GLUCOSE | 70 | - | 110 |
| Smoking addictions | 0 or 1 | HDL Cholesterol | 35 | - | 65 | ||
| WBC | 4 | - | 11 | Calcium (Ca) | 8.4 | - | 10.8 |
| RBC | 4.2 | - | 6.2 | BUN | 13 | - | 50 |
| PLT | 12 | - | 18 | Chlorine (Cl) | 96 | - | 110 |
| HCT | 35 | - | 55 | Cholesterol | 40 | - | 200 |
| PLT | 150 | - | 400 | Creatinine | 0.4 | - | 1.5 |
| ALBUMIN 2 | 3.5 | - | 5.2 | LDH | 240 | - | 480 |
| Alkaline phosphatase | 38 | - | 155 | Potassium | 3.5 | - | 5.5 |
| Sodium (Na) | 140 | - | 157 | Protein | 6.4 | - | 8.3 |
| Triglyceride | 40 | - | 200 | Uric acid | 0 | - | 7 |
Table 1. Summary of data features.
Experimental results
After testing the performance of SVM and the ASVM on chest disease diagnosis and comparing it to the previous studies, we obtain the results presented in Table 2 below. In fact, after analyzing the obtained results we can deduce that: It can be clearly seen that there is a difference between our results and those given by previous studies [1]; The previous classification results presented in [1] gave 90% of accuracy for TB, and 88.73% accuracy for COPD by using MLNN method with LM (2 hidden layers). Moreover, in [1], MLNN method gave 90% accuracy for Pneumonia. For Asthma, 90.91% was achieved by using PNN method. In addition, LVQ achieved 93.75% for Lung cancer. Finally, 96% of normal instances were predicted by using MLNN. So, we can conclude that the authors in [1] gave reasonable results and acceptable solution for chest diseases diagnosis but as can be seen, not most efficient.
| Studies | Methods | Classification accuracy % | |||||
|---|---|---|---|---|---|---|---|
| Tuberculosis | COPD | Pneumonia | Asthma | Lung cancer | Normal | ||
| [1] | MLNN | 90 | 88.73 | 90 | 90.91 | 90.63 | 96 |
| PNN | 88 | 88.73 | 88.33 | 90.91 | 93.75 | 93 | |
| LVQ | 84 | 84.51 | 86.67 | 86.37 | 93.75 | 94 | |
| GRNN | 86 | 83.1 | 88.33 | 86.37 | 84.38 | 95 | |
| RBF | 86 | 87.32 | 90 | 88.64 | 90.63 | 95 | |
| Our studies | SVM | 91.87 | 90.59 | 89.58 | 97.23 | 96.7 | 92.01 |
| ASVM | 93.56 | 92.63 | 91.5 | 98.45 | 97.8 | 98.11 | |
Table 2. Classification accuracies for each disease.
From Table 2, it can be clearly seen that our method using SVM gave better classification results compared to the previous studies presented in [1]. For example, SVM reported an efficiency of 91.87% for TB, 90.59% for COPD, 97.23% for Asthma and 96.70% for Lung cancer. So, by using SVM, the classification rates of the five chest diseases studied were generally higher than those presented by the previous methods in [1]. So we can say that SVM performs better than the previous studies that have used different types of Neural Network.
Moreover, from Table 2, we can conclude that the best classification accuracy was obtained using the ASVM method for all chest diseases. Indeed, ASVM increases the SVM classification accuracy. For instance, 93.56% classification accuracy is obtained for TB using ASVM, while it reaches 91.87% classification accuracy using the SVM. Moreover, ASVM achieved 92.63% for COPD, while SVM gave 90.59%. ASVM also produced better results and the best accuracy for Asthma diagnosis by producing 98.45%, while SVM gave 97.23%.
These results show that using ASVM to diagnose chest disease is a good tool compared to other methods. The ASVM success is related to the change of the standard value of Bias used in SVM by an adaptive value. Hence, this allows us to conclude that the classification accuracy obtained by using ASVM is higher than the one obtained by using standard SVM and is significantly better than the accuracy obtained by the previous methods (MLNN, PNN, LVQ, GRNN, and RBF). These results prove the effectiveness of using the ASVM for chest disease diagnosis thanks to the additivity concept of the Bias value that allow the classification accuracy to be increased.
Conclusion
In this thesis, some of artificial intelligence techniques namely are SVM and ASVM were used for chest disease diagnosis; these techniques were presented, explained, tested and compared with other previous techniques. This study is the first to test the chest disease diagnosis using ASVM. Using experimental data collected from Diyarbakir Chest Diseases Hospital (Southeast Turkey), the efficiency of the SVM and the ASVM classifiers are validated, showing that the SVM presents good and very acceptable results as a solution for chest disease diagnosis problems and that ASVM gives the best results for chest disease diagnosis compared with previous studies. As a general conclusion, the ASVM can be successfully used for chest disease diagnosis and therefore can be used by doctors to take appropriate decisions.
Acknowledgment
Amani Yahyaoui is funded by a grant from Türkiye Burslari Scholarship, Turkey.
References
- Er O, Yumusak N, Temurtas F. Chest diseases diagnosis using artificial neural networks. Expert Sys Appl 2010; 37: 7648-7655.
- Er O, Temurtas F, Tanrıkulu A C. Tuberculosis disease diagnosis using artificial neural networks. J Med Sys 2010; 34: 299-302.
- Samira T, Abolfazl F, Fatemeh R, Seyed D, SiadatFarzam V. Prevalence of Beijing and Haarlem genotypes among multidrug resistant Mycobacterium tuberculosis in Iran: systematic review and meta-analysis. Tubercul J 2017.
- Greg JF. Household-contact investigation for detection of tuberculosis in Vietnam. N Engl J Med 2018; 378: 221-229.
- Elveren E, Yumusak N. Tuberculosis disease diagnosis using artificial neural network trained with genetic algorithm. J Med Sys 2011; 35: 329-332.
- Ucar T, Karahoca A, Karahoca D. Tuberculosis disease diagnosis by using adaptive neuro fuzzy inference system and rough sets. Neur Comput Appl 2013; 23: 471-483.
- Ian DP. Mepolizumab for eosinophilic chronic obstructive pulmonary disease. N Engl J Med 2017; 377: 1613-1629.
- Daniele D, Dora L, Liviana D, Carlo G. Treatment of community-acquired pneumonia: are all countries treating children in the same way? a literature review. Int J Pediatr 2017; 2017.
- Er O, Sertkaya C, Temurtas F, Tanrikulu A C. A comparative study on chronic obstructive pulmonary and pneumonia disease diagnosis using neural networks and artificial immune system. J Med Sys 2009; 33: 485-492.
- Er O, Yumusak N, Temurtas F. Diagnosis of chest diseases using artificial immune system. Expert Sys Appl 2012; 39: 1862-1868.
- Sun T, Wang J, Li X, Guo X. Comparative evaluation of support vector machines for computer aided diagnosis of lung cancer in CT based on a multi-dimensional data set. Comp Met Prog Biomed 2013; 111: 519-524.
- Padmavathi J, Heena L, Fathima S. Effectiveness of support vector machines in medical data mining. J Commun Softw Sys 2015; 11: 25-30.
- Yalini P, Priya A. Detecting tuberculosis in chest radiographs using SVM classifier. Int J Comp Sci Eng Commun 2015; 3: 771-775.
- Cortes C, Vapnik V. Support-vector networks. Mac Learn 1995; 20: 273-297.
- Veropoulos K, Campbell C, Cristianini N. Controlling the sensitivity of support vector machines. Proceeding of the International Joint Conference on AI Stockholm, Sweden 1999; 55-60.
- Osowski S, Siwek K, Markiewicz. MLP and SVM networks-a comparative study. 6th Nordic Signal Processing Symposium Espoo, Finland 2004; 37-40.
- Osowski S, Tran L, Markiewicz T. Support vector machine-based expert system for reliable heartbeat recognition. IEEE Trans Biomed Eng 2004; 51: 582-589.
- Comak E, Arslan A, Turkoglu I. A decision support system based on support vector machines for diagnosis of the heart valve diseases. Comp Biol Med 2007; 37: 21-27.
- Meier TB, Desphande AS, Vergun S, Prabhakaran V. Support vector machine classification and characterization of age-related reorganization of functional brain networks. Neuroimage 2012; 60: 601-613.
- Osuna E, Freund R M, Girosi F. Training support vector machines: an application to face detection. IEEE Comp Soc Conf Comp Vis Patt Recogn Puerto Rico 1997; 130-136.
- Trabelsi I, Ben Ayed D. On the use of different feature extraction methods for linear and nonlinear kernel. Sciences of Electronics, Technologies of Information and Telecommunications (SETIT), 2012 6th International Conference Sousse, Tunisia 2012; 797-802.
- Bhatia S, Prakash P, Pillai GN. Training support vector machines: SVM based decision support system for heart disease classification with integer-coded genetic algorithm to select critical features. Proc World Congr Eng Comp Sci San Francisco USA 2008; 22-24.
- Djeffal A. Utilisation de method support vector machines dans lanalyse des bases de donnees. Mohamed Khider-Biskra Univ Biskra Algeria 1999.
- Gurbuz E, Kilic E. A new adaptive support vector machine for diagnosis of diseases. Expert Sys 2013; 31: 389-397.