ISSN: 0970-938X (Print) | 0976-1683 (Electronic)
Biomedical Research
An International Journal of Medical Sciences
Research Article - Biomedical Research (2018) Volume 29, Issue 10
Deception detection using artificial neural network and support vector machine
Nidhi Srivastava* and Sipi Dubey
Department of Computer Science Engineering, Rungta College of Engineering and Technology, Bhilai, (C.G.), India
- *Corresponding Author:
- Nidhi Srivastava
Department of Computer Science Engineering
Rungta College of Engineering and Technology
India
Accepted date: March 15, 2018
DOI: 10.4066/biomedicalresearch.29-17-2882
Visit for more related articles at Biomedical ResearchLie detection, also called as deception detection, uses questioning techniques to ascertain truth and falsehood in response. In this paper, features of speech and physical values are used to ascertain truth and lie. The Mel frequency cepstrum coefficient, energy, zero crossing rate, fundamental frequency and frame function of speech signal and physical values like heart-beat, blood pressure and respiratory rate are used to model the linear detector model. The results are validated by support vector machine and artificial neural network.
Keywords
Support vector machine (SVM), Artificial neural network (ANN), Speech features, Physiological values
Introduction
Lie or blu detection is an open challenge for researchers. There is wide variety of technologies available for this purpose [1]. The most common and long used measure is the polygraph test which can discriminate truth and lie. It is claimed that machines do detect deception better than chance, but with significant error rates [2]. Normally question-answer technique along with technology that record physiological values to differentiate between truth and falsehood are employed. During the interview session one has to closely observe the subject behavior and note the uctuations in each and every response to identify the lie syntax. Accuracy obtained is still an open challenge. So lots of hints are available every day which act as pointer to discriminate between the truth and lie.
Physiological responses such as blood pressure, heart beat and respiratory rate are also used to discriminate between truth and lie [3]. Speech signals are considered as an option for proving someone liar or not [4]. Speech utterances give the detail about the emotions also [5,6]. The recorded changes in these parameters are correlated and analysed in respect to specific questions. It is observed that non-invasive physiological features i.e. is voice pitch, skin conductance and heart rate variability are correlated to number of high stress situations [7].
The detection is associated with a guilty conscience, allows for the detection of whether the person is lying or not. The fear in mind of human being can activate the nervous system responses which result in several involuntary changes of physiological values [7]. The three modalities i.e. text, face-to-face and audio communication [8] can also lead to deceptive behavior. Skin temperature [9] increases during guilt and it is measured by thermal camera. Change in skin temperature around the two periorbital regions are converted to relative blood flow velocity. So, skin temperature is also used to trap deception and is normally done for passenger at highly secure zone. Respiration pattern is also simultaneously determined by the ratio of measured maximum and minimum temperature in nostril area [10]. Concealed Information Test (CIT) is carried to detect guilt and intent condition using the physiological approach [11].
In this paper, a model is designed to identify deception using speech and physical features of 50 subjects. Support Vector Machine (SVM) and Artificial Neural Networks (ANN) are used for training and testing purposes. Rest of the paper is organizes as: In section 2, we give a brief description of the previous models developed for deception detection. In section 3, experimental set up is provided. Section 4 deals with the database collection i.e. speech features and physiological features, classification and results obtained. Section 5 concludes the paper.
Existing Literature
Previous attempts to detect deception were usually conducted using physiological sensors. Major drawback for the process is that human judgement on different cases is usually biased and achieves poor classification accuracy. These approaches require large amount of e orts and time for analysis. Facial expressions and respiration rates are traditional way of deception detection. Verbal, nonverbal behavior [12] and the speech features like speaking rate, pitch, energy are better options for lie detections. Patil et al. proposed the need of machine intelligence to include the emotional intelligence recognize human affective state [13]. Respiration rate, electrocardiograph, blood pressure and galvanic skin resistance were used as features with mechanical scribbles for deception detection by Yong et al. [14].
Multimodal dataset consisting of physiological, thermal and visual responses of subject under the three scenarios of deception i.e. mock crime, best friend and abortion were also found to be suitable for deception detection. Statistical analysis of differences between deceptive and truthful settings using physiological and thermal response was presented [3]. Polygraph test (Deception) at airport by thermal image captured at different stages i.e. acquisition, physiological correlation and classification was conducted [15]. Warmelink et al. pointed increment in the liar’s skin temperature as compared to the truth tellers. They reported 64% of non-deception and 69% of deception correctly. The thermal image camera increases the performance to 72% of truth and 77% of liars correctly [9]. Thermodynamic modeling of images acquired by thermal camera for finding the blood flow rate at the face of the subject was also reported [15]. The functional infrared imaging facial thermal signature is a touch less technique for the assessment of any person’s emotional arousal [16].
The infrared functional imaging to record the temperature variation of hands associated with the sympathetic skin response to identify the complementary method that monitors the emotional sweating was cited [17]. Rajoub et al. pointed thermal imaging concept for checking the stress level of the subject on the basis of heat radiation from the face. They observed the periorbital regions thermal variation and discriminated between liar and truth teller [18].
Pattern classification method was also employed to discriminate between the deception and non-deception [19] over 40 subjects and obtained 80% success rate of classification. Nonintrusive lie detection to extract concealed knowledge inference was carried over 16 subjects and reported the EER 16.5% [17]. The infrared functional imaging to record the temperature variation of hands associated with the sympathetic skin response to identify the complementary method that monitors the emotional sweating was cited in [20]. Detection of much physiological function from thermal images of skin surface obtained by the Far Infra-Red (FIR) imaging was reported in [21]. Thermal imaging for lie detection is a costly and needs expertise too.
Experimental Setup
In this paper, features of speech and physiological values are considered for detection of deception i.e. variation or uctuations in features of speech and physiological values. Feature extraction is done in an isolated environment. The subject is also asked to avoid the movement of head and hand so as to obtain correct features.
Physiological features are extracted using standard wired sensor viz. Blood sensor, pressure sensor and respiration sensor.
Speech signals with audio Format-PCM 44.100 khz, 16 Bit, Stereo are extracted in an external noise free zone with the help of mice and their features are obtained through the steps described in 4.2.
A set of 15 questions including relevant and irrelevant is put against the subject and his/her response is observed. At the same time, physiological and speech features of the subject are recorded. Flow chart of the process adopted is shown in Figure 1.

Figure 1: Feature extraction steps.
Implementation and Results
The experiment is done over 50 subjects. All the subjects were placed in an isolated environment. It is also ensured that the subjects responses were their own's statement.
Physiological features
Standard sensors are utilized to record the physiological features. A set of 15 questions were put to a subject and their responses in the form of "Yes" or "No" were recorded. At the same time, their physiological responses i.e. heart rate, blood pressure and respiration rate were recorded using standard sensor. Blood Pressure Recorder (HICKS), automatic blood pressure monitor is used for the same. It gives the Heart Beat in PUL/min. Figure 2 shows the setup used. Peak flow meter is used for measurement of respiratory rate and the device used is shown in Figure 3.

Figure 2: Setup for measurement of blood pressure and heart rate.

Figure 3: Respiratory rate measurement device.
Table 1 shows the response of a subject for 5 statements.
| S. No. | Speech | BP | Heart rate | Respiratory rate |
|---|---|---|---|---|
| 1 | Statement 1 | 135/86 | 87 | 22 |
| 2 | Statement 2 | 124/96 | 92 | 23 |
| 3 | Statement 3 | 122/96 | 91 | 23 |
| 4 | Statement 4 | 125/100 | 90 | 22 |
| 5 | Statement 5 | 148/125 | 44 | 11 |
Table 1: Physiological features of a subject.
Speech features
We obtained speech features from the responses of the subject at the time of interview session. The responses were set following constraints:
Frame duration Tw=25 ms,
Frame shift Ts=20 ms,
Pre-emphasis coefficients alpha=0:97,
Number of filter bank channels M=20,
Number of cepstral coefficient C=12,
Cepstral sine lifter parameter L=22,
Lower frequency Lfreq=300 hz, and
Upper frequency Ufreq=3700 hz.
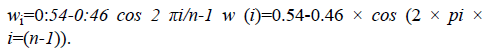
Preprocessing of speech signals is done using hamming window. The window is optimized to minimize the maximum side lobe. The filter coefficients of a hamming window of length are computed according to the formula:
The duration of each identifiable repeating patterns is called the (duration of the) glottal pulse or pitch period length (ζ).
The fundamental frequency is then calculated by 1/ζ.
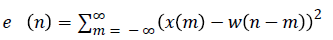
Zero crossing rate is computed by  where x (m) is the speech signal and w (n) is the hamming window for speech signals of length n.
The energy associated with speech is time varying in nature and is calculated as:
From the responses (speech signals of subjects), fundamental frequency, zero crossing rate, frames function and energy are extracted [22,23]. Steps to calculate MFCC (Mel frequency cepstral coefficient) are:
1. Frame the signal into short frames.
2. For each frame calculate the periodogram estimate of the power spectrum
3. Apply the mel filter bank to the power spectra, sum the energy in each filter.
4. Take the logarithm of all filter bank energies.
5. Take the DCT of the log filter bank energies.
6. Keep DCT coefficients 2-13, discard the rest.
Classification: Artificial Neural Network (ANN) and Support Vector Machines (SVM) are used for classification. The feature extraction process generates a feature vector for each subject. Feature-level fusion is then employed by concatenating the features extracted from the two modalities for each subject. The concatenated feature vectors are used to train a decision classifier in order to detect deceptive instances. The classification process employs multilayer perceptron neural network concept and the error correction validation scheme to get the better result.
ANN with the following features were used for training: 1 hidden layer with 20 neurons, scaled conjugate gradient training is adopted. For training, the input consists of physical and speech features of the subjects. Out of the 15 responses, the two deceptive statements are placed in the first two rows and remaining are kept subsequently. The neural network is then trained with the specified parameters. The trained classifier is then tested for its validity. For testing phase, we set the data with physical as well as the speech values of the same subject. The trained neural network is tested over individual responses. The threshold score thus obtained after training is compared in order to distinguish the subject’s response for deception. If the threshold value for the person to be tested is greater than the threshold score, then the person is laying otherwise the statement is true. Result of testing of one subject is shown in Figure 4.

Figure 4: Performance plot.
SVM are non probalistic binary linear supervised learning models. The same set of features is also applied to SVM. Results of the training are classified to class lie (-1) or truth (+1). Response of SVM is faster and more accurate as compared to ANN. In this paper, 50 subjects are used for detection of deception. Physiological and speech features are extracted during interview session in an isolated and noise free zone. Two classification techniques i.e. ANN and SVM are utilized. The classifier is tested for 15 subjects. Accuracy for the classifier is defined by:
Accuracy=No: of true observations/total no: of observations → (1)
The accuracy of ANN model is 93.33% whereas that of SVM is 100% as shown in Table 2. The result of one subject is false due to either improper collection of data, calibration of sensors.
| S. no. | Subject | Artificial neural networks | Support vector machines |
|---|---|---|---|
| 1 | Subject 1 | True | True |
| 2 | Subject 2 | True | True |
| 3 | Subject 3 | True | True |
| 4 | Subject 4 | True | True |
| 5 | Subject 5 | False | True |
| 6 | Subject 6 | True | True |
| 7 | Subject 7 | True | True |
| 8 | Subject 8 | True | True |
| 9 | Subject 9 | True | True |
| 10 | Subject 10 | True | True |
| 11 | Subject 11 | True | True |
| 12 | Subject 12 | True | True |
| 13 | Subject 13 | True | True |
| 14 | Subject 14 | True | True |
| 15 | Subject 15 | True | True |
Table 2: Comparison of results obtained through artificial neural networks and support vector machines.
Conclusion
Lie detection uses questioning techniques along with technology that record physiological functions to ascertain truth and falsehood in response. It is observed that machines do detect deception better than chance, but with significant error rates. In this paper, physiological features (Blood pressure, heart rate and respiratory rate) and speech features (fundamental frequency, zero crossing rate, MFCC, frames function and energy) speech are used. The paper added the new database that consists of deceptive as well as truthful values. The introduced technique is step ahead for automation process for deception detection process with the low cost manner. Result shows that speech features along with physical features are better pointer deception detection. Other classification methods may give fast and accurate results. More speech and physical value can provide robustness to the model.
References
- Norton M. The UK parliamentary office of science and technology and its interaction with the OTA. Technol Forecast Soc Change 1997; 54: 215-231.
- Saxe L, Dougherty D, Cross T. Scientific validity of polygraph testing: a research review and evaluation of technical memorandum (no. ota-tm-h-15,). Washington, DC: US Congress Office of Technology Assessment 1983.
- Perez-Rosas V, Mihalcea R, Narvaez A, Burzo M. A multimodal dataset for deception detection. LREC 2014; 3118-3122.
- Ahsan A, Nagdeve U. Crime detection using voice behavior on the basis of collected evidence. Int J Eng Adv Technol (IJEAT) 2014; 4: 137-141.
- Burkhardt F, Paeschke A, Rolfes M, Sendlmeier WF, Weiss B. A database of German emotional speech. Ninth European Conference on Speech Communication and Technology 2005.
- Burkhardt F, Sendlmeier WF. Verification of acoustical correlates of emotional speech using formant-synthesis. ISCA Tutorial and Research Workshop (ITRW) on Speech and Emotion 2000.
- Sung M, Pentland AS. Stress and lie detection through non-invasive physiological sensing. Int J Biomed Soft Comp Human Sci 2009; 14: 11-118.
- Qin T, Burgoon JK, Blair J, Nunamaker JF. Modality effects in deception detection and applications in automatic-deception-detection. Sys Sci 2005; 23.
- Warmelink L, Vrij A, Mann S, Leal S, Forrester D, Fisher RP. Thermal imaging as a lie detection tool at airports. Law Human Behav 2011; 35: 40-48.
- Sumriddetchkajorn S, Somboonkaew A, Sodsong T, Promduang I, Sumriddetchkajorn N. A field test study of our non-invasive thermal image analyzer for deceptive detection. European Conference on Biomedical Optics, Optical Society of America, 2007; 6633-6650.
- Meijer EH, Verschuere B, Merckelbach H. Detecting criminal intent with the concealed information test. Op Criminol J 2010; 3: 44-47.
- Vrij A, Granhag PA, Porter S. Pitfalls and opportunities in nonverbal and verbal lie detection. Psychol Sci Publ Interest 2010; 11: 89-121.
- Patil VP, Nayak KK, Saxena M. Voice stress detection. Int J Electric Electron Comp Eng 2013; 2: 148-154.
- Yong CY, Sudirman R, Chew KM. A portable polygraphic recorder-lie detector. Int J Rec Trends Eng Technol 2011; 6: 172-175.
- Pavlidis I, Levine J. Monitoring of periorbital blood flow rate through thermal image analysis and its application to polygraph testing. Eng Med Biol Soc 2001; 2826-2829.
- Merla A, Romani GL. Thermal signatures of emotional arousal: a functional infrared imaging study. Eng Med Biol Soc 2007; 247-249.
- Merla A, Di Donato L, Romani G, Rossini P. Recording of the sympathetic thermal response by means of infrared functional imaging. Eng Med Biol Soc 2003; 2: 1088-1090.
- Rajoub BA, Zwiggelaar R. Thermal facial analysis for deception detection. IEEE Trans Info Forens Secur 2014; 9: 1015-1023.
- Tsiamyrtzis P, Dowdall J, Shastri D, Pavlidis I, Frank M, Ekman P. Lie detection-recovery of the periorbital signal through tandem tracking and noise suppression in thermal facial video. Proceedings of SPIE Sensors, and Command, Control, Communications, and Intelligence (C3I) Technologies for Homeland Security and Homeland Defense 2005; 5778: 29-31.
- Jain U, Tan B, Li Q. Concealed knowledge identification using facial thermal imaging. Acoustics, Speech and Signal Processing (ICASSP), 2012 IEEE International Conference 2012; 1677-1680.
- Fujimasa I, Chinzei T, Saito I. Converting far infrared image information to other physiological data. IEEE Eng Med Biol Magaz 2000; 19: 71-76.
- Lartillot O, Toiviainen P. A matlab toolbox for musical feature extraction from audio. International Conference Digital Audio effects 2007; 237-244.