ISSN: 0970-938X (Print) | 0976-1683 (Electronic)
Biomedical Research
An International Journal of Medical Sciences
- Biomedical Research (2016) Volume 27, Issue 3
Classification of parasite egg cells using gray level cooccurence matrix and kNN.
Department of Computer Engineering, Atilim University, Turkey
Accepted Date: March 17, 2016
Parasite eggs are around 20 to 80 μm dimensions, and they can be seen under microscopes only and their detection requires visual analyses of microscopic images, which requires human expertise and long analysis time. Besides visual analysis is very error prone to human procedures. In order to automatize this process, a number of studies are proposed in the literature. But there is still a gap between the preferred performance and the reported ones and it is necessary to increase the performance of the automatic parasite egg classification approaches. In this study a learning based statistical pattern recognition approach for parasite egg classification is proposed that will both decrease the time required for the manual classification by an expert and increase the performance of the previously suggested automated parasite egg classification approaches. The proposed method uses Gray-Level Co-occurrence Matrix as the feature extractor, which is a texture based statistical method that can differentiate the parasite egg cells based on their textures, and the k-Nearest Neighbourhood (kNN) classifier for the classification. The proposed method is tested on 14 parasite egg types commonly seen in humans. The results show that proposed method can classify the parasite egg cells with a performance rate of 99%.
Keywords
Parasite egg cells, Classification, Gray level co-occurence matrix.
Introduction
Parasite eggs, which may cause some sort of illness in humans, are around 20 to 80 μm dimensions and they can be seen under microscopes only [1]. So detection of parasite eggs requires visual analyses of microscopic images by human experts, which requires human expertise and long analysis time. Besides visual analysis is very error prone to human procedures. In order to reduce the analysis time and human error rates; automatic image analysis and parasite egg classification techniques are needed. In addition to this, automatic egg classification will help early detection of the parasites, which will decrease the diseases caused by those parasites. Due to overcome this problem, some automatic parasite egg classification methods based on image processing techniques and pattern recognition approaches are suggested in the literature. The most important ones of these studies are summarized below.
The automatic parasite egg classification works started with the work by Yang et al. in 2001. In this study, the morphometric characteristics of eggs were extracted from microscopic images using image processing techniques. Then they used Artificial Neural Networks (ANN) to identify the eggs. The extracted features were based on shape, shell smoothness and size. They used a total of 82 microscopic images, and tenfold crossvalidation method. As a result they obtained 90.3% correct classification rate [2]. Sengur and Turkoglu proposed a statistical pattern recognition approach to classify 8 different egg cells. They used invariant moments for the feature extraction, and they used ANN for the classification. As a result they obtained 90% correct classification rate [3]. Dogantekin et al. proposed a technique based on invariant moments and adaptive network. They used noise reduction as a pre-processing step, and contrast enhancement, segmentation, and morphological processes for the feature extraction. They tested the proposed method to classify 16 different parasite eggs from microscopic images and they obtained 95% success rate [4]. In a similar study Avci and Varol proposed an expert diagnosis system to classify parasite eggs based on multi-class Support Vector Machine (SVM). They used invariant moments as the features. They used noise reduction, contrast enhancement, thresholding and morphological and logical processes in the preprocessing stage. At the testing stage they obtained an overall of 97.70% success classification rate [5].
In a recent study, Ghazali et al. proposed an automated system for diagnosis of parasites using image analysis methods. Their technique is based on Filtration and Steady Determinations Thresholds Systems (F-SDTS). The features they used were extracted using the shape, shell smoothness and size. They tested the proposed approach on two different parasite eggs (roundworms and whipworms) and obtained 94% success classification rate [6]. Suzuki et al. proposed an ellipse matching and image foresting transform based approach to detect and classify 15 most common species of protozoan cysts, helminth eggs and larvae in Brazil. They used genetic programming for object representation and the optimum-path forest classifier for the recognition. As a result they obtained 90.38% of sensitivity, 98.32% of specificity, 98.19% of efficiency [7]. Bruun et al. proposed a new instrument named OvaSpec for assessing the quality (concentration) and quality of a special type parasite eggs, namely Trichuris suis. They used morphological properties to distinguish eggs under brightfield and darkfield illumination. For testing they used six egg suspensions of varying quality. They compared the results obtained from OvaSpec with the manual ones, they claim that the error rates are less than 1.0% [8]. Flores-Quispe et al. proposed a content based image retrieval to classify 8 different helminth eggs. They proposed to use multitexton histogram descriptor (MTH) as the feature extractor and CBIR as the classifier. They obtained 92.16% correct classification rate [9]. Liu et al. proposed an algorithm based on morphological segmentation and fuzzy neural network to recognize human erythrocytes automatically and precisely. They used top-hat transformation, Otsu’s method and image binarization in the segmentation phase, and they used fuzzy c-means clustering and neural network for screening. They showed that the proposed algorithm successfully identifies the erythrocytes in different imaging conditions [10]. In a recent study Li et al. proposed a method to recognize the parasite eggs based on their contours. The contours were extracted using phase coherence technology. They used Support Vector Machines (SVM) as the classifier, and they obtained a total of 95% classification accuracy [11].
As a summary, the studies given in the literature focus on morphometric characteristics or physical shapes of the parasite egg cells and reported performances are between 90% and 97%. So there is a gap between the prefered performance and the obtained ones and it is necessary to increase the performance of the automatic cell classification approaches. In order to increase the classification performance of the aforementioned problem, in this study a texture-based feature extraction method is proposed, which is not used for parasite egg cell classification before. The proposed method uses a supervised learning based approach to classify parasite egg cells. The proposed method can be divided into two stages: the first one is the feature extraction stage, and the second one is the classification stage. In the proposed method Gray-Level Co-occurence Matrix (GLCM) is used as the feature extractor, and k-NN is used as the classifier. The organization of the paper is follows: In section 2 classified parasite egg cells, the feature extraction and classification approaches followed in the study, and test methods are presented. In Section 3 results obtained by the proposed method are given, and in Section 4 discussions and conclusions are presented.
Materials and Methods
Classified parasite egg cells
In this study an automated parasite egg cell classification approach to classify parasite egg images is proposed. In the experimental study a total of 14 most commonly seen parasite eggs in humans are classified. Those types are selected according to the work by Avci and Varol. [5]. The classified parasite eggs are Fertilized Ascaris lumbricoides (FAL), Unfertilized Ascaris lumbricoides (UAL), Hymenolepsisd diminuta (HD), Enterobius vermicularis (EV), Fasciola hepatica (FH), Giardia lamblia (GL), Achiatosoma haematobium (XX), Schistosoma japonicum (SJ), Kellicoti (K), Diphyllobotrium latum (DL), Schistosoma mansoni (SM), Hymenolepsis nana (HN), Paragonimus westermani (PW), and Trichuris vulpis (VP). The parasite egg cell images were taken from the web site of Parasitology Research Center, Kansas University [12]. The images of these parasite egg cells are given in Figure 1.

Figure 1: Classified Parasite Egg Cells.
The classification approach
In this study a learning based statistical pattern recognition approach is followed in order to classify parasite egg cells. This approach can be divided into two stages: training and testing. In the training stage the classifier is trained using the samples whose output classes are known. In the testing stage the features of the test samples are extracted and compared with the features of the training samples, and the output class is determined with respect to this analysis [13]. The proposed method also requires feature extraction to extract the features from the parasite egg cells, and a classifier to compare and classify the features of training and test sets. In this study for feature extraction Gray-Level Co-occurrence Matrix is used, which is a texture based statistical method that can differentiate the parasite egg cells based on their textures. For the classification the k-Nearest Neighborhood (kNN) classifier is used, which is a well-known classifier commonly used in pattern recognition applications [13]. In the following subsections the details of these stages are given.
Gray-Level Co-occurrence Matrix (GLCM)
GLCM, also known as the gray-level spatial dependence matrix, is a statistical method to analyze textures of an image. The GLCM is first introduced by Haralick in 1973 [14]. It focuses on spatial relationship of pixels, by calculating how often different pairs of pixels with specific intensity values (gray values) occur in a predefined spatial region. GLCM estimates the image properties related to second order statistics. In other words GLCM is a texture based feature extractor used in image recognition. Features generated using GLCM are also known as Haralick features.
For a given image I with the size of MxN, the gray-level cooccurrence matrix GL can be defined as follows:
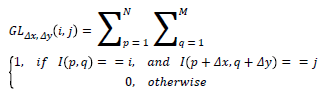
Where i and j are the intensity values of the pixels, p and q are the image coordinates and (Δx, Δy) are the offset values. The most important parameters of the GLCM are the number of the intensity values of the image (also known as gray levels) and the offset values. Offset values determines the direction angle used in the computation and the distance (d) at which the matrix is computed. Each element of the matrix represents the number of occurrences of the pair of gray levels of the image.
The offset values determine the direction angle and distance used in the computation. For instance, (0,d) corresponds to horizontal direction (0 degree), (-d,d) corresponds to right diagonal or 45 degrees, (-d,0) corresponds to vertical or 90 degrees, and (-d,-d) corresponds to left diagonal or 135 degrees. Remember that here d means the distance parameter (set to 1 by default). It is obvious that for every offset parameter a different GLCM will be calculated, which may affect the performance of the proposed method. After calculating the GLCM, the matrix is converted to a row vector with the size of 1 x (MXN). That row vector is directly used as the feature set of the processed image. For different gray levels, the length of the feature vector is also different, giving a different number of features used in the classification. When the number of features used in the classification increase, it is expected to get a higher performance [13].
kNN classification approach
k-Nearest Neighbors algorithm (shortly stated as kNN) is a nonparametric classification approach commonly used in pattern recognition and machine learning applications. It can also be used in regression as well. In the algorithm the data that will be classified is compared with the all the data available in the training set, according to a distance metric. Then the k classes with the minimum difference are determined. The test data is assigned to the class most common among its k nearest neighbors, where k is a small positive integer. If the k is equal to 1, then the test data is assigned to the class of the first nearest neighbor [15,16].
Test methods
In the experimental study a total of 14 different types of human parasite eggs are classified. The original image of the each parasite egg cell type was rotated in steps of 10 degrees between 0 and 360 degrees, giving a total of 36 images per type. For each type these images are rescaled by a range of 0.85 and 1.15, in order to simulate the different cell sizes. So a total of 108 images (36 images for scale 0.85, 36 images for the original size, and 36 images for scale 1.15) are obtained for each parasite egg type. The original images (one image for each cell type) of the eggs are used as the training set, and other 108 images for each cell type are used as the testing set. The results presented in the next section are obtained using this train and test data sets.
Results
In this study an automated parasite egg cell classification approach to classify egg images based on Gray-Level Cooccurrence Matrix (GLCM) feature extractor and kNN classifier is proposed. In the experimental study a total of 14 different types of human parasite eggs are classified, as given in Section 2.1. In the experiments first of all classification approach using the GLCM with 8 gray levels, with a direction angle of 0 degrees, and distance parameter d=1 is performed. The obtained results are presented in Table 1 as a confusion matrix. In the confusion matrix the abbreviations of the parasite eggs, as given in Section 2.1, are used. In the confusion matrix the rows correspond to actual classes (in this study parasite eggs) and the columns correspond to predicted classes. The diagonal elements of the confusion matrix show the correctly classified eggs, and other elements show the incorrectly classified ones.
| XX | DL | EV | FH | FAL | GL | HN | HD | K | PW | SJ | SM | VP | UAL | |
|---|---|---|---|---|---|---|---|---|---|---|---|---|---|---|
| XX | 108 | |||||||||||||
| DL | 72 | 36 | ||||||||||||
| EV | 108 | |||||||||||||
| FH | 108 | |||||||||||||
| FAL | 44 | 64 | ||||||||||||
| GL | 108 | |||||||||||||
| HN | 72 | 36 | ||||||||||||
| HD | 108 | |||||||||||||
| K | 108 | |||||||||||||
| PW | 108 | |||||||||||||
| SJ | 23 | 85 | ||||||||||||
| SM | 108 | |||||||||||||
| VP | 108 | |||||||||||||
| UAL | 108 |
Table 1: Confusion matrix showing the classification performance of the parasite egg cells, when the number of gray levels is 8.
As can be seen from Table 1, a total of 139 cell images are classified incorrectly. This result corresponds to 90.81% correct classification rate. In order to increase the performance of the classifier, first of all the number of gray levels used in the GLCM is increased to 256, which is the maximum number of gray levels in the available data. The confusion matrix showing the classification performance of the GLCM method with 256 gray levels is given in Table 2.
| XX | DL | EV | FH | FAL | GL | HN | HD | K | PW | SJ | SM | VP | UAL | |
|---|---|---|---|---|---|---|---|---|---|---|---|---|---|---|
| XX | 108 | |||||||||||||
| DL | 106 | 2 | ||||||||||||
| EV | 107 | 1 | ||||||||||||
| FH | 108 | |||||||||||||
| FAL | 2 | 106 | ||||||||||||
| GL | 108 | |||||||||||||
| HN | 105 | 3 | ||||||||||||
| HD | 108 | |||||||||||||
| K | 108 | |||||||||||||
| PW | 108 | |||||||||||||
| SJ | 3 | 105 | ||||||||||||
| SM | 108 | |||||||||||||
| VP | 1 | 107 | ||||||||||||
| UAL | 108 |
Table 2: Confusion matrix showing the classification performance of the parasite egg cells whenever 256 gray levels are used in GLCM.
As can be seen from Table 2, only 12 parasite egg cell images out of 1512 images are incorrectly classified. In this case the correct classification performance is 99.20%. As can be seen from Table 1 and Table 2, the number of gray levels in the GLCM directly affects the classification performance of the proposed method. In order to determine the optimum value, different gray levels are used and the performance of the proposed method with respect to the gray levels is calculated. The obtained results are given in Table 3.
| Number of Gray Levels | Correct Classification Performance (%) |
|---|---|
| 8 | 90.81 |
| 16 | 96.40 |
| 32 | 97.60 |
| 64 | 99.20 |
| 128 | 99.20 |
| 256 | 99.20 |
Table 3: Classification performance with respect to number of gray levels used.
As can be seen from Table 3, the classification performance is 90.81% whenever 8 gray levels are used. Whenever the gray level is increased from 8 to 64, then the performance also increases to 99.20%. After then the performance does not change anymore when the number of gray levels is increased. From these results we can conclude that the proposed method successfully classifies the parasite egg cell images whenever 64 or higher gray levels are used.
Another parameter that can affect the performance of the proposed method is the angle used in the GLCM calculation. In order to determine the effect of the angle, the angle used in the GLCM calculation is changed between 0 degrees to 135 degrees. The obtained performance with respect to angle and the number of gray levels are given in Figure 2.

Figure 2: The performance of the proposed method with respect to different gray levels and angles.
As can be seen from Figure 2, when the number of gray levels is increased, the performance also increases. But on the other hand the performance does not change very much when the angle changes. For 8 gray levels, the performance is between 90.20% and 91.87%. For the 64 gray levels or higher, the performance is over 98%, which is an acceptable performance for the parasite egg classification problem.
Discussion and Conclusion
In this study a texture based feature extraction and classification approach is proposed in order to classify parasite egg cell images. In this context GLCM is used as the feature extractor and kNN is used as the classifier. The proposed approach is tested for 14 different parasite egg cell images with different parameters in the GLCM calculation. Test results show that the proposed method can classify the parasite egg cell images with high performance (on the range of 99%) when 256 gray levels is used in the GLCM calculation.
In addition to the overall performance of the proposed method, the confusion matrix showing the correctly and incorrectly classified eggs is also presented in the work. As can be seen from Table 2, 1500 parasite egg cell images out of 1512 are classified correctly. Out of the 14 parasite egg types, all the images of 8 parasite egg types are correctly classified. Half of the error occurs for the Schistosoma Japonicum and Hymenolepsis Nana pairs (a total of 6 incorrect classifications, out of 12 incorrect). Probably their textures look very similar to each other, so the classification error occurs in this pairs. In order to decrease error occurred in this cell pairs, a shape based feature extractor such as Local Binary Pattern or Speeded Up Robust Features (SURF) can be added to GLCM. Especially it is shown by Nazlibilek et al. [17] that SURF is very suitable for cell classification. In a next study SURF based approach for the parasite egg cell classification can be applied in addition to the proposed method.
There are a few studies in the literature for parasite egg classification such as the ones proposed by Yang et al. [2], Sengur and Turkoglu [3], Dogantekin et al. [4], Avci et al. [5]. The proposed method gives a performance of 99%, which is higher than the performances of most of the studies in the literature. Besides the overall performance, there are a few points that need to be discussed. For instance in [2], 83 parasite egg images of seven different types of parasites are used in the testing stage. So the number of classified parasite egg cell types is lower than the current study, which makes the current study more complex and generalizable. The same is also true for the work presented in [3], in which 8 different parasite egg cell types are classified. In addition to this, the proposed method in [2] requires preprocessing stage including median filtering, binary thresholding and segmentation to segment the parasite eggs from the background. The current study does not require the preprocessing approach. In [4] a total of 16 different parasite egg types have been classified using the IM_ANFIS approach. In that study in order to calculate the Hu invariant moments, first of all the cell borders of the parasite eggs need to be determined and the eggs need to be segmented from the background, which may cause some kind of errors. In addition to this in that study 180 digitally generated images of each type have been used, in which 30 of them are used in the training set, and the remaining 150 images are used in testing set. When compared with the current study, the number of the images in the training set in [4] is higher than the current study (which is 1 for each cell type), which makes the current study more effective in terms of training phase. The study proposed in [5] is very similar to the work proposed in [4] in terms of classified parasite egg types and the approach followed. The main difference between those studies is that in [5] SVM is used as the classifier instead of the ANN. In [5] a total of 120 digitally generated images of each parasite egg type are used at the testing stage. Half of these images are used as training and other half of the images are used as testing. Again the current study requires less number of images in the training stage.
References
- Ash LR, Orihel TC. Atlas of Human Parasitology (3rd ed.). Chicago, IL: ASCP, 1990.
- Yang YS, Park DK, Kim HC, Choi M, Chai J. Automatic identification of human helminth eggs on microscopic fecal specimens using digital image processing and an artificial neural network. IEEE Transactions on Biomedical Engineering 2001; 48:718-730.
- Sengur A, Turkoglu I. Parasite Egg Cell Classification Using Invariant Moments, Proceedings of 4th International Symposium on Intelligent Manufacturing Systems. 2004;98-106.
- Dogantekin E, Yilmaz M, Dogantekin A, Avcı E, Sengur A. A robust technique based on invariant moments – ANFIS for recognition of human parasite eggs in microscopic images. Expert Systems with Applications 2008; 35: 728-738.
- Avci D, Varol A. An expert diagnosis system for classification of human parasite eggs based on multi-class SVM. Expert Systems with Applications 2009; 36: 43-48.
- Ghazali KM, Hadi RS,Mohamed Z Mohamed. Automated System for Diagnosis Intestinal Parasites by Computerized Image Analysis. Modern Applied Science 2013; 7: 98-114.
- Suzuki CTN,Gomes JF, Falcao AX, Papa JP, Hoshino-Shimizu S. Automatic Segmentation and Classification of Human Intestinal Parasites From Microscopy Images. IEEE Transactions on Biomedical Engineering 2013; 60: 803-812.
- Bruun JM, Cartensen JM, Vejzagic N, Christensen S, Roeostroff A, Kapel CMO. OvaSpec - A vision-based instrument for assessing concentration and developmental stage of Trichurissuis parasite egg suspensions. Computers in Biology and Medicine 2014; 53: 94-104.
- Flores-Quispe R, Velazco-Paredes Y, Escarcina REP, Castanın CAB. Classification of Human Parasite Eggs based on Enhanced Multitexton Histogram.IEEE Colombian Conference on Communications and Computing (COLCOM), 2014.
- Liu L, Lei HT, Zhang J, Yuan Y, Zhang ZL, Liu JX, Xie Y, Ni GM, Liu Y. Automatic Identification of Human Erythrocytes in Microscopic Fecal Specimens. Journal of Medical Systems 2015; 39: 146-148.
- Li ZX, Gong HL, Zhang W, Chen LA, Tao JC, Song LG, Wu ZD. A robust and automatic method for human parasite egg recognition in microscopic images. Parasitology Research 2015; 114: 3807-3813.
- http://www.ksu.edu/parasitology .
- Jain AK, Duin RPW, Mao J. Statistical Pattern Recognition: A Review. IEEE Transactıons On Pattern Analysıs And Machıne Intellıgence 2000; 22.
- Haralick RM, Shanmugam K, Dinstein I. Textural Features for Image Classification. IEEE Trans. on Systems, Man, and Cybernetics 1973; 3: 610-621.
- Cover TM, Hart PE. Nearest neighbor pattern classification. IEEE Transactions on Information Theory 1967; 13: 21-27.
- Short RD, Fukunaga K. The optimal distance measure for nearest neighbor classification. IEEE Transactions on Information Theory 1981; 27: 622-627.
- Nazlibilek S, Karacor D, Ertürk KL, Sengul G, Ercan T, Aliew F. White Blood Cells Classifications by SURF Image Matching, PCA and Dendrogram Biomedical Research 2015; 26: 633-640.