ISSN: 0970-938X (Print) | 0976-1683 (Electronic)
Biomedical Research
An International Journal of Medical Sciences
Research Article - Biomedical Research (2017) Volume 28, Issue 8
Binomial probability distribution with QOS support for health monitoring in wireless body area network communication
Wireless Body Area network (WBAN) is a new technology used for patient health care monitoring in many application like military, entertainment etc. Quality of service (QoS) is an essential demand in WBAN as neighboring nodes at different state information has to be monitored in exact manner. But, network lifetime gets reduced due to large amount of energy consumption while transmitting the healthcare data packets from source to the sink node. In order to increase the network lifetime and reduce the energy consumption while transmitting the healthcare data packets, Binomial Probability Distribution with QoS Support (BPD-QoSS) Technique is designed in WBAN. Initially, the energy consumed by the node is calculated and higher energy nodes are grouped after calculating the energy consumption of each node. The energy consumption gets reduced by transmitting the healthcare data packets through cluster head. Then, the cluster head in the cluster is selected by using binomial probability density function. Finally, after cluster head selection, the healthcare data packets are sent to the sink node from source node with minimum energy consumption and therefore improve the network lifetime. The simulation result shows that Binomial Probability Distribution with QoS Support (BPDQoSS) Technique reduces energy consumption with higher throughput level and increases the network lifetime compared to state-of-the-works.
Keywords
Wireless body area network (WBAN), Quality of service (QoS), Binomial probability distribution, Cluster head, Healthcare data packets, Energy consumption
Introduction
A Gateway Selection Algorithm (GSA) is designed in [1] with energy harvesting technology. The algorithm chooses suitable WBASN node that serves as gateway to additional wireless networks. GSA equalizes the load between the nodes by changing the gateway node in WBASN. Though energy gets balanced between the nodes, the network lifetime is not increased. A new routing protocol for heterogeneous Wireless Body Area Sensor Networks (WBASNs) called Mobilitysupporting Adaptive Threshold-based Thermal-aware Energyefficient Multi-hop ProTocol (M-ATTEMPT) is designed in [2]. A protocol is described using heterogeneous sensors in human body. However, the energy consumption remained unaddressed. A smart phone based health monitoring system introduced in [3] determines and examines the physiological data of patient to explain the status of health condition and fitness. A routing protocol presented in [4] addresses the QoS needs of Body Area Network (BAN) data packets. However, the throughput is a challenging problem. A joint Power-QoS control scheme called as PEH-QoS scheme in [5] ensures that sensor node is able to detect the medical events and broadcast the specific data packets effectively. A power efficient methodology was introduced in [6] for transmission of patient data to medical authorities by RelAODV (Reliable AODV) protocol.
The routing protocol was introduced in [7] with setup of multiple nodes and an access point. The setup assesses the network architectures with on-body and off-body access point with many antennas. However, the energy consumption remained unaddressed. In [8], Bayes node energy polynomial distribution model was planned with minimum communication overhead. Integer Linear Programming in [9] solved high throughput issues and reduced the energy consumption while calculating the physiological parameters. However, the network lifetime is not increased. An energy efficiency model is designed in [10] manages the optimization of resource allocation using Global Energy Minimization (GEM) model. The contribution of the paper is organized as follows: Binomial Probability Distribution with QoS Support (BPD-QoSS) Technique is designed for health monitoring in WBAN communication with minimum energy consumption and prolong network lifetime. Initially, the energy consumed by the particular node is calculated and higher energy nodes are grouped after calculating the energy consumption of each node. The energy consumption gets reduced by transmitting the healthcare data packets through cluster head. Therefore, the cluster head in the cluster is selected by using binomial probability density function. After cluster head selection, the healthcare data packets are sent to the sink node from source node with minimum energy consumption and therefore increases the network lifetime. The rest of the paper is organized as follows. Section 2 includes he related work. Detailed description of Binomial Probability Distribution with QoS Support (BPD-QoSS) Technique is provided in Section 3. Section 4 presents the experimental setup for conducting the analysis. In Section 4, simulation environment is provided with detailed analysis of results explained in Section 5. In Section 6, the concluding remarks are included.
Related Works
In [11], an energy consumption model with transmission distance and transmission data rate over wireless communication link was designed. The model guarantees the energy saving and also improves the proportion of transmission energy. In [12], delay and energy consumption analysis was carried out with many priorities allocated to body nodes. Finite state markov model recognize the node state and guarantees the average delay during normal and emergency data. However, energy consumption is not minimized. Taxonomy of QoS for WBAN was introduced in [13]. In [14], a survey of wireless body area networks is performed with latest standards. A Virtualization Enabled routing [15] was designed with aim of reducing the traffic congestion and packet delay. An analysis of QoS aware health monitoring system was presented in [16]. A multiple level-based QoS design was designed in [17,18] at WBAN media access control layer regarding the user level, data level and time level. However, throughput is remained unaddressed. Remote Health Monitoring [19] over long distance communication network in continuous monitoring to improve transmission rate of physiological critical signals that improves the bandwidth utilization. However, the Quality of Service (QoS) needs for different healthcare applications is complicated problem. An energy efficient resource allocation model using Transmission Rate Allocation Policy was designed in [20].
Binomial Probability Distribution with QOS Support for Health Monitoring
Network model
In this section, a network model for designing with binomial probability distribution is presented. Let us consider WBAN deployed for monitoring the patient. In WBAN, ‘G=(V,E)’ with vertices ‘V’ of ‘n’ sensor nodes are denoted as ‘V=SN1,SN2,…,SNn’. The set ‘E’ of edges are represented as ‘E=e1,e2,…,em’ in sensing rectangular area ‘M*N’ at communication range ‘r’. ‘Nn’ is the set of node neighbors and sink node ‘S’.
Binomial probability distribution with QoS support (BPD-QoSS)
Wireless Body Area Network (WBAN) is a collection of wireless sensor nodes which are positioned in human body to examine the surrounding environment and functions of body. In WBAN, Base Station has adequate amount of energy and it is placed distant from sink. But, the sensor nodes are not same and contain only less amount of energy. Initially, all nodes are allocated with same amount of energy level. During the healthcare data packet transmission, energy level of nodes gets changed. The energy dissipation for healthcare data communication process like transmission and reception are evaluated in Eq. (1) and (2) respectively. The energy consumed by the node for transmitting the l-bit packet from source to sink at the distance is calculated by,
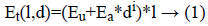
The energy consumed by node while receiving the p-bit packet is formulated as,
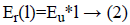
From Eq. (1) and Eq. (2), ‘Eu’ represents the energy utilization because of the digital coding, inflection, filtering, and diffusion of signal, etc. Energy consumed by spreader power amplifier is denoted as ‘Ea’. Packet size is symbolized as ‘l’.
The energy consumed for transmitting the healthcare data packets from node i to j is same one when transmitting from j to i for any SNR value as described in Figure 1. A routing path is prearranged series of nodes in network which sends the healthcare data packets to the sink node. As soon as collecting the healthcare data packets from its neighbor node, each node sends the healthcare data packet to next node. The key objective is to minimize the energy dissipation in sensor nodes through generation of optimal data collecting chain. By taking N number of nodes in network, the total energy consumed by every sensor nodes is expressed in Eq. (3).

Figure 1: Distance between two nodes.
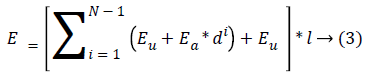
From Eq. (3), ‘di’ represents the distance between the ith node and (i+1)th node in the network. ‘E’ denotes the total amount of energy utilized for transmission and reception of packets from source node to the sink node.
A threshold value is used on communication between the nodes denoted as ‘dth’. When the distance between transmitter and receiver is less than ‘dth’, then free space channel model is employed otherwise multi path fading channel model is used. The energy efficient wireless body area network communication process using binomial probability distribution is shown in Figure 2. Figure 2 explains the flow processing diagram of Binomial Probability Distribution with QoS Support (BPD-QoSS) Technique. From figure, the energy consumption is minimized and network lifetime is increased by Binomial Probability Distribution. The energy efficient routing is carried out while transmitting the packets to the sink node from the source node with better throughput.

Figure 2: Binomial probability distribution with QoS Support (BPDQoSS) technique.
The first step in design of BDP-QOSS technique is used to group the high energy node using Binomial Probability Distribution. Clustering technique is used to reduce the energy consumption by distributing load between sensor nodes of network. The technique also increases the network lifetime. In clustering, higher energy nodes in the network are grouped. The probability of all nodes to become cluster head is not same at initial stage. CHs are selected because of varying probability. The cluster head is selected using binomial probability density function of X expressed as,
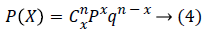
From Eq. (4), P(X) is probability of successes in n binomial trials, ‘n’ represents number of trials for selecting cluster head. ‘p’ denotes the probability of success in cluster head selection at first trial. ‘q’ represents the probability of failure in cluster head selection at first trial. After selecting the cluster head, the collected healthcare data are sent to the CH where the data gets aggregated and processed. After the processing step, the necessary healthcare data packets are sent to the sink node. This type of data transmission reduces the energy consumption and therefore increases the network lifetime. The algorithmic description of Binomial Probability Distribution with QoS Support (BPD-QoSS) Technique is given below.
Input : Number of sensor nodes SN1,SN2,…,SNn
Output : Minimum energy consumption and Prolong network lifetime
Step 1: Begin
Step 2: For distributed Sensor node SN1,SN2,…,SNn
Step 3: Evaluate the energy consumed at transmitter and receiver end using (1) and (2)
Step 4: Evaluate the total energy consumed by particular node using (3)
Step 5: Group the higher energy nodes after calculating the energy consumption rate of particular node
Step 6: Select the cluster head by binomial probability density function using (4)
Step 7: Route the healthcare data packets to the sink node through cluster head
Step 8: End for
Step 9: End
The above algorithmic description explains efficient routing performed by cluster head while sending the healthcare information data packets to the sink node. Binomial probability density function is used to select the cluster head in the cluster. After that, the healthcare data packets are sent to the sink node. Binomial Probability Distribution with QoS Support (BPDQoSS) Technique helps in reducing the energy consumption with higher throughput and increases the network lifetime while routing the healthcare data packets to the sink node.
Experimental Settings
Binomial Probability Distribution with QoS Support (BPDQoSS) Technique is implemented in NS-2 simulator with network range of 1000 m*1000 m size. The wireless body sensors monitor the patient’s activities. The simulation time taken for single process is 25 milliseconds. In Random Way Point (RWM) model, each sensor node moves independently in any direction in network range. RWM uses number of sensor nodes for forming the network model. Dynamic Source Routing (DSR) routing protocol is used in WBANs with predefined information. The position with randomly selected speed comprises predefined quantity and speed count. The simulation results are obtained from many configurations with multiple runs. Table 1 demonstrates the simulation parameters used for conducting the experimental work.
| Parameter | Value |
|---|---|
| Simulator | NS-2.31 |
| Network Coverage area | 1000 m * 1000 m |
| Mobility framework | Random Way point model |
| Node movement (i.e, speed) | 25 m/s |
| Number of nodes | 50,100,150,200,250,300,350,400,450,500 |
| Packet size | 10,20,30,40,50,60,70,80,90,100 |
| Connected Path link | Multi direction |
| Packet rate | 8 packets/seconds |
| Routing protocol | Dynamic source routing protocol (DSR) |
Table 1. Simulation parameters.
Simulation Result and Analysis
Binomial Probability Distribution with QoS Support (BPDQoSS) Technique is compared against with existing Gateway Selection Algorithm (GSA) and Mobility-supporting Adaptive Threshold-based Thermal-aware Energy-efficient Multi-hop ProTocol (M-ATTEMPT). The BPD-QoSS model conducts experimental works on following factors:
1. Energy consumption rate,
2. Network Lifetime and
3. Throughput
Impact of energy consumption
Energy consumption for routing the healthcare data packet from source to sink node is measured. The energy consumption is formulated as given below.
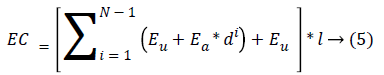
From Eq. (5), the energy consumption ‘EC’ denotes total amount of energy utilized for transmission and reception of healthcare data packets from source node to the sink node. di represents the distance between the ith node and (i+1)th node in network. ‘Eu’ represents the energy utilization because of the digital coding, inflection, filtering, and diffusion of signal, etc. Energy consumed by power amplifier is represented as ‘Ea’. Packet size is denoted as ‘l’. The consumption of energy is measured in terms of Joules (Table 2).
| Number of Nodes (Number) | Energy Consumption (Joules) | ||
|---|---|---|---|
| BPD-QoSS Technique | GSA | M-ATTEMPT | |
| 50 | 151 | 211 | 275 |
| 100 | 165 | 224 | 284 |
| 150 | 179 | 236 | 293 |
| 200 | 193 | 241 | 307 |
| 250 | 205 | 253 | 315 |
| 300 | 216 | 261 | 327 |
| 350 | 227 | 276 | 339 |
| 400 | 239 | 284 | 351 |
| 450 | 252 | 298 | 368 |
| 500 | 263 | 312 | 384 |
Table 2. Tabulation for energy consumption.
The above table illustrates the energy consumption measurement based on the number of nodes varies from 50 to 500. RWM moves the nodes in all direction without any centralized control. From the table, it is clear that the proposed BPD-QoSS Technique provides the better performance than the existing GSA [1] and M-ATTEMPT [2].
Figure 3 describes the energy consumption for sending the healthcare data packets in WBAN to the sink node. The path link gets connected in multi-direction manner. As described in figure, the energy consumption is directly proportional to the number of nodes. When number of nodes gets increased, energy consumption also gets increased. The BPD-QoSS Technique consumes less energy compared to GSA [1] and MATTEMPT [2]. Binomial probability density function is used for reducing the energy consumption. Moreover, the energy consumed in BPD-QoSS Technique for sending the packet from source node to sink is 25% and 57% lesser when compared to GSA [1] and M-ATTEMPT [2] respectively.

Figure 3: Measure of energy consumption.
Impact of network lifetime
The lifetime of network is identified by number of sensor nodes in wireless body area network. It is measured in terms of percentage (%).
The network lifetime is expressed as given below.
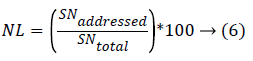
From Eq. (6), the network lifetime ‘NL’ is ratio of the sensor node addressed ‘SNaddressed’ in WBAN to the total number of sensor nodes ‘SNtotal’ in the network. Higher the network lifetime, more efficient the method is said to be (Table 3).
| Number of Nodes (Number) | Network Lifetime (%) | ||
|---|---|---|---|
| BPD-QoSS Technique | GSA | M-ATTEMPT | |
| 50 | 78 | 65 | 61 |
| 100 | 79 | 67 | 63 |
| 150 | 82 | 69 | 66 |
| 200 | 85 | 70 | 68 |
| 250 | 87 | 72 | 69 |
| 300 | 89 | 75 | 71 |
| 350 | 91 | 78 | 74 |
| 400 | 94 | 81 | 77 |
| 450 | 96 | 83 | 79 |
| 500 | 97 | 85 | 82 |
Table 3. Tabulation for network lifetime.
The above table illustrates the network lifetime measurement based on the number of nodes varies from 50 to 500. From the table, it is clear that the proposed BPD-QoSS Technique provides the better performance than the existing GSA [1] and M-ATTEMPT [2].
Figure 4 describes the network lifetime for sending the healthcare data packets to the sink node in WBAN. From figure, when number of sensor nodes increases, the network lifetime gets increased correspondingly. The BPD-QoSS Technique consumes less energy and therefore increases the network lifetime compared to GSA [1] and M-ATTEMPT [2]. In the proposed BPD-QoSS Technique, the sensor nodes are grouped and the energy consumption of particular nodes is calculated. The energy consumption in BPD-QoSS Technique is less that resulted in improving the network lifetime. In addition, the network lifetime in BPD-QoSS Technique is 15% and 19% higher when compared to GSA [1] and M-TTEMPT [2] respectively.

Figure 4: Measure of network lifetime.
Impact of throughput
Throughput is defined as the rate of successful data packets delivery over period of time interval in WBAN. Throughput rate is the ratio of data packets sent by the source node to sink node with respect to time. It is measured in terms of bits/sec and is formulated as given below.
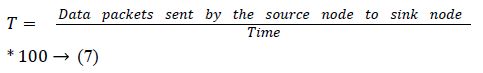
From (7), the rate of throughput ‘’ is measured using the data packets sent and time. Higher the data packets being received, more efficient the method is said to be (Table 4).
| Packet size (KB) | Throughput (bps) | ||
|---|---|---|---|
| BPD-QoSS Technique | GSA | M-ATTEMPT | |
| 10 | 8 | 6 | 5 |
| 20 | 18 | 15 | 12 |
| 30 | 26 | 23 | 20 |
| 40 | 38 | 31 | 28 |
| 50 | 46 | 43 | 36 |
| 60 | 57 | 52 | 48 |
| 70 | 66 | 61 | 57 |
| 80 | 75 | 72 | 70 |
| 90 | 86 | 81 | 79 |
| 100 | 94 | 90 | 86 |
Table 4. Tabulation for throughput.
The above table illustrates the throughput measurement based on the packet size varies from 10 to 100. From the table, it is clear that the proposed BPD-QoSS Technique provides the better performance than the existing GSA [1] and MATTEMPT [2].
Figure 5 describes the throughput for sending the healthcare data packets to the sink node in WBAN. The efficient model transmits normally eight packets per second. From figure, when number of packets increases, the throughput gets increased correspondingly. The BPD-QoSS Technique has higher throughput when compared to GSA [1] and MATTEMPT [2]. In proposed BPD-QoSS Technique after calculating the energy consumption of each node, binomial probability density function is used to select the cluster head through which the healthcare data packets are sent to the sink node. Throughput in BPD-QoSS Technique is higher because of selection of cluster head and sending the healthcare data packets through cluster head. In addition, the throughput in BPD-QoSS Technique is 10% and 19% higher when compared to GSA [1] and M-TTEMPT [2] respectively.

Figure 5: Measure of throughput.
Conclusion
Binomial Probability Distribution with QoS Support (BPDQoSS) Technique is designed to reduce the energy consumption and to extend the network lifetime of sensor nodes. The main goal of BPD-QoSS technique is to prolong the lifetime of network by choosing the reliable cluster head for routing the healthcare packets from source to sink. Cluster head is chosen by binomial probability density function based on the energy consumption of sensor node. Using NS-2 simulator, the BPD-QoSS Technique is compared with the existing works like GSA [1] and M-TTEMPT [2] and the results illustrated that the BPD-QoSS Technique increases the throughput and network lifetime in WBAN. The simulation results show that BPD-QoSS Technique offers better performance with an improvement of energy consumption by 41% and increased the network lifetime by 17% compared to GSA [1] and M-TTEMPT [2] respectively.
References
- Bayilmis C, Younis M. Energy-aware Gateway Selection for Increasing the Lifetime of Wireless Body Area Sensor Networks. J Med Syst 2012; 36: 1593-1601.
- Javaid N, Abbas Z, Fareed MS, Khan ZA, Alrajeh N. M-ATTEMPT: A New Energy-Efficient Routing Protocol for Wireless Body Area Sensor Networks. Procedia Comput Sci 2013; 19: 224-231.
- Abdullah A, Ismael A, Rashid A, Abou-ElNour A, Tarique M. Real Time Wireless Health Monitoring Application Using Mobile Devices. Int J Comput Networks Commun 2015; 7: 13-30.
- Khan ZA, Sivakumar S, Phillips W, Robertson B, Javaid N. QPRD: QoS-Aware Peering Routing Protocol for Delay-Sensitive Data in Hospital Body Area Network. Mobile Informa Syst 2015.
- Ibarra E, Antonopoulos A, Kartsakli E, Rodrigues JJPC, Verikoukis C. QoS-Aware Energy Management in Body Sensor Nodes Powered by Human Energy Harvesting. IEEE Sensors J 2016; 6: 542-549.
- Raja KS, Kiruthika U. An Energy Efficient Method for Secure and Reliable Data Transmission in Wireless Body Area Networks Using RelAODV. Wireless Personal Commun 2015; 83: 2975-2997.
- Tsouri GR, Prieto A, Argade N. On Increasing Network Lifetime in Body Area Networks Using Global Routing with Energy Consumption Balancing. Sensors 2012; 12: 13088-13108.
- Palanisamy T, Krishnasamy KN. Bayes Node Energy Polynomial Distribution to Improve Routing in Wireless Sensor Network. PLoS ONE 2015; 10: 1-15.
- Javaid N, Ahmad A, Nadeem Q, Imran M, Haider N. iM-SIMPLE: iMproved stable increased-throughput multi-hop link efficient routing protocol for Wireless Body Area Networks. Comput Human Behavior 2015; 51: 1003-1011.
- Zhou X, Zhang T, Song L, Zhang Q. Energy Efficiency Optimization by Resource Allocation in Wireless Body Area Networks. IEEE 79th Vehicular Technology Conference (VTC Spring), 2014.
- Yi C, Wang L, Li Y. Energy Efficient Transmission Approach for WBAN Based on Threshold Distance. IEEE Sensors J 2015; 15: 5133-5141.
- Rasheed MB, Javaid N, Imran M, Khan ZA, Qasim U, Vasilakos A. Delay and energy consumption analysis of priority guaranteed MAC protocol for wireless body area networks. Springer, Wireless Networks, 2015.
- Al-Masud SMR. QoS Taxonomy towards Wireless Body Area Network Solutions. Int J Appl Innovat Eng Manag 2013; 2: 221-234.
- Movassaghi S, Abolhasan M, Lipman J, Smith D, Jamalipour A. Wireless Body Area Networks: A Survey. IEEE Commun Surveys Tutorials 2014; 16: 1658-1686.
- Porxas AX, Liny SC, Luoz M. QoS-Aware Virtualization-Enabled Routing in Software-Defined Networks. IEEE Int Conference Commun 2015.
- Liao Y, Leeson MS, Higgins MD, Bai C. Analysis of In-to-OutWireless Body Area Network Systems: Towards QoS-Aware Health Internet of Things Applications. Electronics 2016.
- Hu L, Zhang Y, Feng D, Hassan MM, Alelaiwi A, Alamri A. Design of QoS-Aware Multi-Level MAC-Layer for Wireless Body Area Network. J Med Syst 2015.
- Khan ZA, Sivakumar S, Phillips W, Robertson B. ZEQoS: A New Energy and QoS-Aware Routing Protocol for Communication of Sensor Devices in Healthcare System. Int J Distributed Sensor Networks 2014.
- Dinkar P, Gulavani A, Ketkale S, Kadam P, Dabhade S. Remote Health Monitoring using Wireless Body Area Network. Int J Eng Adv Technol 2013; 2: 90-95.
- Liu Z, Liu B, Chen C, Chen CW. Energy-efficient Resource Allocation with QoS Support in Wireless Body Area Networks. IEEE Global Communications Conference (GLOBECOM), 2015.