ISSN: 0970-938X (Print) | 0976-1683 (Electronic)
Biomedical Research
An International Journal of Medical Sciences
Research Article - Biomedical Research (2018) Computational Life Sciences and Smarter Technological Advancement: Edition: II
Bat imperialist competitive algorithm (BICA) based feature selection and genetic fuzzy based improved kernel support vector machine (GF-IKSVM) classifier for diagnosis of cardiovascular heart disease
DOI: 10.4066/biomedicalresearch.29-17-821
Visit for more related articles at Biomedical ResearchNowadays rate of death is increased due to the rapid growth of cardiovascular diseases. Due to the above reason, diagnosing the cardiovascular heart disease becomes very important in medical field. The subset features which are considered as vital role in disease diagnosis are identified for the same disease in modern medicine. Currently, many data mining techniques related to different types of heart disease diagnosis were presented by several authors. Existing methods mainly concentrated on high accuracy and less time consumption and it uses many different types of data mining techniques. This work consists of three major steps such as missing data imputation, high dimensionality reduction or feature selection and classification. The above steps are performed using a dataset called cardiovascular heart disease dataset with 500 patients and 14 features and it utilizes several effective features. Because of incomplete data collections Real time datasets often reveal unaware missing feature’s patterns. First step consists of the Expectation Maximization (EM) algorithm which fits an independent component model of the data. This increases the possibility of performing Modified Independent Component Analysis (MICA) on imperfect observations. Bat Imperialist Competitive Algorithm (BICA) based feature selection method is proposed to improve the dataset. BICA is an evolutionary algorithm which is based on the development of human's socio-political. In this algorithm an m number of features and the N number of cardiovascular heart disease observations are used as initial population which is called as countries. A classification approach is introduced with Genetic Fuzzy based Improved Kernel Support Vector machine (GF-IKSVM) classifier and a BICA based feature selection for the classification of cardiovascular heart disease dataset. BICA is used for feature selection methods to reduce number of features which indirectly decreases the important diagnosis tests required to the patients. The proposed method achieves 94.4% accuracy, which is higher than the methods used in the literature. This GFIKSVM classifier is well-organized and provides good accuracy results for cardiovascular heart disease diagnosis.
Keywords
Classification, Data mining, cardiovascular diseases, Genetic fuzzy based improved kernel support vector machine (GF-IKSVM), Modified independent component analysis (MICA).
Introduction
Data mining is mainly concentrates on getting some hidden information from data. By using single or several datasets the patterns and relationships among large amount of data can be extracted. Various applications such as crime detection, risk evaluation and market analysis use data mining. In banking, insurance and marketing data mining is the main concept which reduces costs, and increases profits [1]. In medical science also, data mining deals with large amount of data and it is used to create different clinical reports and other patient symptoms. Thus data mining can also be used in medical datasets also. From this it is clear that unknown information in medical datasets is used in diagnosis of diseases. Though, medical datasets are generally isolated, heterogeneous, and large number in nature. If these datasets will be ordered and incorporated with the hospital management systems, it will be useful to many patients.
Around world heart attack will be the main reason for many deaths and if it will be detected earlier, it is possible to detect the disease and save several people’s life. Data is generated by medical practitioners with the help of hidden information in the dataset, and it’s not appropriately used well for predictions. Because of the above reasons, many researchers create many algorithms to convert the unused data into a dataset for modeling with the help of different data mining techniques. It is a great challenge to many medical practitioners to forecast the heart disease before they affect the patients. Features which are being considered as a main cause for heart attacks are smoking, lack of physical exercises, high blood pressure, high cholesterol, unhealthy diet, harmful use of alcohol, and high sugar levels.
Many people die because of the cardiovascular diseases [2] which are to be reduced. Based on the survey taken by the world health organization, more than 12 million deaths occur every year due to heart diseases. It is considered as incurable disease in India and it causes maximum sufferers. Coronary heart, cerebrovascular (Stroke), hypertensive heart, congenital heart, peripheral artery, rheumatic heart, inflammatory heart disease come under Cardio Vascular Disease (CVD). Especially about 25% people died in India at age between 25 to 69 y because of heart disease. 32.8% people died in urban areas occur because of heart ailments, while this percentage in rural areas decreases to 22.9%. So the diagnosis of this disease is a complicated process. These diseases should be diagnosed and treated accurately and correctly. Due to the lack of the potential of the medical experts and their unavailability at certain places become high risk to the patients. Usually, it is diagnosed using perception of the medical specialist. If the techniques are combined with the medical information system it will be more advantageous one to the society. At present, angiography is used to find out the problem in heart vessels. Due to the cost and several side effects, many researchers have used different types of data mining technique for heart attack diagnosis. With the use of computer based information or decision support systems, the accurate diagnosis of diseases are possible with low cost [2]. Different features and algorithms have been used in the various literatures.
Rajkumar and Reena [3] proposed supervised machine learning algorithms such as decision tree and Naïve Bayes algorithms for classification of heart disease. They tested their algorithm using UCI dataset and achieved accuracy upto 52.33%. They considered cardiomyopathy and Cardiovascular diseases are used in the classification of heart diseases. The main reason of heart disease is the decreasing of blood and oxygen supply to the heart. Accuracy and time taken to build the algorithm are considered as a main parameter for the analysis of proposed method.
For medical decision support systems Polat and Gunes [4] proposed a hybrid approach which is based on feature selection, fuzzy weighted pre-processing and Artificial Immune Recognition System (AIRS). In this work the UCI machine learning database such as the heart disease and hepatitis disease datasets are used and it is taken from breast cancer, diabetes, and liver disorders samples. The proposed approach consists of three stages. In the first stage, the dimension reduction of heart disease and hepatitis disease datasets from 13 and 19 to 9 is achieved by using the C4.5 decision tree algorithm (CBA) based Feature Selection (FS) method. At next stage, normalization of heart disease and hepatitis disease datasets is done in order to convert the data into the range of (0,1) and are weighted via fuzzy weighted pre-processing. Finally, AIRS classifier is used to classify the obtained values from fuzzy weighted pre-processing. The proposed diagnosing system of Coronary Artery Disease (CAD) achieves the accuracy of 92.59% and it is considered as best accuracy so far.
Yan et al. [5] introduced a multilayer perceptron-based decision support system which is used to diagnose the heart diseases. This system consists of 40 input variables in the input layer. Those variables are divided into four groups and then encoded using the proposed coding schemes. A cascade learning process is used to determine the number of nodes in the hidden layer. The output layer consists of 5 nodes which correspond to one heart disease of interest. The missing data of a patient are dealt using mean method. Training of data is done through an improved back propagation algorithm. The system is trained and tested by using 352 patient’s medical data which consists of five different heart diseases. Three assessment methods such as cross validation, holdout and bootstrapping, are applied to evaluate the system. The results show that the proposed MLP-based decision support system provided best diagnosis accuracy (>90%).
Das et al. [6] proposed introduced SAS base software 9.1.3 for diagnosing the heart related disease. The proposed system consists of neural network based ensemble method which combines posterior probabilities or the predicted values of multiple predecessor models and then creates new models. The created models will be more effective. Different experiments are performed and classification accuracy of 89.01% is obtained by using Cleveland heart disease database. It is also obtained 80.95% and 95.91% sensitivity and specificity values, respectively, in heart disease diagnosis.
Many experiments were conducted in the year of 2010 for creating new predictive model for the Ischemic Heart Disease (IHD); this model consists of Back-Propagation Neural Network (BPNN), the Bayesian Neural Network (BNN), the Probabilistic Neural Network (PNN) and the Support Vector Machine (SVM) [7]. Those methods are used to enlarge classification models for IHD patient datasets. The dataset consists of cardiac magnetic field at 36 locations (6 × 6 matrices). The result shows 78.43% accuracy with the BPNN and BNN. But RBF kernel SVM provided the classification accuracy of 60.78%. BNN presented the best sensitivity of 96.55% and RBF kernel SVM displayed the lowest sensitivity of 41.38%. Both polynomial kernel SVM and RBF kernel SVM presented the minimum and maximum specificity of 45.45% and 86.36%, respectively.
Pattern recognition and data mining techniques [8] are used as risk prediction models in the clinical domain of cardiovascular medicine. The data is modeled and classified with classification data mining technique. Limitations of the conventional medical scoring systems are the usage of intrinsic linear combinations of variables in the input set. This limitation is used in this research by use of classification models which can identify complex nonlinear relationships between dependent and independent variables as well as the capability to notice all possible interactions between predictor variables.
Acute Coronary Syndrome (ACS) is considered as clinical signs and symptoms; interpreted as the result of cardiac ischemia; or abruptly decreased blood flow to the heart muscle. The ACS has some subsection such as Unstable Angina (UA) and Myocardial Infarction (MI) [9]. Acute MI is the main reason for death for both men and women in the world. Several data mining studies have processed in different types of patient data in order to generate models in order to estimate the strictness of an ACS. In many cases; the data is based on Electrocardiograms (ECGs). In this preliminary study; a unique ACS database is analysed with 28 featuring variables which include chronic conditions; risk factors; and laboratory results as well as classifications into MI and UA. Different types of feature selection and supervised learning algorithms such as Adaboost, Bagging, and Naïve Bayes algorithms are used to achieve 71% accuracy.
Shouman and Turner [10] used C4.5 decision tree for CAD diagnosis and used reduce error pruning, which results 84.1% accuracy. Gini index and information gain are two types of decision trees that are rarely used in the diagnosis of heart disease. Other discretization techniques like voting method, and reduced error pruning are known to create more accurate decision trees. By applying a range of techniques to different types of decision trees it is easy to find better performance in heart disease diagnosis. Some of the benchmark data set is also used. The performance such as sensitivity, specificity, and accuracy of the alternative decision trees is evaluated. The research proposes a model that outperforms J4.8 decision tree and bagging algorithm in the diagnosis of heart disease patients.
Dalakleidi et al. [11] proposed a hybrid approach based which combines both Genetic Algorithm (GA) and a nearest neighbour’s classifier for the selection of the clinical features which are related to the incidence of fatal and non-fatal Cardiovascular Disease (CVD) in patients with Type 2 Diabetes Mellitus (T2DM).
Existing studies do not has some main steps like missing data imputation, feature selection and rule pruning which will improve the accuracy of the classifier. In this work the above steps also added during classification. The commonly used features are cardiac troponin I, high fatty diet and high sensitive C reactive protein in blood troponin T. These features are considered to increase classification accuracy of CVD, while discovering effect of features on CVD. A new feature selection method is used to discriminative features to the patients’ records which have a significant impact on prediction ability of the algorithms. The rest of this paper is organized as follows: The dataset is introduced in Section 2. Section 3 describes the technical aspects of the used data mining methods. The experimental results are discussed in Section 4, and finally Section 5 concludes the paper and discusses some future research directions.
Cardiovascular Heart Disease Dataset
In proposed work, the dataset contains 14 features of 500 patients. Based on the medical literature [12] which has already proposed, all the above features are good indicators of CVD. Yet, in CVD diagnosis some of the features have never been used in data mining approaches. The features are given in two groups: demographic, symptom and examination. Table 1 presents Heart dataset features and their valid ranges. Each patient will fall in two possible categories CVD or Normal. A patient is classified as CVD, if his/her diameter narrowing is greater than or equal to 50%, and otherwise as Normal [12,13]. Some of the features shown in the table are also used in proposed system: BMI identifies Body Mass Index, CPK is history of diabetes, cardiac troponin I is current level of troponin, homocysteine is history of CVD.
| Feature type | Feature name | Range |
|---|---|---|
| Demographic | Age | 25-80 |
| Gender | M or F | |
| Body Mass Index (BMI) | 25-40 | |
| Creatine Phosphokinase Kinase (CPK) MB | 25-70 | |
| Smoking | Yes, No | |
| Symptom and examination | Pulse rate | 70-90 |
| Sugar | 110-350 | |
| Stress | Yes, No | |
| High fatty diet | Yes, No | |
| Homocysteine | True, false | |
| High sensitive C reactive protein in blood | Yes ,No | |
| Troponin | 0.01-0.02 | |
| Cardiac troponin I | 10-30 | |
| Alcohol | Yes, No |
Table 1. Features of cardiovascular heart disease dataset.
The Braunwald [13] heart book is used to improve the dataset by using the discretization ranges of some existing features that are provided in the book. These new features are indicated by index 2 and are depicted in Table 2. Experiments show that these features which have been drawn from medical knowledge could help the classification algorithms to achieve better results.
| Feature name | Low | Medium | High |
|---|---|---|---|
| Age | 25 | 40 | 55 |
| BMI-Kg/m2 | <19 | 22 | >25 |
| CPK MB | <25 | 25 | >25 |
| Pulse rate-ppm | <70 | 75 | >80 |
| Sugar-mmHg | <110 | 110-130 | >140 |
| Stress | Low | Medium | Very high |
| High fatty diet | Low | Medium | Very high |
| Homocysteine | Low | Medium | Very high |
| High sensitive C reactive protein in blood | Low | Medium | Very high |
| Troponin | <0.01 | 0.01 | >0.01 |
| Cardiac troponin I | <10 | 10 | >10 |
Table 2. Features of cardiovascular heart disease dataset.
Proposed Methodology
The proposed classification system is explained in this section clearly. The first step is an Expectation Maximization (EM) algorithm which fits a demonstration of independent components to the cardiovascular heart disease dataset samples. This improves the chance to carry out Modified Independent Component Analysis (MICA) on incomplete cardiovascular heart disease dataset samples observations. Also, a feature selection method is proposed to enhance the classification results. Then finally classification is performed using Genetic Fuzzy based Improved Kernel Support Vector Machine (GF-IKSVM) classifier.
Pre-processing using modified independent component analysis (MICA)
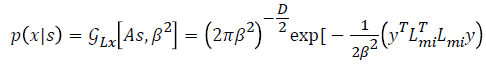
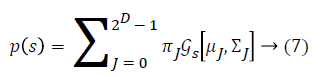
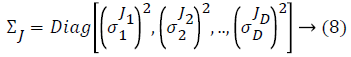
The used training set X={x1,... xN} in our proposed system has different types of cardiovascular heart disease dataset samples which represent normal and abnormal (heart disease). Each sample’s feature vector consists of positive numerical values and categorical values to represent the cardiovascular heart disease. The set of features generated from all data are assumed to be: F={f1,..fm}, m=14. F=(age, Gender, BMI, pulse rate ,sugar , CPK ,cardiac troponin I, alcohol, smoking, stress, high fatty diet, homocysteine, high sensitive C reactive protein in blood, troponin T). The set CL={cl1,...clP} is considered as P possible data classes, here P=2. MICA technique [14,15] is used to keep away from the missing or incomplete description of a sample in the dataset that belongs to one of the classes and it also represents cardiovascular heart disease dataset samples into independent factor analysis data, in the case of complete dataset. It completely depends on cardiovascular heart disease dataset dimensions. In order to deal with missing data imputation problem cardiovascular heart disease dataset samples are converted into two that are missing data and an observed dataXnT=(xnmi, xnob)T. This deviation depends on the cardiovascular heart disease dataset samples. For this missing data imputation problem need to define the following notations,


Where Lmi and Lob are formed after eliminating the columns
related to missing data and an observed data respectively. The missing data matrix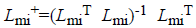 is the pseudoinverse
range of Lmi. Afterward the equations of MICA is
explained as follows,
is the pseudoinverse
range of Lmi. Afterward the equations of MICA is
explained as follows,

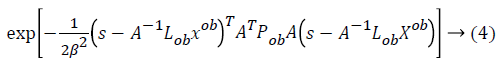
Where 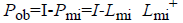 is considered as projection
operator that converts the missing data vectors into complete
dataset vector by the columns of Lmi. The experimentation
work uses the following properties for computation of Pob.
is considered as projection
operator that converts the missing data vectors into complete
dataset vector by the columns of Lmi. The experimentation
work uses the following properties for computation of Pob.

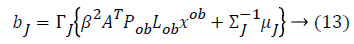
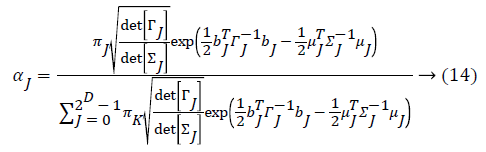
From this values then derive a posterior probability value using Bayes rule
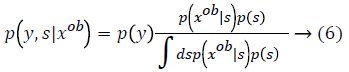
Here 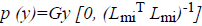 The remaining notations in the
Bayes rule is described as follows,
The remaining notations in the
Bayes rule is described as follows,
Some of the notations in the bayes rule are also described as follows,
From the above formula it is clear that the unfinished dataset samples are converted into full dataset samples XnT. In several applications Feature Selection (FS) is an important analytical study. It is also used in some development area such as retrieval of images, microarray technology, medical applications, genomic study, and document investigation. There are many feature selection methods are available, those are unsupervised, supervised and semi-supervised that have been proposed in the literature to improve the classifier’s results. According to the some definition feature selection process is usually consists of four major steps is shown in Figure 1.

Figure 1: General representation of feature selection process.
Figure 1 shows the generation procedure of selected attributes in each iteration. This step will be calculated in the second step of the selection procedure. This generation procedure either starts with an empty attribute set or with all attributes or with randomly selected attributes. In first two cases, features are summed with each other iteratively (forward selection) or removed (Backward selection) from the dataset. In some algorithms both concepts are combined and created a sequential forward floating selection technique in which this algorithm is applied after each Forward, Backward steps till the improvement of evaluation function is achieved. In next case, new attribute subsets are created randomly at each iteration. The random generation procedures search at random all 2n subset candidates, where n is the features count in the database. This procedure cannot stop the investigation when the subset’s evaluation function reached a local optimum. Though, the 2n subsets candidates are not all evaluated. Hence, maximum number of iterations is forced to make sure that computation time remains rational. In this research work Bat Imperialist Competitive Algorithm (AICA) is proposed to select features from cardiovascular heart disease dataset.
Bat imperialist competitive algorithm (BICA) for feature selection
The Imperialist Competitive Algorithm (ICA) has been proposed by Gargari and Lucas [16] which is not an inspired natural phenomenon. But it is a socio-human phenomenon. This algorithm has concentrated in the imperialism process as a human's socio-political evolution stage. In the ICA algorithm, the colonies move towards the imperialist with a random radius of movement. ICA is a latest evolutionary algorithm based on the human's socio-political evolution. It easily achieves local optimal problem [17] thus it is extended to get concept by introducing Bat algorithm. The algorithm starts with an m number of features and the N number of cardiovascular heart disease dataset initial population called countries. Some of the best features in the dataset population are selected to be the imperialists and the rest form the colonies of these imperialists. In an N dimensional optimization problem, a country is a 1 × N array. This array defined as follows,
Country=(p1,...pN)=Xij=(x1j,...xij) → (15)
The population cost is found by finding the objective function of the features. Then
Cij=f (countryi)=f (x1j,...xij) → (16)
In this algorithm N dataset samples are used and the Nimp is the best selected features with highest classification accuracy. The remaining countries are colonies that each belong to an empire. The colonies are distributed among imperialists proportionally; the normalized cost of an imperialist is defined as follow,
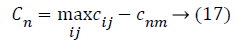
Where, cnm is the objective of nth imperialist with m features and Cnm is its normalized cost. From this normalized cost, the power value of each feature in the population is calculated based on the colonies isolated between populations.
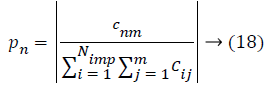
Then, the initial number of population of an empire will be defined as follows,
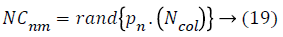
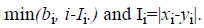
Where, NCnm is primary number of cardiovascular disease dataset samples of nth empire and Ncolis the number of all colonies (cardiovascular disease dataset samples). To allocate the cardiovascular disease dataset samples among imperialist, NCnm is selected randomly and is assigned to their imperialist. The absorption policy is shown in Figure 2 which represents the main concept of the algorithm and it makes the countries to move towards to their minimum optima. Equation 20 is used as a function to absorb these cardiovascular disease dataset samples (colonies) that has best selected features among the imperialists. The total accuracy value of each population is found by the accuracy value of its imperialists and colonies of the empire.

Figure 2: Moving colonies toward their imperialist.
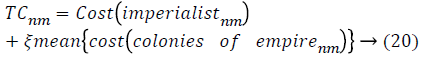
TCnm is the total accuracy value of the m features of the n dataset empire and ξ is the positive value which is considered to be less than one.
x~U (0, β × d) → (21)
In the absorption policy, the colony moves towards the imperialist by x unit. The track of movement is fully based on the vector from colony to imperialist, as shown in Figure 2, in this figure, the distance between the optimal features (imperialist) and colony is illustrated by d and x is a random variable by means of uniform distribution. Where β is equal to 2. In this implementation γ is respectively
θ~U (-γ, γ) → (22)
In AICA algorithm, the imperialistic competition have been become a major important step, in order to characterize this step, firstly we conclude the possessing probability of all the colonies with their empire based on the total cost.
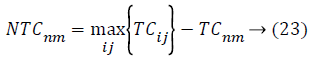
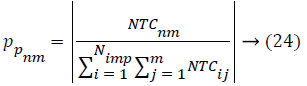
Where, TCij is the total cost of nth empire and NTCnm is the normalized total cost of nth empire. From this NTCnm control probability of each empire is computed as below,
All the empires except the most powerful one will give way and unique empire will control all the colonies. In the problem space the ICA algorithm suffers the lack of ability to search global optimum properly. Throughout the search process, the algorithm may catch into local optima and it is possible to get far from the global optima. This will make the early convergence, so universal process of Bat Algorithm (BA) is proposed for local search feature selection problem. Bat Algorithm (BA) [18] based on the echolocation activities of bats. The Bat algorithm bats use sonar echoes to search the local search with optimal features (highest accuracy) and keep away from obstacles. Sound pulses of bats are changed into a frequency which reflects from obstacles [19]. The pulse rate is usually defined as 10 to 20 times per second. The bats are using wavelengths that vary in the range from 0.7 to 17 mm or inbound frequencies of 20-500 kHz. The pulse frequency and the rate should be defined. The pulse rate can be simply determined in the range from 0 to 1, where 0 means that there is no emission and 1 means that the bats’ emitting is their maximum [19]. The bat behavior [19] used three generalized rules during implementation:
1. Features in the cardiovascular heart disease dataset use an echolocation to find the best feature and by considering their objective function (Cn) with their conditions.
2. While searching optimal features, the random features move randomly with velocity vi at dataset position xi with fixed frequency fmin, wavelength λ, loudness A0. Based on these value pulse emission rate r (0, 1) is adjusted automatically Cn.
3. Even if the loudness could be varied depending on Cn, at first it varies from a positive A0 to a minimum constant value Amin
Initialization is performed randomly. New population is generated with highest accuracy and features are moved as virtual bats according to the following equations:
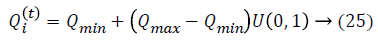
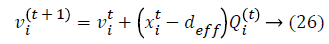
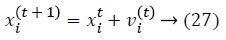
where U (0, 1) is a uniform distribution. A random walk with shortest utilization is used for finding the optimal and highest accuracy which modifies the current best optimal features solution related to following equation:

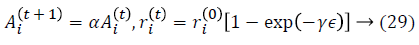
where ϵ is the scaling factor, and (Ait) the loudness. The local search is achieved with the proximity based on pulse rate ri.The rate of pulse emission ri increases and the loudness Ai decreases. Mathematically, these characteristics are captured with the following equations:
where α and γ are constants. Dimensionality reduction is achieved by using feature selection methods which are preprocessing steps used to reduce, remove irrelevant data. A classification approach is introduced to use Genetic Fuzzy based Improved Kernel Support Vector machine (GF-IKSVM) classifier and a BICA based feature selection is proposed for the classification of cardiovascular heart disease dataset samples. BICA is used for feature selection methods to reduce number of features which indirectly reduces the no. of diagnosis tests which are needed to be taken by a patient. In this work experimentation is done using on real time Tamil Nadu cardiovascular heart disease database.
Fuzzy logic for improved-SVM
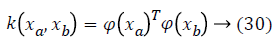
In order to avoid the crisp definition of a row in the cardiovascular heart disease dataset belonging to one of the classes, fuzzy technique is involved. Firstly, we will seek to divide the N into P classes and each dataset samples is converted as fuzzy values. The SVM learning process has the classification task, which offers the architecture and decision function parameters which are representing the largest margin. Those parameters are represented by the vectors in the class boundary and their associated Lagrange multipliers [20]. In order to take into account nonlinearities, a higher dimension space is obtained; this is done by transforming data vectors xin through a function φx. In this transformation, explicit calculation of φ (x) is not necessary; instead of that, just the inner product between mapped vectors is required. For this inner product, kernel functions fulfilling the Mercer condition are usually used. An example of a kernel function is given in Equation 25.
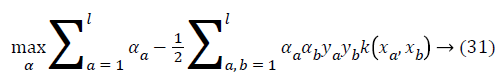


where ya yb are labels for data vectors a, b respectively and αi are the Lagrange multipliers with linear inequality constraints. The ζ parameter controls the misclassification level on the training data and therefore the margin. Once a solution is obtained, a decision rule used to classify data is defined as in Equation 33.
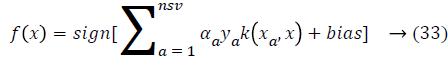
where nsv is the support vectors dimension, bias is the projection xi onto the hyperplane that separates the classes, and only non-zero αi for the decision rule. As a result, the data vectors are associated to these multipliers and those are called as support vectors. So there is a solution to separate the problem in smaller subproblems, which are easier to control and resolve. But, an important disadvantage of this approach is that data vectors are selected randomly to build sub problems that can affect the performance and it is providing an inferior learning rate. To solve this problem next section fuzzy rules are created for SVM classifier.
Genetic Fuzzy rules
After creation of fuzzy rules, rules are optimized using a double coding scheme. This double coding scheme is used for both rule selection CS and lateral tuning CT [21] is used.
In the Cs part, each chromosome is a binary vector that determines whether the rule is selected or not (alleles “1” and “0,” respectively). Considering the M rules that are contained in the candidate rule set, the corresponding part, i.e., Cs=(c1, ..., cM), represents a subset of rules composing the final RB so that IF ci=1 THEN (Ri RB) else (Ri RB), with Ri being the corresponding ith rule in the candidate rule set and RB being the final RB.
An actual coding is considered in CT part. This part is the combination of all the α parameters of each fuzzy partition. By considering the following number of labels per variable: (m1, m2,..., mn) with n being the number of system variables. Next, each gene is associated with the tuning value of the corresponding label: CT=(c11,..., C1m1,..., cn1,..., Cnmn).
At last, a chromosome C is coded in the following way: C=Cs CT. All the candidate rules are included in the population as an initial solution in order to use the rules. The initial pool is obtained with the first individual having all genes with value “1” in the Cs part and all genes with value “0.0” in the CT part. The remaining individuals are generated at random.
Chromosome evaluation: To estimate a particular chromosome based on a large number of rules, the classification rate and the following function are computed and maximized:
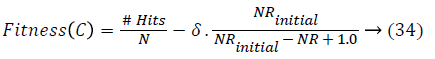
where #Hits is the number of patterns that are correctly classified, NRinitial is the number of candidate rules, NR is the number of selected rules, and δ is a weighting percentage given by the system expert that finds the tradeoff between accuracy and complexity. If there is minimum one class without selected rules or if there are no covered patterns, the fitness value of a chromosome will be penalized with the number of classes without selected rules and the number of uncovered patterns.
Crossover operator: The crossover operator will depend on the chromosome part where it is applied.
For the CT part, we consider the Parent Centric BLX (PCBLX) operator (an operator that is based on BLX-α). This operator is based on the concept of neighborhood, which allows the offspring genes to be around the genes of one parent or around a wide zone that is determined by both parent genes. Let us assume that X=(x1,..., xn), and Y=(y1,...,yn), where xi, yi (ai, bi) R, i=1,..., n, are two real-coded chromosomes that are going to be crossed. Generate the following two offspring.
 where o1i is a randomly (uniformly) chosen number from the interval
  with
with 
 and
and 
 where o1i is a randomly (uniformly) chosen
number from the interval
where o1i is a randomly (uniformly) chosen
number from the interval  with
with 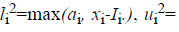
In the CS part, the half-uniform crossover scheme (HUX) is employed to interchange the mid of the alleles that are altered in the parents (the genes to be crossed are randomly selected from among those that are different in the parents). This operator ensures the maximum distance of the offspring to their parents (exploration).
The two from CT with the two from CS are combined to create four offspring. The two best offspring will be considered as two corresponding descendents. In order to do Gray code (binary code) with a fixed number of bits per gene (BITSGENE), the hamming distance is calculated between two individuals to apply the crossover operators. Example of the selected rules
If (BMI>25, Pulse rate>80, Homocysteine= High) then class C=1 else C=0.
If (Pulse Rate<60 or Pulse Rate>100, Alcohol=true) then C=1 else C=0.
If (BMI>25, Smoking=true, Sugar>140) or (BMI=25, Smoking=true, Pulse Rate>100) then C=1 else C=0.
If (Pulse Rate>100, Sugar>140, Alcohol=true) or if (Pulse Rate>100, Sugar>140, Stress=high) then C=1 else C=0.
If (Pulse Rate>100, Sugar>140, High fatty diet=true) or if (BMI>25, Sugar>140, Stress=high) then C=1 else C=0.
If (CPK>25, BMI>25, High fatty diet=true) or if (BMI>25, Pulse Rate>100, Alcohol=true) then C=1 else C=0.
If (Cardiac Troponin I>10, BMI>25, Stress=high0 or if (BMI>25, Sugar>140, Alcohol=true) then C=1 else C=0.
If (Troponin T>0.01, Pulse Rate>100, Homocysteine=high) or if (Pulse Rate>100, Sugar>140, Stress=high) then C=1 else C=0.
If (Troponin T>0.01, Pulse Rate>100, High sensitive C reactive protein in blood=true) or if (Pulse Rate>100, Sugar>140, Homocysteine=high) then C=1 else C=0.
If (CPK>25, BMI>25, Troponin T>0.01, Stress=high, High sensitive C reactive protein in blood=true) or if (BMI=25, Sugar>140, High sensitive C reactive protein in blood=true) then C=1 else C=0.
Restarting approach: In restarting procedure, the best chromosome is maintained, and the remaining is generated randomly. If the threshold value L is below zero the restart procedure is used. That means that all the individuals synchronized in the population. Then classification task of the dataset is performed and the results are conceived and it is presented in the next section.
Results and Discussion
The proposed work is implemented in MATLAB environment. MATLAB is mainly used for machine learning, data mining, text mining and business analytics. It is applied in the area of research, education, training and industrial applications. In this study, version 2013 of MATLAB is used. The experiments are designed so that the different parts of the work could be found. These different parts include the evaluation of the features of the dataset and the feature selection. In order to achieve this, first the features were selected by the feature selection method and their importance are discussed. Second, all the two possible combinations of the feature selection and classification methods are tested over the dataset. Finally, results techniques are presented in this section. Accuracy, sensitivity, and specificity are the most important performance measures in the medical field [22], which are commonly used in the literature. So these measurements are used to find the performance of algorithms.
Confusion matrix
A confusion matrix is a table that allows visualization of the performance of an algorithm. In a two class problem (with classes C1 and C2), the matrix has two rows and two columns that specifies the number of False Positives (FP), False Negatives (FN), True Positives (TP), and True Negatives (TN). These measures are defined as follows: TP is the number of samples of class C1 which has been correctly classified. TN is the number of samples of class C2 which has been correctly classified. FN is the number of samples of class C1 which has been falsely classified as C2. FP is the number of samples of class C2 which has been falsely classified as C1. Table 3 shows confusion matrix.
| Class | Actual class C1 | Actual class C2 |
|---|---|---|
| Predicted class C1 | True positive (TP) | False positive (FP) |
| Predicted class C2 | False Negative (FN) | True Negative (TN) |
Table 3. Confusion matrix.
Precision and recall
According to confusion matrix, precision and recall are explained as following,
Precision=TP/((TP+FP)) → (35)
Recall=TP/((TP+FN)) → (36)
Accuracy: Accuracy shows ratio of correctly classified samples to the total number of tested samples. It is defined as:
Accuracy=((TN+TP))/((TP+TN+FN+FP)) → (37)
F-measure: Harmonic mean value of the precision and recall is known as F-measure is defined as follows:
F-measure=(2 × P × R)/((P+R)) → (38)
Table 4 shows the results for the cardiovascular heart disease dataset and Figure 3 shows the performance comparison results of accuracy and error between existing and proposed algorithms for the cardiovascular dataset.
| Methods | F-measure | Precision | Recall | Accuracy | Error Rate (ER) |
|---|---|---|---|---|---|
| SVM | 92.82 | 94.382 | 91.3083 | 87 | 13 |
| ISVM | 94.431 | 95.79 | 93.11 | 89.759 | 10.241 |
| FISVM | 94.643 | 94.24 | 95.05 | 91.2 | 8.8 |
| GF-IKSVM | 97.021 | 97.228 | 96.815 | 94.4 | 5.6 |
Table 4. Results of the cardiovascular heart disease dataset.
From the experimental results it is explained that for the cardiovascular dataset the proposed GF-IKSVM algorithm performs 7.4% better than the SVM algorithm, 4.641% better than the ISVM algorithm and 3.2% better than the FISVM algorithm is illustrated in Figure 3. Proposed GF-produces 5.6% error value which is 3.2% lesser than the FISVM algorithm, 4.64% lesser than the ISVM algorithm and 7.4% lesser than the FISVM algorithm is illustrated in Figure 3. It concludes that the proposed GF-IKSVM algorithm produces higher accuracy value and less error rate when compared to all methods.

Figure 3: Accuracy and error results comparison of methods for the cardiovascular heart disease dataset.
From the experimental results it is concluded that TP rate for the cardiovascular dataset the proposed GF-IKSVM algorithm 2.846% better than the SVM algorithm, 1.438% better than the ISVM algorithm and 2.988% better than the FISVM algorithm is illustrated in Figure 4. Similarly FP rate for the cardiovascular dataset the proposed GF-IKSVM algorithm performs 1.765% better than the SVM algorithm, 3.705% better than the ISVM algorithm and 5.5067% better than the FISVM algorithm is illustrated in Figure 4. It is clear from the results that the proposed classifier produces less error results.

Figure 4: Precision and recall results comparison of methods for the cardiovascular heart disease dataset.
From the experimental results it is concluded that F-Measure for the cardiovascular dataset the proposed GF-IKSVM algorithm performs 4.201% better than the SVM algorithm, 2.59% better than the ISVM algorithm and 2.378% better than the FISVM algorithm is illustrated in Figure 5.

Figure 5: F-measure results comparison of methods for the cardiovascular heart disease dataset.
From the experimental results it is concluded that F-Measure for the cardiovascular dataset the proposed GF-IKSVM algorithm takes 4.53 s, whereas the FISVM algorithm takes 6.97 s, ISVM algorithm takes 7.83 s and SVM algorithm takes 8.63 s is illustrated in Figure 6. It concludes that the proposed GF-IKSVM performs quicker when compared to other methods.

Figure 6: Time comparison results of methods for the cardiovascular heart disease dataset.
Conclusion and Future Work
In this work, numerous algorithms were applied on the cardiovascular heart disease dataset and the results were discussed. The features used in this dataset are important of CVD and it is taken by using medical knowledge. Additionally, data mining techniques with feature selection and preprocessing were used to improve the accuracy. ICA method is proposed to overcome incomplete dataset problem. Then optimal features are selected using BICA evolutionary algorithm. As well, the features used in this study, can be calculated by using the objective function. Genetic Fuzzy based Improved Support Vector Machine (GF-ISVM) classifier is proposed in our work for optimisation of fuzzy rules. Fuzzy logic is introduced to create rules of a dataset belonging to one of the classes. The rules are fully based on the classes. Genetic Algorithm (GA) is used to perform fuzzy association rule extraction, candidate rule pre-screening, rule selection and lateral tuning. The accuracy value achieved in this study is higher than currently reported values in the literature. It was shown that significant improvement was gained over by using imputation methods. The GF-IKSVM is evaluated using the performance metrics precision, recall, and F-measure and classification accuracy. In future work it needs to propose cost sensitive algorithms for feature selection. At last, larger datasets, more features and also broader data mining approaches, could be used to achieve better and more interesting results.
References
- Witten IH, Frank E. Data mining: practical machine learning tools and techniques. Morgan Kaufmann 2005.
- David LO, Dursun D. Advanced data mining techniques. Springer-Verlag Berlin Heidelberg 2008.
- Rajkumar A, Reena GS. Diagnosis of heart disease using datamining algorithm. Glob J Comp Sci Technol 2010; 10: 38-43.
- Polat K, Gunes S. A hybrid approach to medical decision support systems: Combining feature selection, fuzzy weighted pre-processing and AIRS. Comp Meth Prog Biomed 2007; 88: 164-174.
- Bar-Cohe Y. Biologically inspired intelligent robots using artificial muscles. Int J Pharm Bio Sci 2003.
- Das R, Turkoglu I, Sengur A. Effective diagnosis of heart disease through neural networks ensembles. Exp Sys Appl 2009; 36: 7675-7680.
- Kangwanariyakul Y, Chanin N, Tanawut T, Thanakorn N. Data mining of magneto cardiograms for prediction of ischemic heart disease. EXCLI J 2010; 33: 82-95.
- Peter TJ, Somasundaram K. An empirical study on prediction of heart disease using classification data mining techniques. International Conference on Advances in Engineering, Science and Management 2012; 514-518.
- Lavesson N, Halling A, Freitag M, Odeberg J, Odeberg H, Davidsson P. Classifying the severity of an acute coronary syndrome by mining patient data. Swedish AI Society Workshop. IDA Linköping University, Linköping University Electronic Press 2009; 55-63.
- Shouman M, Turner T, Stocker R. Using decision tree for diagnosing heart disease patients. Proceedings of the Ninth Australasian Data Mining Conference 2011; 121.
- Dalakleidi KV, Zarkogianni K, Karamanos VG, Thanopoulou AC, Nikita KS. A hybrid genetic algorithm for the selection of the critical features for risk prediction of cardiovascular complications in Type 2 Diabetes patients. IEEE 13th International Conference on Bioinformatics and Bioengineering (BIBE) 2013; 1-4.
- Bonow RO, Mann DL, Zipes DP, Libby P. Braunwalds heart disease. Cardiovasc Med (9th edn.) Saunders New York 2012.
- Alizadehsani R, Habibi J, Hosseini MJ, Mashayekhi H, Boghrati R, Ghandeharioun A, Sani ZA. A data mining approach for diagnosis of coronary artery disease. Comp Meth Prog Biomed 2013; 111: 52-61.
- Hyvarinen A, Hurri J, Hoyer PO. Independent component analysis. Natural Image Statistics 2009; 151-175.
- Hyvarinen A, Karhunen J, Oja E. Independent component analysis. John Wiley Sons 2004; 46.
- Atashpaz-Gargari E, Lucas C. Imperialist competitive algorithm: an algorithm for optimization inspired by imperialistic competition. IEEE Congr Evol Comp 2007; 4661-4667.
- Bahrami H, Abdechiri M, Meybodi MR. Imperialist competitive algorithm with adaptive colonies movement. Int J Intel Sys Appl 2012; 4: 49.
- Sakthivel K, Jayanthiladevi A, Kavitha C. Automatic detection of lung cancer nodules by employing intelligent fuzzy C means and support vector machine. Biomed Res 2016.
- Das S, Suganthan PN. Differential evolution: A survey of the state-of-the-art. IEEE Transactions on Evolutionary Computation 2011; 15: 4-31.
- Winters-Hilt S, Yelundur A, McChesney C, Landry M. Support vector machine implementations for classification and clustering. BMC Bioinform 2006; 7: 1.
- Alcala-Fdez J, Alcala R, Herrera F. A fuzzy association rule-based classification model for high-dimensional problems with genetic rule selection and lateral tuning. IEEE Trans Fuzzy Sys 2011; 19: 857-872.
- Lavrac N. Selected techniques for data mining in medicine. Artificial Intel Med 1999; 16: 3-23.