ISSN: 0970-938X (Print) | 0976-1683 (Electronic)
Biomedical Research
An International Journal of Medical Sciences
- Biomedical Research (2015) Volume 26, Issue 4
Automated System for Ultrasound Hyperthermia Cancer Treatment based on POF Controller
Jeraldin Auxillia D*
St. Xavier’s Catholic College of Engineering, Chunkankadai,Nagercoil, Tamilnadu, India
- Corresponding Author:
- Jeraldin Auxillia D
St. Xavier’s Catholic College of Engineering Chunkankadai, Tamilnadu India
Accepted date: June 03 2015
Hyperthermia, the heating of cancerous tumors can improve the efficiency of cancer treatment when added as an adjuvant to Radio therapy and Chemotherapy. Main goal of this work is to design a periodic output feedback controller to control the power of ultrasound transducer so that uniform temperature distribution is maintained in the targeted tissues all through the hyperthermia treatment process. For this purpose first a tumor layer surrounded by muscle layer is modeled using Penne’s bio heat transfer equation and a higher order state space model to the bio heat transfer problem is obtained by finite difference method. In second step an experimental proto type for the above model is created using agar phantom which mimics the human tissue. Temperature response of the simulated model is compared with the experimental outcome to demonstrate the validity of simulated model. Now a periodic output feedback controller is designed for the simulated hyperthermia model. The performance of the controller is evaluated by framing a desired trajectory which meets the treatment goals of hyperthermia. Closed loop error norm and the open loop error norm are evaluated to prove the efficiency of the designed controller. Simulations are also done to show the robustness of the controller in spite of variation in blood perfusion. Simulations proved that hyperthermia system is robust to blood perfusion variation and the closed loop norm has improved more than 40% compared to open loop norm in certain perfusion cases.
Keywords
Hyperthermia, Blood perfusion, Periodic output feedback, Bio- heat transfer, ultrasound transducer.
Introduction
Cancer is a major hazard to human life. Hyperthermia the heating of cancerous tumors, can improve response rates when added as an adjuvant treatment to radiation therapy. Recent experiments on human subjects confirm that in cervical cancer and recurrent lesions of malignant melanoma the response rate is 53% and 28% for patients who received radiation only and the response rate has improved to 83% and 46% respectively for patients who received radiation in adjuvant with hyperthermia. Reoxygenation of the hypoxic tumor regions occur and become radiosensitive, when tumor temperature is raised to 40°C - 44°C for 30-60 min .The prime goal of an online hyperthermia controller is to maintain desired temperature of 43°C within the tumor while limiting temperatures outside the tumor to safe levels of < 40 °C from a baseline body temperature of 37°C [1].This goal must be met under the influence of variable blood perfusions, that lead to plant model mismatch [2]. Several control algorithms have been suggested for this purpose.
Formerly many researchers have developed automatic temperature controllers for various hyperthermia systems such as scanned focused & phased array ultrasound. Many control ideas in the range of basic PID [3], LQR controller [4], multipoint adaptive, more complex model predictive [2], Constrained Predictive Control [5], Minimum- Time Thermal Dose Control [6] and even recursive control procedure [7] were used to design the system. Due to complexity of human body and finite difference modeling the full order models developed were too large. Potocki and Tharp [8], Mattingly and Romer [1] and Marshal et. al [9] reduced the order of the hyperthermia system and designed controllers. But none of the designed controllers relay on reduced models for designing controller for higher order system, Lamba and Rao [10] showed that if a state feedback control is designed from the Davison [11] reduced model and applied to the higher order system it results in stable closed loop system but this necessitates the system state to be available for feedback.
In hyperthermia, it is essential to retain a homogeneous temperature in the tissue and tumor. If the distribution of temperatures within the tumor shows considerable dispersion about it mean value, treatment failures and complications are liable to occur i.e cold spots never reach therapeutic temperatures and so are not treated. Similarly hot spots lead to complications such as unbearable pain and ulceration of the overlying skin. So to have uniform temperature distribution it is sensible to measure the temperature at each node. As in hyperthermia all system states are not accessible for feedback it insists the need for estimator design, this makes the system complex and reduces system reliability. Hence, it is rather attractive to go for an output feedback design. The output feedback needs only the measurement of system output in contrast, to the state feedback which requires the knowledge of the states or a state estimator. In such a situation it is better to use periodic output feedback technique which requires the feedback of the output temperature signal only. Comparison to other techniques periodic output feedback is much simpler. The control signal is kept constant over few measurements and altered periodically.
Although the existing controllers are capable of satisfying the basic needs of on line hyperthermia system they claim for the need of estimator and the reduced order controller does not guarantee the closed loop stability for the higher order system. So in the proposed method an output feedback controller is designed for higher order discrete system via reduced order model. The benefits of the method are two folds, first the states of the system need not be estimated and secondly when the controller is placed in the closed loop with the higher order it guarantees the closed loop stability. This study is a first effort towards including an output feedback controller for hyperthermia system.
Materials
Tumor & Ultrasonic Field Modeling
A simple 1-D inhomogeneous tissue is modeled as a tumor layer surrounded by muscle layer on either side as in Figure 1.

Figure 1: One dimensional inhomogeneous tissue model
The bio heat transfer equation presents useful predictions to estimate the temperature distribution in hyperthermia .The thermal response of tissue is modeled using the Penne’s bio heat transfer equation [12].
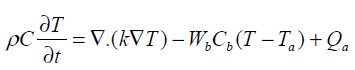 (1)
(1)
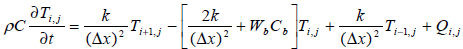
Arterial temperature Ta is assumed to be 37°C and Qa is the power deposited in the ultrasonically heated tissue. The heterogeneous tissue with tumor modeled in 1-D using Penne’s bio heat equation contains conduction effects, geometrical information on normal and diseased tissue. The parameter Wb characterizes the energy eliminated by conduction in the plane at right angles to the ultrasound axis.Table-1 summarize the thermal properties of human tissue.

Table 1: Thermal properties of human tissue.
Thermal conductivity is assumed to be constant and ‘x’ is the depth of penetration inside the tissue. In our model x varies from 0 to 13 cm and the boundary condition are assumed to be T (0, t) = Ta and T (L, t) = Ta. This is due to thermoregulation effect. In this paper we assume a single scanned focused ultrasound transducer with fixed characteristics .The power deposition term Qa is modelled as the energy deposited by scanned focused ultrasound transducer and given
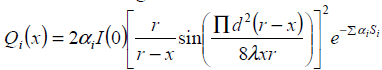 (2)
(2)
Where Qi (x), αi and Si are energy deposition, attenuation co-efficient and penetration length for layer ’r’ The transducer is positioned 17cm from the front edge of the tissue with r=25cm, d=70mm, l =1mm. Where I(0) is the average intensity over the radiating surface ‘d’ is the diameter of the transducer ’r’ is the radius of curvature and ‘x’ is the distance from the centre of the transducer
State Space Formulation
The numerical method finite difference is used for solving the partial difference equation of bio heat transfer.
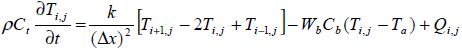 (3)
(3)
Assume 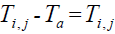 is the elevated temperature, where
  represents the temperature in the tissue and Ta arterial
temperature.
represents the temperature in the tissue and Ta arterial
temperature.
 (4)
(4)
The tissue model is split into 131 finite difference nodes .The temperature distribution in each node is known based on equation (4) and power deposition in each node is given according to equation (2).
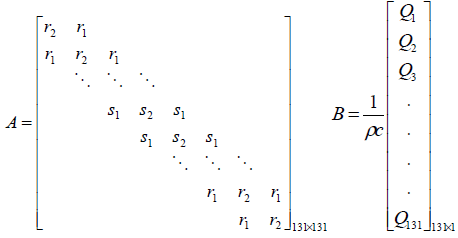
The system matrix A is a higher order tri-diagonal matrix
with non zero elements only on its main diagonal and upper
and lower diagonals. 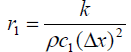 and
and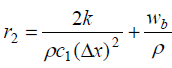 symbolizes the tri-diagonal elements of normal tissue and
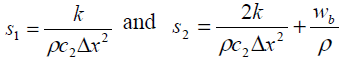 signify the tri-diagonal elements of tumor tissue respectively.
Here c1and c2 are tumor tissue specific heat capacity
and normal tissue specific heat capacity respectively
signify the tri-diagonal elements of tumor tissue respectively.
Here c1and c2 are tumor tissue specific heat capacity
and normal tissue specific heat capacity respectively
 (5)
(5)
The value Q in the input matrix B represents the spatial power deposition at each finite difference node. The output matrix C of the model is represented by the location of the sensor.
The value Q in the input matrix B represents the spatial power deposition at each finite difference node. The output matrix C of the model is represented by the location of the sensor.
Where A is a tri diagonal system matrix incorporating both conduction and perfusion terms and B is the input matrix. For 1-D case the state T is a vector of temperatures elevation in the nodes of the tissue model and U is I(0) a single manipulated variable. The position of the ultrasound transducers is fixed and the magnitude of the ultrasound power is the only manipulated variable.
Experimental Prototype
An experimental set up similar to that used by Arora et.al [13] was used for model validation and control experiments and is shown in Figure-2. An 1-D cylindrical agar phantom of length 13 cm and diameter of 1.27 cm was considered. Condensed milk was added to mimic the ultrasound absorption properties of human tissue [14]. Ultrasound field was generated by single focused ultrasound transducer resonating at a frequency of 2 MHz. The radius of curvature and diameter of the transducer are 25cm and 7cm respectively. The agar phantom and the ultrasound transducer are immersed in a bath of degassed water to simulate the cooling effect of blood and to avoid the disturbance caused by air bubbles. The RF signal generated by a RF signal source and RF amplifier were used to drive the transducer.

Figure 2. Temperature measurement in I-D Agar Phantom
The temperature in the agar phantom was measured by a manganin-constantan thermocouple fixed on it. These thermocouples give an accuracy of ± 0.2 °C in temperature measurement over the range of 35°C -55°C, thereby eliminating the errors caused by conduction. Signal conditioning circuits and A/D cards are used to acquire and monitor the temperature.
Methods
Control Objective and Constraints
For modeling and simulation purpose the desired temperature was fixed to 43°C within the tumor while limiting the temperature outside the tumor to safe levels of less than 40°C .The objective of the control algorithm is to track the step variations of the power input without overshoot, with a rise time varying between 6 min and 12 min (6 min < tr < 12 min) and to have a maximum settling time of 12 min. In addition to the above the constraint on the control signal is limited to Umax. Usually the maximum allowed power deposition is determined by hardware constraints or to avoid cavitations in tissues [2].
Periodic Output Feedback Control Technique
In periodic output feedback technique the input is changed several times in one output sampling instant .The poles of a controllable and observable system discretized at output sampling rate can be arbitrarily assigned by a piecewise constant periodic output feedback provided the number of gain changes during one output sampling interval [15,16,17].
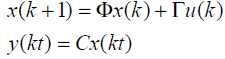
The system after sampling by Γ secs
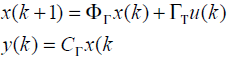 (6)
(6)
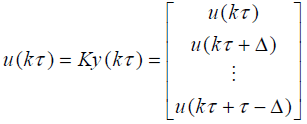
Assume (ΦΓ ,C) F is observable and (F ,G) G controllable with controllability indexg . Now the output sampling interval is divided into N subintervals of length Δ=Γ/N such that N ³ g . Thus the control law for POF controller is given as
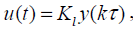
 (7)
(7)
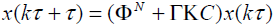
The sequence of N gains  generate a
time varying piecewise constant output feedback gains K(t) for 0 ≤ t ≤t .Sampling the simulated system by the
sampling interval Δ, the delta sampled system is represented
a
generate a
time varying piecewise constant output feedback gains K(t) for 0 ≤ t ≤t .Sampling the simulated system by the
sampling interval Δ, the delta sampled system is represented
a
 (8)
(8)
Define 
 (9)
(9)
A stabilizing output injection gain G0 is designed such that
the Eigen values of  lie inside the unit circle.
The periodic output gain K is calculated solving
lie inside the unit circle.
The periodic output gain K is calculated solving
ΓK=G0 (10)
Where 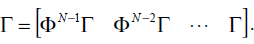
The closed loop dynamic of the system with POF gain can be given as
 (11)
(11)
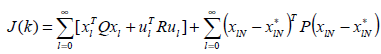
The POF controller obtained by this method requires only constant gains and hence easy to implement. A controller designed as above will give desired closed loop behavior, but strong oscillations exists between sampling instants .Werner proposed a performance index such that ΓK » Γ0 and ΓK=G0 need not be imposed [18]. This constraint is replaced by a penalty function, which makes it possible to enhance the closed loop performance, by permitting slight variation from the original design and at the same time improving the inter sample behavior. A tradeoff between the closed loop performance and the similarity to the chosen design is expressed by the quadratic performance index as stated below is minimized
 (12)
(12)
The state and input of the system are characterized as xl,
ul, respectively.  represents the state that would be
reached at the instant k=lN, given
represents the state that would be
reached at the instant k=lN, given  if k is solved to
satisfy GK = G exactly. Q, R and P are positive definite
symmetric matrices of appropriate dimensions. The first
term represents the state and the control energy of the
system and second term represents the penalty for the
deviation of the output injection gain from exact value
‘Go’. The POF gain calculated thus have very low magnitude
and is represented by K1 [19].
if k is solved to
satisfy GK = G exactly. Q, R and P are positive definite
symmetric matrices of appropriate dimensions. The first
term represents the state and the control energy of the
system and second term represents the penalty for the
deviation of the output injection gain from exact value
‘Go’. The POF gain calculated thus have very low magnitude
and is represented by K1 [19].
Desired Trajectory
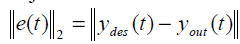
A function which gives the desired trajectory for temperature evaluation at each point in tumor and in normal healthy tissues is framed from the control objective of the treatment protocol. For each perfusion case the performance analysis is done by calculating the error norm. The error norm is calculated as the 2-norm of the difference between the desired trajectory and the achieved output trajectories.
 (12)
(12)
y des – Desired trajectory. yout- achieved output trajectory; e(t)- Error between the two temperature response.
Result and Discussions
System Simulation & Model Validation
Temperature predictions from the simulated model are validated with the measured temperature from the temperature measured by the manganin-constantan thermocouple and is shown in Figure -3. A step increase in ultrasound power of 7 watts was applied prior to the treatment session. To validate the simulated model with experimental reading the temperature is measured at a single spatial location at a distance of 2cm from the edge of the phantom by fixing a thermocouple. Total of 200 temperature data samples are recorded with the sampling time of 5 secs. The time temperature response at 20th node from the simulated mathematical model is also drawn and both were compared. Figure 3 shows the comparison between the experimental output and simulated output. This shows an accurate steady state prediction and there is a small error in the time constant of the response. The reason for this error is the Bio-heat transfer equation used for simulating the model is 1-D where as the agar phantom used is of diameter 1.25, the heat conduction in lateral direction would have contributed for the plant model mismatch created the error.

Figure 3: Comparison of measured temperature at 2cm in agar phantom and predicted model at 20th node
POF controller design for varying blood perfusion
Space discretization of the model gives rise to 131 nodes including the boundary nodes. During hyperthermia blood perfusion is the major variable that leads to parameter variation. Perfusion conditions applied in simulation are given as tumor perfusion WT and normal tissue perfusion WN. The typical values WT and WN used in hyperthermia system modeling ranges from a lower extreme of 0.5 kg/m3sec to a higher extreme of 10 kg/m3sec[20] . Four cases are considered with different combinations of WT and WN in this range, also simulations are also carried out by varying thermocouple locations. The open loop time temperature response is obtained by heating the tissue tumor model with constant applied power for 60min. Since it is a temperature process ‘τ 'is chosen to be 12secs. The original system is of 131 x131 orders. Since the system is too large for controller design the output feedback controller design for the original system is done via a reduced model of order 4. The number of gain changes in one sampling interval is fixed as N = 4. So Δ = Γ / N = 3sec s .
Temperature response for normal tissue location and tumor tissue location
The response of the system in case-1 is shown in Figure 4, The open loop step response, the closed loop response with output injection gain G0, the desired trajectory that meets the primary goal of hyperthermia are shown in Figure-4(a).The closed loop performance of POF controller after optimization procedure is in Figure-4(b) and the magnitude of the control effort needed to achieve this response is in Figure 4(c).The system dynamics without controller is not satisfactory and it does not meet the requirements of hyperthermia cancer treatments. The rate of temperature rise is very fast and this may lead to patient discomfort and pain stimulation. The prolonged settling time may cause hot spots and cold spots inside the tumor leading to decrease in treatment efficiency .This necessitates the need for a controller .The closed loop response with POF controller closely fallow the desired trajectory This will reduce the error norms of the closed loop system. The closed loop response with POF controller satisfies the requirements of standard hyperthermia. Although the simulations are done for 60mins the time axis is limited to 1000secs to show the effectiveness of the controller. Simulations are done for cases 2, 3 and 4 also but response is shown only for case-1.

Figure 4: Temperature response for the perfusion case-i (WT=0.5 kg/(m3sec) and WN =0.5 kg/(m3sec). with Thermocouple at normal tissue location (a) open loop and closed loop response with state feedback and desired trajectory (b) Closed loop response with Periodic Output Feedback Controller and desired trajectory (c) Control input as a function of time
The control structure can be varied by changing the thermocouple location. Now the thermocouple location is changed to X=50 i.e. in tumor tissue. According to the goals of hyperthermia temperature with in tumor tissue should be ≥43°C. Figure-5 shows the response for case-I with thermocouple location at X=50.

Figure 5: Temperature response for the perfusion case-i (WT=0.5 kg/(m3sec) and WN =0.5 kg/(m3sec). with Thermocouple at tumor tissue location (a) openloop and closedloop response with state feedback and desired trajectory (b) Closed loop response with Periodic Output Feedback Controller and desired trajectory (c) Control input as a function of time
Table 2 shows that the inclusion of piecewise constant periodic output feedback controller makes the system closed loop stable and also the norm of the error between the desired and the achieved trajectories for the open loop and the closed loop system. The shapes of the achieved trajectories show maximum consistency and the calculated error norms do not show significant deviation. The closed loop error norm is much less than the open loop error norm indicating the performance of the designed controller. Since the power deposition is more in the tumor region variation in tumor perfusion WT leads to a larger effect on the temperature field. To overcome the slow dynamics of the system higher control efforts are needed at the beginning. For a given power input decrease in blood perfusion causes an increase in system temperature. Table 3 shows the norm of error between the desired and achieved trajectories for varying blood perfusion in tumor tissue.

Table 2: Openloop and closed loop error norms with POF Controller for varying blood perfusion and the thermocouple located at normal tissue

Table 3: Open loop and closed loop error norms with POF Controller for varying blood perfusion and the thermocouple located at tumor tissue
Conclusion
Model validation results prove that the simulated model is a good approximation to the experimental prototype. Closed loop norms demonstrate the effectiveness of controller in achieving the goals of hyperthermia. It is found that the stabilizing controller designed from the reduced order model and applied to the higher order system performance and stability is guaranteed. Periodic output feedback controller developed is flexible and can be applied to hyperthermia models with changing blood perfusion leading to plant model mismatch. The suppression of fluctuations avoids hot spots and cold spots in tumor and surrounding tissues. The control effort is reduced by quadratic performance index optimization this avoids the controller saturation. For smaller perfusion rates the system settling time is longer. As the blood perfusion increases, it takes more heat away from the tissues and more control effort is needed to maintain a steady temperature. The output feedback controller effectively adjusts the power level of the ultrasound transducer according to the blood perfusion and other dynamic tissue properties to achieve controlled effective ultrasound hyperthermia. The results demonstrate that the periodic output feedback controllers are able to effectively track the target temperature with dynamic tissue properties. Achieving the desired trajectory leads to treatment precribability and this gives clinical acceptance to hyperthermia.
References
- Marshall Mattingly, Robert BR, Santhosh Devasia Exact temperature Tracking for hyperthermia: A Model Based Approach IEEE Transactions on control system Technology 2000; 8(6):979-992.
- Arora D, Skliar M , Roemer RB Model-predictive control of hyperthermia treatments IEEE Trans. Biomed. Eng. 2002; 49(7) : 629–639
- Lin W L, Roemer RB Hynynen K The theoretical and experimental evaluation of a temperature controller for scanned focused ultrasound hyperthermia Int. J. Hypertherm. 1990; 4:615–625
- Hutchinson EB, Dahleh M Hynynen K The feasibility of MRI feedback control for inter- cavity phased array treatments Int. J. Hypertherm, 1998; 11:39–56
- Dhiraj Arora, Mikhail Skliar, Daniel Cooley, Robert BR. Constrained Predictive Control of Thermal Therapies for Minimum-Time Delivery of Thermal Dose, IEEE Transactions on Control Systems Technology 2007 ;15(6): 1030-1037.
- Dhiraj Arora,Mikhail Skliar and Robert BR. Minimum- Time Thermal Dose Control of Thermal Therapies, IEEE Transactions on Biomedical Engineering, 2005 ;52 (2), 191-200.
- Jessi EJ, Paolo FM Automatic temperature controller for multi element array hyperthermia systems IEEE Transactions on BioMedical Engg 2006; 53(6).
- Potocki JK and Tharp HS Reduced-order modeling for hyperthermia control IEEE Trans. Biomed. Eng. 1992; 39: 1265-1273.
- Marshall Mattingly,Ernest AB., Andrew WD., Robert BR., Santosh Devasia Reduced-Order Modeling for Hyperthermia: An Extended Balanced-Realization- Based Approach, IEEE Transactions on Biomedical Engineering 1998 45 (9),1154-1162
- Lamba SS, Rao SV On suboptimal control via simplified model of Davision IEEE Trans Autom. Control, 1974;19: 899-906.
- Davison EJ A method for simplifying linear dynamic system IEEE Transaction Automatic Control , 1966; 11: 98-101.
- Pennes HH Analysis of tissue and arterial blood temperatures in resting human forearm J. Appl. Physiol. 1948; 1: 93–122.
- Dhiraj Arora et.al ,’’Nonlinear model predictive Thermal Dose control of Thermal Therapies: Experimental validation with phantoms” Proceedings of American control conference,Boston, 2004
- Warren D. D’Souza et .al, Tissue mimicking materials for a multi-imaging modality prostate phantom,
- Proceedings of American Control Conference, June 8-10, 2005, Portland, OR, USA.
- Ezhilarasi D,Umapathy M, Bandyopadhyay B Design and Experimental Evaluation of simultaneous fast output sampling feedback control for Smart Structures International Journal of Automation & Control Inderscience publishers 2010 ; 4(1): 42-64
- Sharma GL, Bandyopadyay B Tiwari AP Spatial Control of Large PHWR by Fast output sampling technique IEEE Transactions on Nuclear science 2003; 50(4).
- Syrmos VL, Abdallah P, Dorato P, Grigoriadis K Static output feedback: A survey Automatica,1997; 33( 2): 125-137.
- Werner H Furuta K. Simultaneous stabilization based on output measurements ,Kybernetika, 1995; 31(4): 395-411.
- Kala RAS,Auxillia DJ Periodic output feedback controller for cancer treatment with optimization, Proceedings of IEEE international Conference on Communication Control and Computing Technologies, India 2010
- Romer RB Optimal power deposition in hyperthermia- I: The treatment goal, the ideal temperature distribution, the role of large blood vessels, Int. Journal of Hyperthermia1991; 7(2): 317-341.