ISSN: 0970-938X (Print) | 0976-1683 (Electronic)
Biomedical Research
An International Journal of Medical Sciences
Research Article - Biomedical Research (2018) Volume 29, Issue 7
Automated approach for vestibular disorder diagnosis based on clinical VNG feature selection and fuzzy clustering
1University of Tunis El Manar, Higher Institute of Medical Technologies of Tunis, Laboratory of Biophysics and Medical Technology, Tunis, Tunisia
2University of Tunis, ENSIT, SIME, Montfleury, Tunis, Tunisia
3Department of Oto-Rhino-laryngology, Head and Neck Surgery, Charles Nicolle Hospital, Tunis, Tunisia
4Department of Oto-Rhino-laryngology, Head and Neck Surgery, Habib Thameur Hospital, Tunis, Tunisia
Accepted on February 5, 2018
DOI: 10.4066/biomedicalresearch.29-17-3145
Visit for more related articles at Biomedical ResearchThe unbalanced motion caused by a peripheral vestibular dysfunction provokes spontaneous nystagmus. The major problem in Videonystagmography technique (VNG) is how to recognize a vestibular disorder. In this paper, a novel method is proposed for automatic extraction of Vestibulo-Ocular Response (VOR). The proposed methodology focuses on features reduction from VNG dataset in order to enhance the peripheral Vestibular Diseases (VD) diagnosis. The main contribution of the present work is the proposal of an automatic VD detection scheme which combines an improved feature characterization procedure and the Fuzzy C-means (FCM) classifier in order to study the latter’s ability in evaluating the vestibular dysfunction status within a reduced processing time. The use of VNG parameters gives interesting experimental results that show the effectiveness of the proposed method since up to 92% of classification accuracy was achieved, which is a significant rate as far as the experts' evaluation is concerned.
Keywords
Fuzzy C-means (FCM), Independent component analysis (ICA), Nystagmus analysis, Vestibular disorder (VD), VNG features.
Introduction
The Vestibular Disorder (VD) generates vertigos caused by a unilateral variation of vestibule that appears suddenly. That is why most of the sensory disorders do not generate vertigo, but only the sensation of being dizzy. It is then easy to confuse vertigo with false sensation. Thus, the patients who suffered from these symptoms have to be assessed through the (VNG) technique for a quantitative assessment. The vestibular dysfunction evokes vertigo [1] symptom of unilateral preponderance of the vestibule. Furthermore, this system is integrated in the oculomotor structure, where the Vestibular Ocular Reflex (VOR) is a mechanism involved in the rotation displacement of eye movements (ocular nystagmus) and the fixation of the target in the fovea.
During the analysis progress of a vestibular disorder, any improvement in regard to preponderance may be related to the decline of the reflectivity degree or the advancement of the central compensation. For the purpose of monitoring vestibular disorder, a simple eye tracking system is essentially enhanced where the (VNG) technique of measuring the VOR response is used to optimize the immediate evaluation and assessment from the elementary measurements of preponderance, reflectivity and hypovalence. The problematic area of VNG is the analysis of vertigo as there is no definitive assessment using a medical diagnostic strategy. Based on nystagmus disorder, several studies [2,3] have identified nystagmus (abnormal eye movement) using the information of the velocities slow phase as an effective support for a perfect therapy evaluation (Figure 1). In the work of Bifulco et al. [4], the authors proposed a sensory stimulation of (VNG) tests taking into account the temporal parameters of nystagmus phases. Measurements of VOR [5,6] on the patients affected by peripheral vestibular disorder are an interesting diagnostic factor to understand the vestibular system function and the origin of canal lesion. However, another algorithm developed by Sauter et al. [7] is used for removing saccadic phases with Kalman filter method and it is applied for VOR detection in (VNG) recordings. Another inherent problem that can be encountered when VNG recordings are processed is the blink artefacts which are diverse and must be removed using an accurate algorithm. For instance, Ebisawa et al. [8] reported many methods with electro-oculography for removing blinks noise and detecting the two components of ocular nystagmus. In addition, referring to the work of Curthoys et al. [9] patients with vestibular disorders can eliminate fast eye movements with blink motion. Compared to previous filtering methods, Ohzeki et al. [10] involved a block matching algorithm combined with Kalman filter method to avoid problems of eye position artifacts. Despite the efficacy of this work, this method is still too complicated to be employed in clinical diagnosis.

Figure 1: Routine characteristics using two VNG tests.
Based on the efficiency of the standard parameters of VNG tests and trying to remediate all the above-mentioned problems, namely saccadic phases of nystagmus and blinking noise, we describe in this paper an approach that can provide precise results of VD recognition within a reduced processing time. Furthermore, a kinetic and caloric test cannot distinguish all vestibular disorder symptoms given that the VOR response is too complicated to be assessed. Trying to select all parameters from the target VNG technique, we are interested in this work in selecting the most pertinent features that can be used as a reference for clinical VD evaluation. It is worth noting that various works treated the same topic as the present study by carrying out experiments on the disease that used different methods [11]. However, considering the diversity of the studied dataset, this can be achieved by applying an accurate classification using a combination of three features from all VNG parameters. The obtained results demonstrate that the selected parameters can be used as dynamic factors to increase the accuracy of VD analysis and treatment.
In this paper, we propose an automatic technique for quantitative evaluation of VD condition using (VNG) datasets. The aim of the proposed method is to facilitate the VD assessment process by VNG feature extraction, selection and classification tools. An interesting methodology is applied based on Fisher’s Linear Discriminant (FLD) analysis for features reduction. At a later stage, a Fuzzy C-means (FCM) is used to identify the vestibular disorder from normal topics.
Indeed, the extraction of pertinent features is considered as an important stage in the improvement of the classification results. The classification process is greatly enhanced in our work [13] thanks to the use of the proposed classification method and its accuracy in providing selected features of VNG tests (Figure 1). Furthermore, the entire classification method is employed on several VNG parameters of the database including sixty subjects including patients affected by peripheral vestibular diseases and normal subjects. In addition, the performance of the proposed approach is demonstrated by the comparison of the Fuzzy C-means (FCM) compared with Self-Organizing Map (SOM) classifier.
This paper is organized as follows: In section 2, we will explain the technique used to collect the VNG dataset and the characterization degree to select the most useful features for vestibular disorder diagnosis. Section 3 discusses and analyses the experimental results by comparing the performances of the proposed method with another methods in literature. Finally, conclusions and future work are provided in section 4.
Materials and Methods
Database collection
The available database is constituted of 124 subjects. Considering the illumination of outcome subjects, the used topics are performed by only 60 patients: 40 confirmed to have vestibular disorder, and 20 normal. The dataset were collected from the (VNG) system. This technique uses a CCD camera mounted on a pair of goggles, which maintain the eye in a dark environment, to generate a cornea reflection on the pupil and detect the eye motion while following externally generated visual stimuli. We proceed by kinetic and caloric tests for basic measurements of preponderance, reflectivity and hypovalence towards a better clinical assessment of VD disease. Furthermore, it is important to note that medical reports are not always detailed enough as to identify the vestibular dysfunctions and that a quantification of all VNG parameters is essential to do so. Through the progress of a vestibular dysfunction, any enhancement concerning the preponderance might be associated also with improvements from the central control, or with the decline of the degree of reflectivity. In the first scenario, as a result, making a decision of medical and surgical strategies will always be based upon the simultaneous evaluation and assessment of many fundamental measurements that are reflectivity, preponderance, and hypovalence.
VNG measurements
Kinetic reflectivity: gain: The kinetic test evoked by a chair rotation around the horizontal plane to show the vestibule response illustrated by abnormal eye motion composed by two phases: slow phase interrupted by fast reverse phase. The gain is computed by the following ratio:
Gain=VEye/VHead → (1)
Where VEye and VHead represent respectively the eye and head velocities.
In fact, the vestibular cores are not only associated with the vestibule, but also to the vision and the cervical proprioception. Therefore, the reflectivity can be studied by varying the following situations as shown in Figure 2. In the Visio- Vestibulo-Ocular-Reflex (VVOR) category, the patient observes visible scenery where the stimulation is related to visual and vestibular system. For VOR category the patient is kept in darkness and the stimulation is purely vestibular. In the Cervico-Ocular Reflex (COR) category the stimulation is strictly cervical. The kinetic tests measure the nystagmus intensity by the maximum velocity of the post-rotatory nystagmus, where the slow phase is the only component that can follow immediately the end of the chair rotation. The measured VOR gain [13,14] of the vestibular reflectivity in normal case is from 0 to 1. However, in some VNG conditions, patients suffering from vascular problems have a high gain leading to an overlap with some normal subjects. So, the kinetic test is not adequate to distinguish pathological patients from normal ones.

Figure 2: Implemented kinetic characteristics flowchart, where VVOR: Visio- Vestibular Ocular Reflex; VOR: Vestibular Ocular Reflex; COR: Cervico Ocular Reflex; RP: The Relative Preponderance and AP: The Absolute Preponderance.
Relative preponderance: The relative preponderance shows a fault in the vestibular balance, and its causes are not limited to a problem or a peripheral vestibular organ. In fact, the source that might generate a functional asymmetry by oculomotor response may produce a directional preponderance. And such a source of disorder may occur by the nystagmus. The Relative Preponderance (RP) is the directional asymmetry of the reactional nystagmus in response to symmetrical stimulation, expressed in percentage by the following equation.
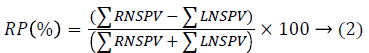
Where, RNSPV and LNSPV present respectively the cumulative of the right and left nystagmus slow phase velocities. Referring to studies in [14,15], the expression of the Absolute Preponderance (AP) in (°/s) is considered an interesting parameter in assessing unilateral vestibular syndrome.
Caloric reflectivity: The caloric tests [15] were performed by stimulation with 30°C and 44°C water irrigation respectively in the right and left ears for 30 seconds. The reflectivity of both inner ears is measured from the maximum velocities of nystagmus eye movement [16] computed 70 s after the beginning of warm and cold irrigations. This measurement cannot be compared to the gain of kinetic test because in this case the stimulation is barely related to the lateral canal. The caloric test permits three standard measurements.
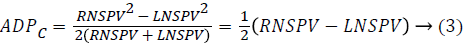
Absolute directional preponderance: From caloric test, the absolute directional preponderance presented in (°/s), is a function of the slow phase velocity of the nystagmus which corresponds to the leading ear side. The directional preponderance and canal paresis measured using Jongkees index formula are based on the difference of maximal slow phase velocities. The directional preponderance of caloric test can be measured in two ways; the relative Directional preponderance (DPc) and the Absolute Directional preponderance (ADPc). Relating to Jongkees formula [14].
Hypovalence: The concept of hypovalence is only reserved for the vestibular analysis using caloric test in order to evaluate each vestibular system separately. For both ears, the reaction of caloric stimulation is revealed by a sensory fault if unilateral vestibular lesion is detected. According to the equation of Jongkees formula [14], and just referring to the most reflective ear.
H=(PRE-NRE) × 100/PRE → (4)
Where PRE and NRE are respectively the positive and negative reflective ears. In fact, in the case of ideal Hypovalence, H value is equal to 100%. The Negative Reflective Ear (NRE) presents the absence of reflectivity response.
Reflectivity: The reflectivity [15] is the ability of the vestibular system, whether isolated or not, to respond to a stimulation of the right and left ears irrigated with warm and cold water. From the cold and warm reactions, the reflectivity of both ears is computed by the sum of the maximum slow phase velocities SPVmax with the directional preponderance DPC(°/s), which is more or less predictable. The expression of reflectivity is characterized by a preponderance interference expressed as follows.
Ref=(SPVmax warmtest+DPC)+(SPVmax coldest-DPC) → (5)
Pertinent VNG feature characterization and automatic VD classification
Feature selection using independent component analysis (ICA): The idea of feature extraction for accurate VD evaluation represents difficult task towards achieving relevant categorization strategy (healthy or pathological). It is worth noting that there sensory disorders are not discussed in depth since only few papers treated [16-18] the VD diagnosis based on nystagmus signals analysis. On the other hand, in clinical practice, the practitioner should take a lot of conditions into account before interpreting the clinical implication of all VNG measurements and deciding if the VD seems to be situated on the side that responds the least to the caloric and kinetic stimulation.
In several works the evaluation of VNG tests can be computed using the amplitude of slow phase velocity and the saccadic phase (fast phase), and it can be used as standard information in time and frequency domains. Therefore, there is not much scientific explanation for the selection of most efficient attributes for vestibular disorder analysis. For this reason, and in order to define pertinent information within VNG datasets, this study proposes to extract the most significant features for VD recognition using the Independent Component Analysis (ICA). In fact, the main idea of the proposed method consists in the detection of the relevant combination from six extracted VNG features by evaluating the ICA criterion.
The ICA method [19,20] is a statistical algorithm used to describe hidden features that combine multidimensional sets of signals and variables. The multivariate variables are particularly supposed to be a linear or nonlinear mixture of various indefinite variables. The combination system is also unknown. Thus, these variables are characterized as Independent Components (ICs) with a mutual independence and non-Gaussian distribution.
An original n-dimensional signal X is considered as an mdimensional signal through the transform matrix A. X represented by the following equation.
X=AS → (6)
Where A is a combination matrix that illustrates the link between the original and the mixed signals. In the first step, A and S are unknown, and the aim of ICA algorithm is to estimate them using the known information shown in X. Equation 7 shows that S̃, the approximation of S, can be derived by multiplying X and the separating matrix W, which is equal to the inverse of the matrix A. The (ICs) are the result of the output of ICA. As illustrated in Equation 7, the variations created by the stimulus of interest can be reconstructed by multiplying its corresponding vector Ŝ and A (W-1)
S̀=WX=A-1X → (7)
W-1S̀=AS̀=X → (8)
Two pre-processing steps are employed before using the ICA process for the observed data matrix X. Firstly, the mean of the data is removed in order to get a zero-mean matrix. Then, the original X is linearly changed to a matrix X% where the correlation matrix of X% is equal to the unity (i.e., {E=XX %T=I}, where the operation {.} gives the standard value. For the linear transformation of the original matrix X, the method is called whitening X where the eigenvalue is decomposed from the covariance matrix E={XX%}=(EDET), where D is the diagonal matrix of its eigenvalues, and E is the orthogonal matrix of eigenvectors of E={XX%T}. Therefore, whitening can be made using X%=(ED-1/2 ET) X.
The independent component analysis is based on the distribution of the independent variable which is calculated according to as a non-Gaussian function. The process is to recognize the distribution of the independent variable. We can apply the Fast ICA, which is based on a fixed-point method with an objective distribution function of maximizing the non- Gaussianity.
As referred to the work of Smulko et al. [21], the deviations from Gaussian distribution is computed by kurtosis and skewness. These parameters are measured for a discrete-time random process. The kurtosis computes the relative peakedness of the Gaussian distribution. Whereas, the skewness presents the degree of its symmetry distribution. Both measures value are equal to zero for a Gaussian representation.
However, in order to test the non-Gaussianity of stochastic variables, the bispectrum function is an interesting method that presents a second-order Fourier transform of the third-order cummulant. Hence, Smulko et al. used the bispectral method to analyse the distribution of their recording dataset. The computed bispectrum function was non-zero only around the low frequencies, indicating that the non-Gaussian information is located at low frequencies which required a lower sampling frequency. In this field, it is an important to note that the bispectral approach shows only the non-Gaussian components which are statistically independent, in the recorded stochastic process, and the Gaussian components are removed.
FCM clustering for VD classification: Fuzzy C-Means classifier (FCM) is a widely-applied approach for classification system. This unsupervised technique can be employed for VD recognition. In fact, the classification accuracy is much enhanced for all vestibular diagnosis conditions by the use of methodologies based on feature characterization and classification tools. Fig.3 shows the proposed unsupervised fuzzy method stages in order to divide the dataset into two categories (VD+ and VD-) using only three independent components among six original features. This can supply wellorganized results in VD recognition with a reduced computing time.

Figure 3: The proposed fuzzy classification process.
The FCM algorithm [22,23] is based on the ratio of maximizing the inter-class distance and minimizing the intraclass distance; by separating the center points of different classes. Taking into account the overlapping partitions, the feature vectors of the dataset is not only related to one class but it is common to the two classes (VD+ and VD-). As shown in Figure 3, the classification procedure clearly improves the separation phase between datasets and avoids the membership between VD- and VD+ data zones. The fuzzy classification process allows minimizing a set of VNG data points which the studied points belonging to the same class present the closest than the points belonging to other group (VD+ or VD-). Moreover, in the case of two closely-related classes, the degrees of membership in these classes are evenly very similar. If the two classes were merged, these subjects have the highest degrees of membership. As illustrated in Figure 4, the accurate VD classification into two topics (VD+ and VD-) comprise between the minimum state of data (0.37) belonging to abnormal cases and p state to the maximum (1.58) belonging normal cases. Note that, feature mean states present the average of six VNG parameters. However, p value demonstrates the unknown zone having undefined interval, identifying the fuzzy area.

Figure 4: Fuzzy clustering principle.
FCM algorithm is an unsupervised classification method that has been effectively applied to feature analysis and clustering based on fuzzy concept to overcome the problem of fuzzy logic [24]. FCM algorithm is based on an optimization iteration which minimizes the partition function of dataset from the two categories: VD and normal; x=(x1, x2, x3,....., xn)T where n is the number of the dataset used in the classification step followed by:
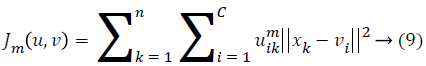
xk represents the features of n subject to be partitioned to c classes, ui k denotes the membership of features uk in the ith class, m is a weighting parameter that controls the fuzziness of the membership function, vi is the ith class center. When features close to their class centroid are designated with high membership values, the cost function will be minimized. The membership functions are controlled in the range (0, 1) where ΣC i=1 uik=1. For each centroid estimation, the FCM algorithm converges to a solution for class center vi representing the local minimum of the cost function (Table 1).

Table 1: Algorithm of FCM for VD classification.
Experimental Results and Discussions
ICA evaluation for VNG feature reduction
To get accurate classification results, the reduced feature vectors extracted from VNG tests are constructed the dataset of the network inputs. In order to obtain new independent variables for a relevant representation of our dataset, the fuzzy clustering algorithm was applied to maximize the difference between features in the inputs set.
Hence, the precursory pre-processing phase consists of an important preposition for the VNG features comparison. As revealed in Table 2, the performance of ICA model is compared to those of Linear Discriminant Analysis algorithm (LDA) by selecting the highest-priority features in order to involve the diagnosis of VD disease. Using the ICA method, the obtained results are prepared by computing the total characterization of each features number in terms of IC with non-Gaussian distribution. In order to not lose information and to optimize performance view in time reduction, it was concluded that we can have enough reliable results using only three features instead six. Table 2 demonstrates that the three independent components among six extracted from the kinetic and caloric test can be the most useful for VD diagnosis. This work is considered special comparing to all used measurements from previous works [19].
| VNG datasets | Experiment 1 | Experiment 2 | Experiment 3 | Experiment 4 | Experiment 5 | |
|---|---|---|---|---|---|---|
| SOM | SE (%) | 78.2 ± 2.6 | 79.5 ± 2.3 | 76.3 ± 2.7 | 78.3 ± 2.4 | 75.2 ± 2.7 |
| SP (%) | 81.5 ± 1.8 | 80.7 ± 2.1 | 83.1 ± 1.7 | 82.3 ± 1.4 | 84.7 ± 1.5 | |
| AC (%) | 78.5 ± 2.4 | 80.2 ± 1.9 | 79.2 ± 2.2 | 79.9 ± 2.4 | 78.1 ± 2.5 | |
| FCM | SE (%) | 81.4 ± 1.9 | 82.7 ± 1.9 | 79.5 ± 2.4 | 80.3 ± 2.1 | 81.8 ± 1.9 |
| SP (%) | 83.2 ± 1.7 | 83.7 ± 1.8 | 82.6 ± 1.7 | 81.4 ± 1.7 | 81.9 ± 1.7 | |
| AC (%) | 80.7 ± 1.4 | 81.4 ± 1.6 | 79.2 ± 1.8 | 81.3 ± 1.4 | 81.1 ± 1.9 | |
| ICA-SOM | SE (%) | 84.6 ± 1.8 | 87.2 ± 1.7 | 88.5 ± 1.3 | 87.1 ± 1.7 | 85.6 ± 1.5 |
| SP (%) | 87.6 ± 1.3 | 88.3 ± 1.2 | 89.1 ± 1.3 | 88.7 ± 1.5 | 86.1 ± 1.2 | |
| AC (%) | 86.2 ± 1.4 | 85.7 ± 1.7 | 87.9 ± 1.6 | 86.6 ± 1.4 | 86.8 ± 1.6 | |
| LDA-SOM | SE (%) | 87.2 ± 1.1 | 86.5 ± 1.4 | 86.3 ± 1.2 | 88.9 ± 1.1 | 87.2 ± 1.2 |
| SP (%) | 87.5 ± 1.2 | 86.7 ± 1.3 | 88.1 ± 1.5 | 89.3 ± 1.4 | 87.7 ± 1.1 | |
| AC (%) | 84.7 ± 1.9 | 84.2 ± 1.9 | 86.2 ± 1.6 | 84.5 ± 1.5 | 85.5 ± 1.6 | |
| LDA-FCM | SE (%) | 88.3 ± 1.2 | 90.5 ± 1.1 | 90.7 ± 1.4 | 91.1 ± 1.1 | 89.7 ± 1.5 |
| SP (%) | 89.6 ± 1.5 | 91.5 ± 1.4 | 91.6 ± 1.2 | 92.4 ± 1.1 | 90.3 ± 1.3 | |
| AC (%) | 88.7 ± 1.5 | 89.4 ± 1.6 | 89.2 ± 1.8 | 91.3 ± 1.4 | 88.4 ± 1.5 | |
| ICA-FCM | SE (%) | 91.8 ± 1.4 | 93.2 ± 0.9 | 92.8 ± 1.2 | 92.3 ± 1.2 | 92.5 ± 1.1 |
| SP (%) | 94.6 ± 0.5 | 94.3 ± 0.4 | 93.1 ± 0.8 | 94.7 ± 0.3 | 93.6 ± 0.6 | |
| AC (%) | 91.8 ± 1.1 | 91.5 ± 1.2 | 92.9 ± 0.9 | 92.2 ± 1.3 | 92.8 ± 0.8 | |
Table 2. Performance comparison of the different classifiers in terms of Sensitivity (SE), Specificity (SP) and Accuracy (AC) on the complete image database (mean values ± standard deviation).
VD classification results using FCM algorithm
The developed work is included within the structure of the unsupervised classification technique, which is correlated to the research of identical groups. Indeed, in order to find optimal and independent parameters for the classification procedure, we studied the sensitivity of the fuzzy clustering method on the resulting classification accuracy by varying the fuzzy degree “m” between selected features. Referring to Table 3, the proposed ICA-FCM algorithm provides the optimum separation performance when the fuzzy degree value is set to 1.2. The used FCM contains important hyperparameters: an input including 3 features according to the ICA characteristics, a class number (c) equal to 2 (30 VD+, 30 VD-), a fuzzy degree (m=1.2) and a Convergence Threshold (CT=10-3). Consequently, if the output is zero, the topic is VD+, if it is one; the topic is considered VD-.
| Classification | FCM technique | |||||
|---|---|---|---|---|---|---|
| Accuracy | m=1.1 | m=1.2 | m=1.5 | m=1.8 | m=2.0 | |
| VNG Dataset | Experiment 1 | 80.2 ± 1.2 | 92.6 ± 0.3 | 85.6 ± 1.2 | 81.4 ± 1.7 | 79.2 ± 1.9 |
| Experiment 2 | 77.6 ± 2.4 | 93.2 ± 0.2 | 86.1 ± 1.1 | 81.9 ± 1.9 | 80.7 ± 1.5 | |
| Experiment 3 | 80.3 ± 1.3 | 90.5 ± 0.4 | 84.2 ± 1.4 | 83.6 ± 1.1 | 82.4 ± 1.2 | |
| Experiment 4 | 76.1 ± 2.1 | 91.9 ± 0.8 | 83.7 ± 1.1 | 82.1 ± 1.2 | 81.9 ± 1.8 | |
| Experiment 5 | 81.3 ± 1.5 | 90.5 ± 0.6 | 84.5 ± 1.5 | 82.9 ± 1.5 | 81.5 ± 1.5 | |
| Mean | 79.9 ± 1.7 | 90.3 ± 0.46 | 84.82 ± 1.28 | 82.38 ± 1.5 | 81.14 ± 1.58 | |
Table 3. Influence of fuzzy clustering results using different fuzzy degree values (mean values ± standard deviation).
In this section, a comparative classification study using ICAFCM method with those obtained by The Self-Organizing Map (SOM) classifier [25,26], FCM, ICA-SOM, LDA-SOM, LDAFCM; is demonstrated. The Self-Organizing Map (SOM) is an entirely connected single-layer linear network, where the output is usually structured in a 2-dimensional organization of nodes. The basis of the SOM is the soft competition between the nodes in the output layer; where the node (the winner) and their neighbors are updated. Self-organizing networks have the possibility to learn and identify the correlation and regularity in the inputs, to predict the selected data.
From several experiments made at this stage, we conclude that the classification efficiency achieved by the Self-Organizing Map (SOM) classifier is not satisfactory using the extracted features. This is probably due to the correlation between VNG features. For this reason, we proceed in the second stage by reducing the original parameters with ICA preprocessing in order to get more representative and independent variables that describe the VNG parameters.
To exhibit the performance of the proposed method, multiple methods such as FCM, Self-Organizing Map (SOM), LDASOM, ICA-SOM, LDA-FCM are also achieved. Experimental results prove that the proposed approach is very promising using both reduced features (ICA) and unsupervised classifier (FCM) for an efficient VD assessment.
The combined ICA and SOM unsupervised classifier is developed to decrease the remarkable overlap for hopeful classification rate more precisely. Hence, it appears a great optimization of the SOM structure. In order to get a reasonable evaluation of VD, the FCM structures were designed during the random-selected experiments using the new independent features that define the optimal classification results of the FCM classifier with the reduced error in the classification phase. Table 2 shows the resulted percentages of SE, SP and AC for the complete VNG database of the studied FCM classifier. Indeed, we prove that the ICA-FCM classification method is more accurate than SOM, FCM, LDA-SOM, LDAFCM and ICA-SOM classifiers for the two VNG classes in two sets of experiments. From these results, it gives the best average accuracy of about 92.24% with a standard deviation less than 2% for VNG database, compared to accuracy rates obtained with SOM, FCM, ICA-SOM, LDA-SOM, and LDAFCM of about 79.18%, 80.74%, 86.64% 85.02, and 89.4%, respectively. Simulation results highlight the robustness of the proposed method using large VNG dataset.
The projected approach was able to estimate VD diagnosis with an interesting accuracy result in the total signal database for detecting vertigo disorder even at an early stage. Hence, to demonstrate the strength of the given relevant features, different classification approaches have been applied. Equally, the reduced processing time and remarkable overlap assemblage are concurrently resolved.
The employed parameters in Table 2 are offered by the following equations:
• The Accuracy Classification (AC) is the ratio of the total numbers of correctly classified test samples to the total number of test samples.
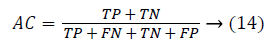
• In order to provide the assessment of our classifiers performances, statistical analysis in terms of Sensitivity (SE), and Specificity (SP) are applied too.
SE=TP/FN+TP → (15)
SP=TN/TN+FP → (16)
Where TP and TN represent respectively the number of true positives and true negatives, FP is the number of false positives and FN is the number of false negatives. A Receiver Operating Characteristic (ROC) curve was used to validate the classification results [27]. Figure 5 shows the ROC curve analysis technique of our proposed ICA-FCM approach. It is obvious that ICA-FCM system gives accurate results in terms of Sensitivity (SE) and Specificity (SP) respectively with mean average of 93.96%, 92.52%. Hence, we should notice that these results used the significant features of VNG dataset which validates the effectiveness of our strategy. Finally, one can conclude that the proposed VNG analysis method can consistently be used to assist doctors by providing a second opinion which may be of great help in their diagnosis.

Figure 5: Validation of the proposed FCM method using ROC curves.
The biggest difficulty in the assessment of VD is that there is no significant indicative to be used in the alternative diagnosis [28]. Thereby, it is essential to prove that nystagmus has been correctly identified by analyzing the trace and establishing different clinical parameters. The employed parameters using ICA pre-process can be used as a helpful support for a pertinent diagnosis evaluation.
Furthermore, diagnosis information on VD [27] is severely made, without integrating analysis conditions or neurological opinion; no apparent VD sign are comprehensive. Hence, the evaluation of VNG tests depends on the variability of the individual VOR response. Thus, the usual signs of this VD disease do not indicate significant information from simple eye movement’s evaluation [29]. Currently, the diagnosis of VD disease stills a challenge since the usual signs of VD do not illustrate the real vestibular response. Because of these clinical problems and to present an automated diagnosis system of VD and to avoid excessive examinations, an intelligent analysis of vertigo can be considerably useful sign in distinguishing VD from other normal cases [27].
Consequently, this study is considered exceptional by comparing the number of treated measurements and tests with previous works [28,30]. With these results, we conclude that the proposed preprocessing and classification method can consistently be used to assist ENT doctors by providing a second judgment for indefinite cases that need further attention [31].
Conclusions and Future Works
In this work, an advanced approach for vestibular disorder based on VNG features is proposed. First, VNG measurements were automatically extracted using caloric and kinetic techniques. Second, an important method consists in the pertinent features selection from VNG dataset in order to enhance the peripheral Vestibular Diseases (VD) diagnosis. The proposed strategy gives high-quality resulting feature characterization and reduction when compared to other techniques. The extracted VNG features are classified into two classes focused on the combination of an independent component analysis preprocessing and fuzzy-C means technique. This intelligent system can accurately separate the dataset into different groups: VD- and VD+.
The proposed method was compared with some existing improved algorithm in order to get significant results in terms of classification accuracy, sensitivity and specificity. Experimental results exhibit that the combined ICA-FCM process can frequently classify normal and abnormal subjects to improve the diagnosis of vestibular disease. As future work, more dataset will be investigated to develop the classification stage. Also, for the vestibular disorder diagnosis, the conception of an expert system is the aim of progress works.
References
- Brantberg K, Baloh RW. Similarity of vertigo attacks due to Menieres disease and benign recurrent vertigo, both with and without migraine. Acta Otolaryngol 2011; 131: 722-727.
- Asawavichiangianda S, Fujimoto M, Mai M, Desroches H, Rutka J. Significance of head-shaking nystagmus in the evaluation of the dizzy patient. Acta Otolaryngol Suppl 1999; 540: 27-33.
- McGibbon CA, Palmer T, Goldvasser D, Krebs DE. Kalman filter detection of blinks in video-oculography: applications for VVOR measurement during locomotion. J Neurosci Methods 2001; 106: 171-178.
- Bifulco P, Cesarelli M, Loffredo L, Sansone M, Bracale M. Eye movement baseline oscillation and variability of eye position during foveation in congenital nystagmus. Doc Ophthalmol 2003; 107: 131-136.
- Kim MB, Huh SH, Ban JH. Diversity of head shaking nystagmus in peripheral vestibular disease. Otol Neurotol 2012; 33: 634-639.
- Halmagyi GM, Weber KP, Curthoys IS. Vestibular function after acute vestibular neuritis. Restor Neurol Neurosci 2010; 37-46.
- Sauter D, Martin BJ, Di Renzo N, Vomscheid C. Analysis of eye tracking movements using innovations generated by a Kalman filter. Med Biol Engng Comput 1991; 29: 63-69.
- Ebisawa Y, Minamitani H, Mori Y, Takase M. New methods for removing saccades in analysis of smooth pursuit eye movement. Biol Cybernet 1988; 60: 111-119.
- Curthoys IS. Vestibular compensation and substitution. Curr Opin Neurol 2000; 13: 27-30.
- Ohzeki K, Ryo B. Video analysis for detecting eye blinking using a high-speed camera. Fortieth Asilomar Conf Sig Sys Comp 2006.
- Chen L, Lee W, Chambers BR, Dewey HM. Diagnostic accuracy of acute vestibular syndrome at the bedside in a stroke unit. J Neurol 2011; 258: 855-861.
- Lin FR, Migliaccio AA, Haslwanter T, Minor LB, Carey JP. Angular vestibule ocular reflex gains correlate with vertigo control after intra tympanic gentamic in treatment for Menieres disease. Ann Otol Rhinol Laryngol 2005; 777-785.
- Goldvasser D, McGibbon CA, Krebs DE. Vestibular rehabilitation outcomes: velocity trajectory analysis of repeated bench stepping. Clin Neurophysiol 2000; 1838-1842.
- Faucheux S, Schwaller B, Gentine A, Buizza A. Experimental identification of vertical vestibulo-ocular reflex. Proc 24th Barany Soc Meet Uppsala 2006; 14.
- Hertle RW, Zhu X. Oculographic and clinical characterization of thirty-seven children with anomalous head postures, nystagmus, and strabismus: the basis of a clinical algorithm. J Am Assoc Pediatr Ophthalmol Strabismus 2000; 25-32.
- Lin FR, Migliaccio AA, Haslwanter T, Minor LB, Carey JP. Angular vestibuleocular reflex gains correlate with vertigo control after intratympanic gentamic in treatment for Menieres disease. Ann Otol Rhinol Laryngol 2005; 777-785.
- Akman OE, Broomhead DS, Clement RA, Abadi RV. Nonlinear time series analysis of jerk congenital nystagmus, J.Comput Neurosci 2006; 153-170.
- Van Beuzekom AD, Van Gisbergen JAM. Interaction between visual and vestibular signals for the control of rapid eye movements. J Neurophysiol 2002; 88: 306-322.
- Mantini D, Petrucci F, Del Boccio P, Pieragostino D, Di Nicola M, Lugaresi A, Federici G, Sacchetta P, Di Ilio C, Urbani A. Independent component analysis for the extraction of reliable protein signal profiles from Maldi-t of mass spectra. Bioinformatics 2008; 24: 63-70.
- Yu SN, Chou KT. Integration of independent component analysis and neural networks for ECG beat classification. Exp Sys Appl 2008; 34: 2841-2846.
- Smulko JM, Kish LB. Higher-Order statistics for fluctuation enhanced gas-sensing. Sens Mater 2004; 16: 291-299.
- Mendel J, Robert I, John B. Type-II fuzzy sets made simple. IEEE Trans Fuzzy Sys 2002; 10: 117-127.
- Hwang CR. Uncertain fuzzy clustering: interval type-2 fuzzy approach to c-means. IEEE Trans Fuzzy Sys 2007; 15: 107-120.
- Mendel J. Uncertain rule-based fuzzy logic systems: introduction and new directions. Prentice Hall USA 2000.
- Cho JH, Park HJ, Kim KB. Vector quantization using enhanced SOM algorithm. Parallel and Distributed Computing: Applications and Technologies, Proceedings, Lecture Notes in Computer Science 2004; 199-211.
- Cottrell M, Ibbou S, Letremy P. SOM-based algorithms for qualitative variables. Neur Netw 2004; 17: 1149-1167.
- Ben Slama A, Mouelhi A, Sahli H, Manoubi S, Mbarek C, Trabelsi H, Fnaiech F, Sayadi M. A new preprocessing parameter estimation based on geodesic active contour model for automatic vestibular neuritis diagnosis. Artific Intel Med 2017; 80: 48-62.
- Van Beuzekom AD, Van Gisbergen JAM. Interaction between visual and vestibular signals for the control of rapid eye movements. J Neurophysiol 2002; 88: 306-322.
- Abadi R, Scallan C, Clement R. The characteristics of dynamic overshoots in square-wave jerks, and in congenital and manifest latent nystagmus. Vis Res 2000; 40: 2813-2829.
- Park H, Hong SC, Shin J. Clinical significance of vibration induced nystagmus and head-shaking nystagmus through follow-up examinations in patients with vestibular neuritis. Otol Neurotol 2008; 375-379.
- Ben Slama A, Mouelhi A, Sahli H, Manoubi S, Ben Salah M, Trabelsi H, Sayadi M, Fnaiech F. A novel automatic diagnostic approach based on nystagmus feature selection and neural network classification. IEEE Industrial Electronics Conference IECON 2016; 5165-5170.