ISSN: 0970-938X (Print) | 0976-1683 (Electronic)
Biomedical Research
An International Journal of Medical Sciences
Research Article - Biomedical Research (2017) Volume 28, Issue 21
Application value of observing changes in kidney size, morphology, structure and renal artery resistance indexes in patients with diabetes mellitus by ultrasonography
Shuhao Deng, Quan Jiang, Yicheng Zhu and Yuan Zhang*
Department of Ultrasound, Pudong New Area People’s Hospital, Shanghai, China
Accepted on November 27, 2017
Objective: To explore the relationship between kidney size and Resistance Index (RI) and provide valuable reference to the diagnosis of Diabetic Nephropathy (DN) by observing changes in kidney size, morphology, structure and renal artery resistance indexes (RI) in patients with Diabetes Mellitus (DM) using color Doppler ultrasound.
Methods: 140 patients with DM were enrolled and divided into two groups according to the course of disease. Patients with a disease duration less than 5 y were set as group A (n=70), and patients with a disease history more than 5 y were set as group B (n=70). At the same time, 60 healthy subjects were chosen as control group. Levels of cystatin C (Cys-C), and high sensitivity C-reactive Protein (hs-CRP) in serum, Beta-2 Microglobulin (β2-MG) and urinary microalbumin (U-mAlb) in urine and other laboratory indexes were compared between groups. Changes of kidney size and renal artery resistance index were compared between subjects.
Results: Compared with control group, levels of Cys-C and hs-CRP in serum, 2-MG and U-mAlb in urine were significantly higher in group A and B (P<0.05), but there were no significant differences between the group A and group B on these items (P>0.05). In group B, there were 16 cases (22.9%) of renal swelling (9-12 y of disease duration) and the levels of RI in all renal arteries increased, while microalbuminuria was positive in 9 cases. The average kidney indexes (length, width, area) of group B was significantly larger than those of group A and control group (P<0.05), but there was no significant difference between group A and control group (P>0.05). The RI in group B was significantly higher than that in group A and control group (P<0.05). There was a positive linear correlation between the size and renal arterial RI in group B (r=0.832, P<0.05).
Conclusion: Color Doppler ultrasonography is of great value in patients with DM. It can indicate the size and hemodynamics of the kidney, and can be used for the early diagnosis of Diabetic Nephropathy (DN).
Keywords
Color Doppler ultrasonography, Diabetic nephropathy, Kidney, Renal artery resistance index.
Introduction
Diabetes Mellitus (DM) is a common and frequently occurring disease worldwide, which is also one of the common high-risk factors for the progression of chronic kidney disease. With the continuous improvement of people's living standard, the incidence of DM is increasing year by year, and has taken the third place of chronic non-communicable diseases [1]. According to statistics, the incidence of diabetes in China has increased to 2.5%. Diabetic Nephropathy (DN) is a common complication of DM, with a clinical incidence of approximately 35% in type 1 DM and 25% in type 2 DM. The End-Stage Renal Failure (ESRD) caused by DN is becoming a major cause threatening patients’ lives [2]. DN often onsets hidden and progresses slowly and it often lacks early clinical symptoms. Early proteinuria is intermittent and is very easy to be overlooked [3]. It will be irreversible when persistent proteinuria occurs in clinical. It is very critical for detecting the early damage of DN and performing appropriate interventions to control the development of DN.
Previously, DN was mainly evaluated based on renal biopsy and biochemical markers in blood and urine [4]. However, renal biopsy is an invasive test and cannot be used as a routine method for early screening of DN. In addition, due to the difficulty in detecting the early damages caused by diabetes based on commonly used biochemical markers and it is often irreversible when large proteinuria occurs. Therefore, it is important to explore early, sensitive and effective examination methods. It has been reported that [5], some patients present the increase in kidney size before early proteinuria occurs in early DN patients, so ultrasonography may be more meaningful in determining early kidney damage than blood and urine biochemical examinations. Doppler ultrasonography examination is a safe, noninvasive and reproducible method. Previous data [6] indicate that obviously thinner vascular branches and a RI more than 0.70 are also risk signs of early renal lesions. The RI value of the intrarenal artery may also be used as an indicator for early diagnosis of DN and monitoring of DN progression. Early assessment of renal damage in patients with DN has become a top priority in clinical work. The purpose of this study was to explore the relationship between kidney size and resistance index and provide valuable reference to the diagnosis of Diabetic Nephropathy (DN) by observing changes in kidney size, morphology, structure and renal artery Resistance Indexes (RI) in patients with diabetes mellitus using color Doppler ultrasound.
Data and Methods
Clinical data
140 patients with type 2 DM treated in our hospital from April 2016 to April 2017 were enrolled, with 90 cases of male and 50 cases of female; aged 48-74 y old, the mean age (60.5 ± 2.7 y); a diabetes duration of 1 to 12 y, of which 70 patients with a duration<5 y and 70 cases with a duration>5 y. The selected patients were all met the diagnosis criteria released by American Diabetes Association (ADA) in 1997. All patients have complete clinical data. Patients with hypertension, heart failure, urinary tract infection, kidney stones, renal vascular disease and primary and secondary lesions resulted from other reasons were excluded. Routine urine protein was negative and urea nitrogen and creatinine were normal in blood and urine in all patients. Patients with a disease duration less than 5 y were set as group A (n=70), and patients with a disease duration more than 5 y were set as group B (n=70). At the same time, 60 healthy volunteers were chosen as control group who are matched with patients in age and sex, including 35 males and 25 females, aged 47 to 73 y and mean age (61.4 ± 2.5 y). There was no significant difference between the three groups in gender, age and other general data (P>0.05).
Ultrasonography
GE-LOGIQ-E9 (General Electric Company, USA) was used and probe frequency was set at 2.5-3.5 MHz. First, two-dimensional ultrasound was performed. Patients took lateral position, coronal plane of kidney was examined to measure the maximum distance (length), the maximum distance vertical to major axis from inner side to the outer side (width) and the maximum section area (calculated by ultrasound system). Then switch to Color Doppler Energy Imaging (CDEI) to observe the blood distribution of renal vascular bed, and measure the distance between kidney surrounding vessels and renal capsule. Guided by color Doppler flow signal, renal artery (MRA), renal sinus segment artery (SRA), renal interlobar artery between the cone (IRA) and arcuate artery (ARA) at the corticomedullary junction were sampled by pulsed Doppler and the maximum blood flow velocity in systole (Vmax), end diastolic velocity (Vmin), mean velocity (Vmen) were measured.
Resistance Index (RI) and Pulsatility Index (PI) were recorded by Doppler intelligent instrument, take 3 measurements at each point and take the average. Renal blood supply was graded by Color Doppler Flow Imaging (CDFI). All raw data was stored in the instrument, and the ultrasound examination was performed by special person. The condition of the instrument is preset to check kidneys. The relation between the size and hemodynamic changes of the kidney was analysed and compared with the normal control group.
Laboratory index test
3 ml of the elbow vein blood of the subjects were extracted and placed in the coagulation tube in the early morning fasting state. Serum was separated at 3000 R/min for 10 min from blood within 2 h and and stored at -70°C in the refrigerator for examination. Subjects were instructed to save 24 h of urine and morning urine respectively. 5 ml of urine was taken into the test tube to be measured after mixed. The serum High Sensitivity C-reactive Protein (hs-CRP) was detected by enzyme-linked immunosorbent assay, and serum cystatin C (Cys-C), Beta-2 Microglobulin (β2-MG) and urinary microalbumin (U-mAlb) were examined using immune turbidimetry. Instruments adopted were Hitachi 7600 automatic biochemical analyzer and all of the actions were strictly according to the operation requirements of kits. The normal value range of laboratory parameters: serum Cys-C: <1.25 mg /L, hs-CRP: 0-2.1 mg/L, urine β2-MG: 0.01-0.30 μg/ml, UmAlb: 0.62-16.70 μg/ml. Single index exceeding the upper range of normal value is positive, any single index in joint detection exceeding the upper range of normal value is positive, while all the indexes under the upper range is negative.
Statistical analysis
SPSS 21 software was adopted for statistical analysis. Comparisons between the two groups were conducted using t-test. Comparisons among three groups were conducted using analysis of variance, and pairwise comparisons were conducted with q-test. Relations between indexes are analysed by linear correlation. P<0.05 means statistically significant.
Results
Comparisons on laboratory indexes between groups
Compared with control group, levels of serum Cys-C, hs-CRP and urine β2-MG and U-mAlb in groups A and B were significantly higher(P<0.05). However, there was no significant difference on these indexes between groups A and group B group (P>0.05) (Table 1).
| Group | N | Cys-C (mg/L) | hs-CRP (mg/L) | β2-MG (μg/ml) | U-mAlb |
|---|---|---|---|---|---|
| Control | 60 | 0.59 ± 0.07 | 1.07 ± 0.42 | 0.12 ± 0.05 | 8.75 ± 1.38 |
| A | 70 | 3.15 ± 0.62 | 3.46 ± 1.03 | 0.37 ± 0.13 | 75.81 ± 4.52 |
| B | 70 | 3.18 ± 0.84 | 3.59 ± 1.26 | 0.41 ± 0.08 | 76.94 ± 5.11 |
| F | 10.156 | 11.792 | 9.048 | 10.025 | |
| P | <0.05 | <0.05 | <0.05 | <0.05 |
Table 1. Comparisons on laboratory indexes between groups.
Comparisons on kidney size between groups
In group B, there were 16 cases of renal swelling (9-12 y of disease duration), accounting for 22.9%, and the levels of RI in all renal arteries increased, while microalbuminuria (+) in 9 cases. The average kidney indexes (length, width, area) of group B was significantly larger than those of group A and control group (P<0.05), but there was no significant difference between the group A and control group (P>0.05) (Table 2).
| Group | N | Kidney size (left) | Kidney size (right) | ||||
|---|---|---|---|---|---|---|---|
| Length (cm) | Width (cm) | Area (cm2) | Length (cm) | Width (cm) | Area (cm2) | ||
| Control | 60 | 10.13 ± 0.45 | 5.16 ± 0.43 | 48.95 ± 3.32 | 9.84 ± 0.57 | 5.11 ± 0.48 | 48.92 ± 3.26 |
| A | 70 | 10.92 ± 0.36 | 5.47 ± 0.32 | 52.54 ± 3.86 | 10.69 ± 0.36 | 5.32 ± 0.41 | 52.05 ± 3.17 |
| B | 70 | 12.15 ± 0.41 | 6.12 ± 0.44 | 63.47 ± 4.01 | 11.84 ± 0.52 | 5.96 ± 0.37 | 62.98 ± 3.61 |
| F | 9.032 | 10.274 | 11.169 | 12.004 | 13.052 | 12.081 | |
| P | <0.05 | <0.05 | <0.05 | <0.05 | <0.05 | <0.05 | |
Table 2. Comparisons on kidney size between groups.
Relationship between renal vascular RI and renal area between groups under CDEI
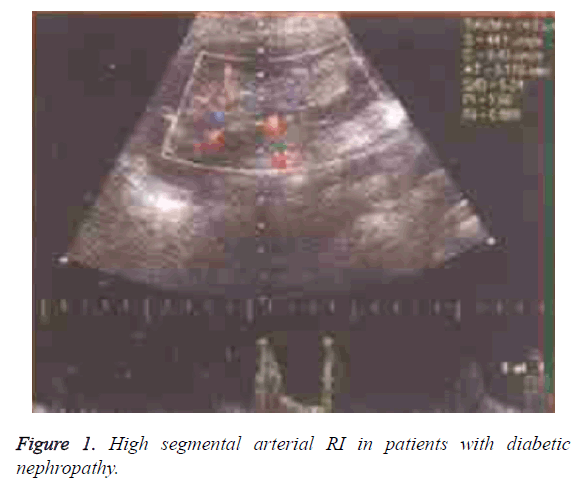
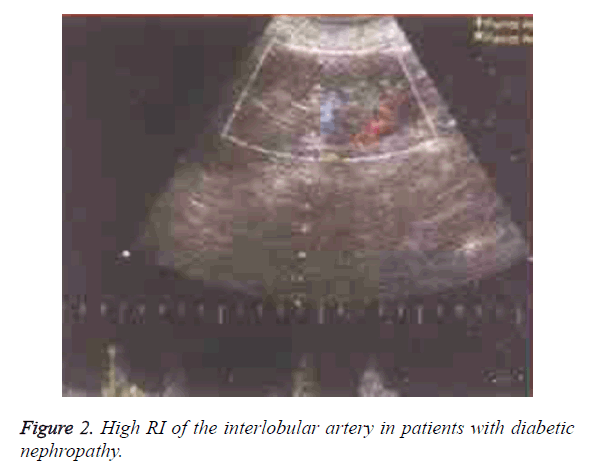
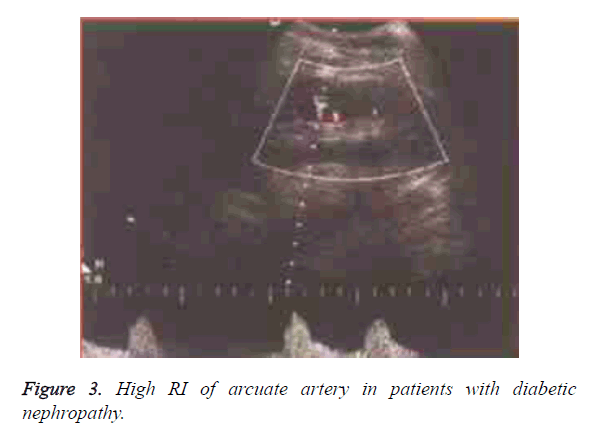
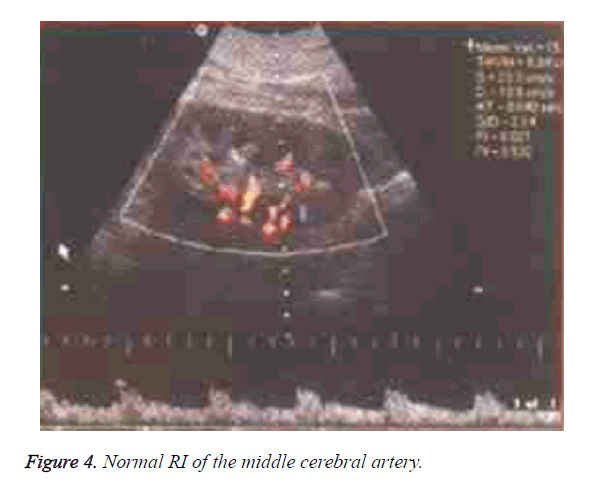
The RI in group B was significantly higher than that in group A and control group (P<0.05) (Table 3). There was a positive linear correlation between the size and renal arterial RI in group B (r=0.832, P<0.05). There was no reduction in the size of the kidneys in the groups A and B, and the microvascular network of the renal cortical capsule showed a good perfusion, and the distance between the renal peripheral vessels and the renal capsule was >3 mm (Figures 1-4).
| Group | N | MRI | SRI | IRA | ARA | Size area(cm2) |
|---|---|---|---|---|---|---|
| Control | 60 | 0.62 ± 0.01 | 0.57 ± 0.02 | 0.51 ± 0.02 | 0.46 ± 0.05 | 48.12 ± 4.96 |
| A | 70 | 0.63 ± 0.03 | 0.58 ± 0.04 | 0.53 ± 0.02 | 0.51 ± 0.03 | 54.05 ± 4.03 |
| B | 70 | 0.68 ± 0.05 | 0.67 ± 0.06 | 0.66 ± 0.07 | 0.65 ± 0.07 | 62.54 ± 5.35 |
| F | 9.216 | 9.977 | 9.081 | 10.265 | 11.403 | |
| P | <0.05 | <0.05 | <0.05 | <0.05 | <0.05 |
Table 3. Relationship between renal vascular RI and renal area between groups under CDEI.
Discussion
DN is one of the serious complications of diabetes and it often lacks obvious clinical features in the early stage of the disease [7]. Laboratory examination is of great value for early diagnosis of DN and judging the prognosis. Glomerular hypertrophy is the main feature of DN in the early stage, accompanied by glomerular and tubular basement membrane thickening and accumulation of mesangial cell extracellular matrix and it often present microalbuminuria clinically. U-mAlb is a negative charged protein which was secreted by the liver, it often cannot go through the filtration membrane because of the same charge repulsion [8]. Therefore, elevated U-mAlb can be used as an important marker for evaluating the glomerular screen selection function and the damage extent of the charge selection barrier. β2-MG is produced by lymphocytes, platelets and polymorphonuclear leukocytes, and there is a balance between the synthesis and release of human β2-MG in normal conditions. β2-MG is filtrated by the glomeruli, absorbed in the proximal tubule and destroyed into amino acids. The abnormal elevation of β2-MG and urine β2- MG reflect injury of glomerular filtration and renal tubular respectively. The production rate of Cys-C is not affected by sex, age, fever or other factors, it is filtrated by the glomeruli and absorbed in the proximal tubule [9,10]. The results of this study showed that levels of serum Cys-C, hs-CRP and urine β2-MG, U-mAlb were significantly higher in group A and B than control group (P<0.05), but there was no significant difference on these items between groups A and B (P>0.05). It means that the levels of Cys-C, hs-CRP, urine β2-MG and U-mAlb in patients with diabetes are significantly higher compared with healthy people, suggesting that diabetes can be diagnosed by the indicators above. However, as it is difficult to detect early diabetic kidney damage based on Cys-C, hs-CRP, urine β2-MG in clinical practice and U-mAlb and it is often irreversible when large proteinuria occurs, it is necessary to explore early, sensitive and effective examination methods.
Color Doppler flow imaging, as a non-invasive detection of renal blood flow and hemodynamic changes, can directly reflect the renal vascular lesions and provide a simple, easy and reliable method of examination [11]. In the early stage of DN, the hyperplasia of renal mesangial and increase in matrix and vascular basement membrane materials lead to kidney hypertrophy. Ultrasound observation is based on the pathological changes mentioned above and the kidney size of early DN can be clearly and visually shown by two-dimensional ultrasonography [12]. Previous data showed [13] that the greatest function of color Doppler ultrasound is that it can show the dynamic change of renal hemodynamic parameters. Peak flow rate measured this way can indirectly reflect the condition of renal tubular amounts and blood supply. RI can pass out changes in the elasticity of blood vessels and is related with renal interstitium. It includes systolic and diastolic blood flow signal, and can provide information of small vessel flow. It is noted that evaluating the renal cortex blood perfusion using the method by which CDEI detect small, slow, directional blood flow of the kidney to determine the renal micro vascular lesions make up the defect of diagnosing DN based on increased kidney area only, because renal hypertrophy can be false positive due to individual differences. Therefore, observing renal section size using two-dimensional ultrasound, accompanied by color Doppler ultrasound examination can improve the accuracy of early DN diagnosis [14]. With the help of CDEI detection technology, the blood supply of arteries from renal artery at renal hilum to renal subcapsular branches can be shown effectively. Combined with CDFI classification, semi quantitative analysis of renal artery perfusion can be performed based on direct display of the range of renal artery blood flow. Arterial hemodynamic parameters and Resistance Index (RI) mainly reflect the renal arterial resistance state [15,16]. Increased glomerular filtration rate in patients with early DN result in high perfusion and high pressure in glomeruli and increased RI in renal arteries. In this study, early damage of renal function is closely related to significant decrease in blood flow velocity of renal arterioles, significant increase in RI, decreased diastolic flow velocity of interlobar and arcuate artery and increased vascular resistance measure by the Doppler ultrasound. There was a positive linear correlation between the kidney size and RI of the renal arteries. In addition, based on this study, hemodynamic changes and kidney enlargement occurred in some cases before the appearance of microalbuminuria, while the blood perfusion of the arteries under the renal capsule was normal. Increased kidney size with no change in structure, lower renal parenchyma than liver and spleen and clear corticomedullary differentiation is helpful to identify diffuse parenchymal damages caused by other reasons (such as acute glomerulonephritis, drug induced renal damages). Ultrasound can be used as one of the screening methods for early diagnosis of DN, but ultrasonic workers must make a correct evaluation according to clinical because the results of the color Doppler ultrasonography can be affected by factors such as the speed of sound and the angle of the blood flow direction. In addition, for patients with obvious ultrasonic kidney damage and small size but short course of DM, renal biopsy should be performed to exclude other causes of kidney damage.
In conclusion, color Doppler ultrasonography is of great value in patients with DM. It can indicate the size and hemodynamics of the kidney, and can be used for the early diagnosis of diabetic nephropathy.
Acknowledgment
We thank the financial support from Fund of Academic Leaders, Shanghai Pudong New Area Health System (PWRd2017-06); funding for major weak disciplines of Shanghai Pudong New Area Health System (PWZbr2017-10).
References
- Lukmanto RB, Irwansyah. E. The early detection of diabetes mellitus (DM) using fuzzy hierarchical model. Int Conf Comp Sci Comp Intell 2015; 312-319.
- Al-Jiffri AM, Fadag RB, Ghabrah TM. Risk factors for developing end-stage-renal-failure among diabetic patients: a retrospective analysis. Saudi J Kidney Dis Off Publ Saudi Center Organ Transplant Saudi Arabia 2003; 14: 77-80.
- Hyvonen ME, Dumont V, Tienari J. Early-onset diabetic E1-DN mice develop albuminuria and glomerular injury typical of diabetic nephropathy. Biomed Res Int 2015; 2015: 1-11.
- Cuadrado-Godia E, Ois A, Garcia-Ramallo E. Biomarkers to predict clinical progression in small vessel disease strokes: prognostic role of albuminuria and oxidized LDL cholesterol. Atherosclerosis 2011; 219: 368-372.
- Zhuang Z, Bai QAL. Increased urinary angiotensinogen precedes the onset of albuminuria in normotensive type 2 diabetic patients. Int J Clin Exp Pathol 2015; 8: 11464-11469.
- Henderson MC, Van Bockel HJ, Schipper J. Color Doppler flow evaluation of normal renal blood flow in the renal artery and its hilar branches after extracorporeal repair and renal autotransplantation. J Vasc Technol 1993; 17: 117-122.
- Liang S, Cai GY, Chen XM. Clinical and pathological factors associated with progression of diabetic nephropathy. Nephrology (Carlton) 2017; 22: 14-19.
- Denyer P, Shu L, Jegatheesan V. Evidence of changes in membrane pore characteristics due to filtration of dye bath liquors. Desalination 2007; 204: 296-306.
- Daryadel A, Haubitz M, Figueiredo M. The C-terminal fragment of agrin (CAF), a novel marker of renal function, is filtered by the kidney and reabsorbed by the proximal tubule. Plos One 2016; 11: 0157905.
- Kim BB, Chung SH, Yoon HS. Decreased cystatin C-estimated glomerular filtration rate is correlated with prolonged hospital stay in transient tachypnea of newborn infants. Pediatr Neonatol 2015; 57: 195-200.
- Rohani F, Hooman N, Moradi S. Glomerular filtration rate-based cystatin C compared to microalbuminuria to detect early stage of diabetic nephropathy in children with type 1 diabetes mellitus. Int J Diab Develop Countries 2015; 35: 1-7.
- Dehmiwal D, Behl SM, Singh P. Diagnosis of pathological conditions of kidney by two-dimensional and three-dimensional ultrasonographic imaging in dogs. Veter World 2016; 9: 693-698.
- GGuo M, Yang Q, Zhou Y. The observation of two-dimensional and color Doppler ultrasound in the diagnosis of Hashimoto's thyroiditis results. China Cont Med Edu 2016; 8: 42-44.
- Anderson WP, Denton KM, Woods RL. Angiotensin II and the maintenance of GFR and renal blood flow during renal artery narrowing. Kidney Int Suppl 1990; 30: 109.
- Ciccone MM, Iacoviello M, Gesualdo L. The renal arterial resistance index: a marker of renal function with an independent and incremental role in predicting heart failure progression. Eur J Heart Fail 2014; 16: 210-216.
- Ozkan MB, Stafrace S, Ozyazici E. Hemodynamics of the fetal renal artery in cases of isolated oligohydramnios between 35 weeks' and 40 weeks' gestation. J Med Ultrasound 2014; 22: 207-212.


