ISSN: 0970-938X (Print) | 0976-1683 (Electronic)
Biomedical Research
An International Journal of Medical Sciences
Research Article - Biomedical Research (2017) Volume 28, Issue 8
An optimized probabilistic edge based level set method for left ventricle segmentation in echocardiography images
1Department of Biomedical Engineering, Science and Research Branch, Islamic Azad University, Tehran, Iran
2Department of Electrical Engineering, Sharif University of Technology, Tehran, Iran
3Biomedical Engineering Department, Iran University of Science and Technology, School of Electrical Engineering, Tehran, Iran
- *Corresponding Author:
- Emad Fatemizadeh
Department of Electrical Engineering
Sharif University of Technology, Iran
Accepted date: February 9, 2017
In this paper, an efficient approach for ultrasonic object segmentation with special application for left ventricle segmentation in echocardiography images is proposed. At first, an efficient hybrid trend for ultrasonic image edge detection is suggested. Then, a modified level set approach is introduced based on the extracted edges and the computed probabilistic map as the stopping criteria for the contour evolution. Both synthetic and clinical images are utilized as validation measures with respect to the prior techniques which indicate outperform results quantitatively and qualitatively. Left ventricle segmentation using proposed method illustrates expert-approved performance, providing a reliable tool for clinical practice, as evidenced by less than 3% ejection fraction error. Making use of probabilistic analysis and elaborated edge detection with level set approach helps to avoid the local minima and excessive contour expansion, while the left ventricle valve is open or there is not clear edge.
Keywords
Left ventricle segmentation, Edge detection, Probabilistic level set
Introduction
Echocardiography is the most commonly used medical ultrasonic device in cardiology and, accordingly, many efforts have been done to extract information more precisely [1].
Edge detection, as the first step in image understanding and analysis, plays an important role in echocardiography images. Therefore, how to quickly and accurately extract the image edge information is crucial [2]. If the edges in an echocardiography image can be identified accurately, subsequently higher level processing can be performed more precisely. Therefore, some authors have been trying to present an edge detection method for a specialized task such as Instantaneous Coefficient of Variation for ultrasonic images (ICOV) [3].
In this regard, a distinguished and meaningful edge namely segmented region is necessary to evaluate left ventricle precisely. The level set method was devised by Osher and Sethian [4], as a powerful technique to segment an object in the image. Level set segmentation is usually categorized to region based and edge based methods. In region based segmentation, pixels are assigned to different regional groups based on a certain characteristics, such as pixel gray value, gradient and texture properties. Edge based segmentation is based on detecting edge between different regions. In edge based level set method, user specifies an initial estimate for the contour, which is iteratively updated by image driven forces to the boundaries of the desired object.
As an outstanding edge based active contours method, we can point to the Distance Regularized Level Set Evolution (DRLSE) which has been proposed by Li et al. [5]. They presented a level set formulation that the regularity of level set function was maintained during the curve evolution.
Edge extraction of noisy image requires applying a preprocessing approach such as filtering. The filters studied in this paper are elaborated as Median, Lee [6], Kuan [7], Wiener [8], Frost [9], Speckle Reducing Anisotropic Diffusion (SRAD) [10], Detail Preserving Anisotropic diffusion (DPAD) [11], Fourier, and wavelet.
There are a lot of reported approaches for image edge extraction. In this paper, the efficiency of most frequently used edge detection operators such as Sobel, Canny, Laplacian and Laplacian of Gaussian (LOG) are evaluated.
Due to misleading edges and background speckle noise of echocardiographic images, the borders of left ventricle may not always be present and they are often difficult to locate. In this paper, an optimized probabilistic edge based level set method using a proposed hybrid trend in edge detection and probabilistic edge map is suggested that is able to deal with both the presence of clutter and lack of meaningful edges.
Material and Methods
Left ventricle segmentation based on only gray-level or only edge usually fails to identify meaningful results due to the complexity of echocardiography images. Hence, both edge and gray-level information are utilized to achieve more accurate results.
The two following steps are applied respectively to achieve a segmented echocardiographic image:
Proposed edge detection approach
The proposed edge detection method consists of five steps as summarized in Figure 1a. This proposed combination has been inspired by both multiplicative nature of speckle noise and video nature of echocardiography images (including lots of similarities in successive frames). Finally, the proposed edge detection approach is evaluated by other hybrid methods (Figure 1b).

Figure 1: a) Block diagram of proposed edge detection approach in ultrasonic images. b) Hybrid trends of ultrasonic edge detection followed by applying speckle reduction filters which have been evaluated in comparison with the proposed method.
Speckle noise of ultrasonic images is considered to be multiplicative noise which can be converted to additive by homomorphic filter using logarithmic transformation. Laupas et al. proposed the following signal dependent noise model for speckle specification in ultrasound images [12].
Where I (x, y) is the noisy image, f (x, y) represents an unknown noise-free image which is what we are aiming for and ηm (x, y) is multiplicative noise. The Log transform leads then to the following equation:

Homomorphic filter is usually utilized as a preliminary filter which is applied followed by another filter such as Block Matching and three Dimensions filtering (BM3D). BM3D is an image denoising approach based on effective filtering in 3D transform domain by combining sliding-window processing with block-matching. The block matching is implemented by searching for blocks which are similar to the currently processed one. A 3D data array is obtained by stacking of matched blocks that is called group. Then a collaborative filtering is applied on extracted group based on following steps:
1. Applying a 3D transform to the group such as Wavelet.
2. Shrinking (by thresholding or Wiener filtering) the transform coefficients.
3. Inverting the 3D transform.
This approach is effectively leads to extract an approximation for each block with attenuated noise [13].
Being aware of variance of speckle noise is useful to have more precise BM3D results. Pyatykh et al. has presented that the noise variance can be estimated as the smallest eigenvalue of the image block covariance matrix [14].
Finally, Canny as the Gaussian edge detector is utilized to distinguish the edges of original ultrasonic image from background.
Proposed level set approach
As mentioned before, a well-distinguished and meaningful object in an echocardiography image needs more additional and complimentary investigations than edge detection. Hence, an optimized probabilistic edge based level set method is proposed to extract a localized object. In the level set method a contour of interest is embedded as the zero level set of a Level Set Function (LSF).
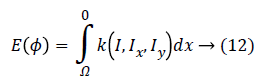
Let ϕ Ω → R be a LSF defined on a domain Ω. The energy function is defined by:
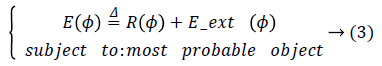
Where R (ϕ) is the level set regularization term which is defined by:
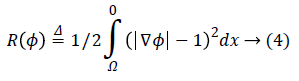
Since the final result of a level set method is the zero level set of the LSF, using a regularization term is necessary to avoid instability. Imposing the regularization term to the energy function, maintains the signed distance properly |ϕ|=1.
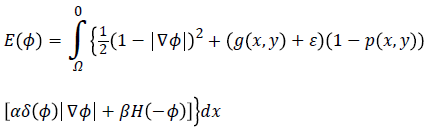
Eext (ϕ) is the external energy that is calculated based on the proposed edge detection approach in previous section and a created probabilistic edge map which is introduced in the following. The external energy must be minimized when the zero level set of LSF ϕ is located at the desired position. To this end, a probabilistic edge based approach is proposed to avoid local minima. Accordingly, Eext (ϕ) is proposed as following:
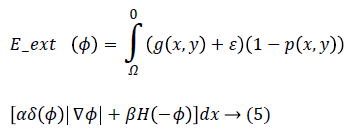
Where g (x, y), p (x, y), ε, α and β are edge indicator function, probabilistic edge map, small positive value and energy coefficients respectively. g (x, y) is an edge indicator function which is calculated based on proposed method in section 2.1 in binary form while 0 and 1 are referring to edge and background respectively. ε is a small positive value to avoid local minimum due to undesirable edges. The parameter ε usually set to 0.1. The coefficients α>0 and β R are energy coefficients while negative value of the β is lead to expand the initial contour and vice versa. δ (.) and H (.) are the Dirac and Heaviside functions respectively.
P (x, y) is a probabilistic edge map indicator which is created for edge weighting to achieve more desirable segmented region and is defined by average of the following statements for each pixel of a given image I (x, y):
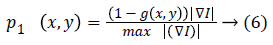
1. Gradient based probability of each edge: The probability of being desired edge is related to gradient value of each edge.
2. Size based probability of connected components: Size of each connected edge is considered to avoid false small edges. The most probable connected component is corresponding to the biggest connected component.
p2 (x, y)=(Size of each connected component(edge))/(Max (size of connected component in g (x, y))) → (7)
3. Vicinity distance to initial contour: If it is assumed that the initial contour has been selected near the desired area then closer edges to the initial contour have more probability to be selected as stopping criterion during contour evolution.

4. Distance between per pixel of a given image and the convex hull of the most probable connected component (edge): It can be lead to excessive contour expansion where there is not clear edge. The most probable connected component is extracted with attention to the average of p1 (x, y), p2 (x, y) and p3 (x, y). Connected component with the maximum average of probability is considered to be surrounded by convex hull. More distance to convex hull is corresponding to the less probability of being desired pixel (Figure 2). This probability is useful where the heart valve is open.

Figure 2: a) An open valve echocardiography image, b) edge extraction using proposed approach, c) Most probable connected component extraction, d) Distance between per pixel of the given image and the convex hull of the most probable connected component, e) Pseudo code of probability map extraction based on MATLAB statements schematically, f) Probabilistic edge indicator schematic.

The illustrated pseudo code (Figure 2e) summarizes the proposed probability map extraction algorithm based on MATLAB software statements schematically.
The proposed Eext (ϕ) consists of two terms: a) the first term
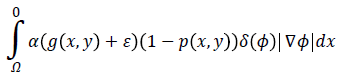
computes the line integral of the function (g (x, y)+ε) (1-p (x, y)) along the zero level set of LSF that is located at the ventricle boundaries when is minimized, b) The second term
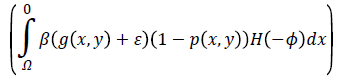
computes a weighted area of the region 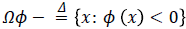 which is necessary when the initial contour is placed far away from desired ventricle boundaries.
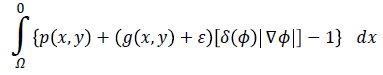
Hence, by applying Equations 4 and 5 in Equation 3 and by defining the optimization criterion, the energy function will be as following:
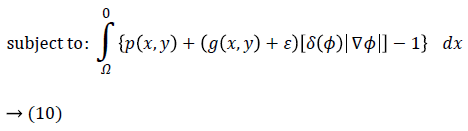
Imposing the condition
for energy function helps to find most probable object (left ventricle) when is minimized. Figure 2f illustrates an overview of probabilistic edge indicator schematic which shows a ball moves to desired minimum by combination of probabilistic and edge maps.
This mentioned energy function can be minimized using the steady state solution of the following gradient flow equation:
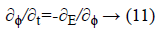
This is an evolution equation of ϕ (x, t) with a spatial variable x in the domain Ω and a temporal variable t ≥ 0 while the evolution starts with a given initial function ϕ (x, t)=ϕ0 (x) in the opposite direction of Gateaux derivative that is the steepest descent direction of the E (ϕ).
According to the Euler-Lagrange statement, for a functional of the form:
The first variation of energy is achieved by:

Therefore, the function E (ϕ) can be minimized as following:
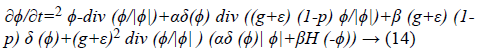
Where ∇2 and div () imply to the Laplacian and divergence operators respectively. The Equation 16 is a probabilistic edge based level set method which has been proposed for left ventricle segmentation of echocardiographic images.
Results
In order to evaluate the performance of the ultrasonic edge detection techniques in comparison with the proposed method, we have performed several experiments on synthetic ultrasound image including lots of self- similarities. These experiments include implementation of speckle denoising filter followed by edge detectors (Figure 1b).
Both subjective experts based and objective evaluations were utilized to assess the methods precisely. To this end, a ground truth image was used which was obtained by a synthetic image. A synthetic image including different shapes, size and gray levels was used for objective evaluation which has been depicted in Figure 3a. Then, Canny edge detector was applied to synthetic image using same gray levels (objects with equal gray levels in synthetic image) to create an accurate and precise reference of edge map. The value of high threshold of Canny is relative to the highest value of the gradient magnitude of the image and the lower threshold is determined by 0.4 × (high threshold). Afterwards, multiplicative noise is added synthetically to the image I, using the equation J=I+n × I, where n is uniformly distributed random noise with mean 0 and variance 0.4 (Figure 3b). The following indices are utilized for quantitative assessment of the filtered image:

Figure 3: a) Synthetic image, b ) Synthetic image including speckle noise, c) Proposed (BM3D and Canny), d) Comparison results of Proposed Method (PM) versus three experts (Exp1, Exp2 and Exp3) based on True positive (TP), True Negative (TN) and Normalized Distance (ND), (e, f and g) Left ventricle segmentation of echocardiography images in different views.
a) Speckle suppression index (SSI): is used to measure the speckle noise suppression over homogeneous areas:

Where, If and Io represent the filtered image and noisy image respectively. Lower values indicate better performance of speckle filtering.
b) Structural similarity index (SSIM): is a method for measuring the similarity between two images which can be computed for two images x and y as following:

Where, μx and μy are averages of x and y respectively. σx, σy and σxy are representative of variance of x, variance of y and covariance of x and y respectively.
Median, Fourier, Wavelet (using Haar, Db1, Bior 6.8, Sym2 and Coif1 mother wavelets), Lee, Frost, Wiener, DPAD and BM3D filters were applied to the noisy synthetic image. As a quantitative assessment of mentioned filters due to speckle noise reduction, SSI and SSIM indices were calculated (Table 1). According to the Wang et al. [15] investigation, Lee filter with window size 7 × 7 and Frost filter (damping factor=2) with window size 5 × 5 were utilized for VV and VH polarization, respectively. The window size of median, DPAD, Wiener and BM3D filters were assigned to be 3 × 3. Regarding to the Sahba et al. [16] investigation, the wavelet transform with Biorthogona1 6.8 as mother wavelet was used by BM3D filter. The cut-off frequency of Fourier and all mother wavelets were set at 10%.
| Filter | SSI | SSIM |
|---|---|---|
| Median | 0.9200 | 0.9894 |
| Fourier | 1.1311 | 0.9892 |
| Haar | 1.1402 | 0.9769 |
| Db1 | 1.1402 | 0.9774 |
| Bior 6.8 | 1.1099 | 0.9879 |
| Sym 2 | 1.1787 | 0.9781 |
| Coif 1 | 1.1590 | 0.9779 |
| Lee | 0.8852 | 0.9984 |
| Frost | 0.7924 | 0.9989 |
| Wiener | 1.2325 | 0.9882 |
| DPAD | 1.9092 | 0.9218 |
| BM3D | 0.7819 | 0.9995 |
Table 1. Filter evaluation.
After applying filters on synthetic noisy image, edge detection methods are subsequently evaluated by Pco, Pnd, MSE and SNR which are defined as following:
a) The percentage of pixels that are correctly detected as edge:
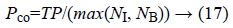
Where N1 represents the number of edge points of the ground truth and NB the number of edge points detected. TP (True Positive) is defined as the number of correctly detected edge pixels.
b) The percentage of pixels that are not detected as edge:
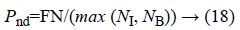
Where, FN (False Negative) is defined as the amount of edge pixels that are not classified as edge pixel.
c) Mean square error (MSE): measures the average of the square of the errors.
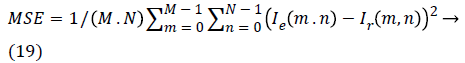
d) Signal-to-noise ratio (SNR):
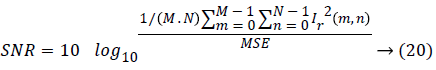
Where, Ie (m, n) and Ir (m, n) represent the M × N edge map image and reference image respectively.
Among all outstanding outcomes (Table 2), the proposed method including BM3D filter and Canny edge detector indicates outperform results quantitatively and qualitatively (Figure 3c).
| Filter | Edge | Pco | Pnd | MSE | SNR |
|---|---|---|---|---|---|
| Lee | ICOV | 0.416 | 0.244 | 0.036 | 2.62 |
| Frost | ICOV | 0.321 | 0.264 | 0.029 | 3.78 |
| Wiener | ICOV | 0.371 | 0.198 | 0.044 | 2.82 |
| DPAD | Sobel | 0.517 | 0.073 | 0.037 | 2.79 |
| Proposed method | 0.681 | 0.019 | 0.028 | 3.84 |
Table 2. Edge detection evaluation.
Finally, in order to evaluate the capability of proposed approach, a set of 430 echocardiography image frames were acquired in the Imam Hospital of Iran including 19 subjects male/female=10/9, mean age=50.3 years, range=28-67 years). Two chamber and four chamber views of echocardiographic images including open and close valves were utilized for assessment. Each image had three ground truth delineations provided by experts. But the average of segmentations of three experts has been considered as the main ground truth image. Pixel based assessment was utilized based on the following criteria (Figure 3d), a) True Positive (TP): pixels correctly detected as ventricle, b) True Negative (TN): pixels correctly detected as outside of ventricle, c) Normalized Distance (ND): Normalized Euclidean distance to ground truth image.
The extracted results imply to ability of proposed method in echocardiography left ventricle segmentation (Figure 3). Also, the assessment results revealed an ejection fraction error less than 3% compared to the average of manual tracing by three experts.
Conclusion
The speckle reduction and detail retention are two key issues in ultrasound image processing. There is an unavoidably compromise between the value of speckle suppression and the value of keeping edge. Therefore, there is no comprehensive method that takes all the constraints into consideration. More false positive and false negative results are observed by using more noise suppression conditions. Some filters perform very efficiently in speckle reduction, but they are not able to preserve the edges and features precisely. Therefore, necessarily less speckle noise does not lead to more precision for echocardiography images edge detection.
Since, we considered both multiplicative natures of speckle noise and video nature of echocardiography images (including lots of similarities in successive frames); our proposed approach to detect edges demonstrates more reliable results in comparison with other evaluated methods in this article.
The proposed probabilistic edge based level set approach performance is completely reliable and is lead to precise and acceptable results in echocardiography Images. There is a high potential for avoiding local minima but detecting non-clear edges due to the basis of method relying on the both edge existence and probability of edge existence. Making use of probabilistic edge map not only leads to restriction of excessive contour evolution in open ventricle valve but also computes better edge line maps.
References
- Santiago C, Nascimento JC, Marques JS. Automatic 3-D segmentation of endocardial border of the left ventricle from ultrasound images. IEEE J Biomed Health Inform 2015; 19: 339-348.
- Boonchieng E, Boonchieng W, Kanjanavanit R. Edge-detection and segmentation methods for two-dimensional echocardiograms. IEEE Computers Cardiology 2004.
- Yu Y, Acton ST. Edge detection in ultrasound imagery using the instantaneous coefficient of variation. IEEE Trans Image Process 2004; 13: 1640-1655.
- Osher S, Sethian JA. Fronts propagating with curvature dependent speed: algorithms based on Hamilton-Jacobi formulations. J. Comput Phys 1988; 79: 12-49.
- Li C, Xu C, Gui C, Fox MD. Distance regularized level set evolution and its application to image segmentation. IEEE Trans Image Process 2010; 19: 3243-3254.
- Prakash KB, Babu RV, Venu Gopal B. Image independent filter for removal of speckle noise. International J Comp Sci Issues 2011; 8: 196-201.
- Kuan DT, Sawchuk AA, Strand TC, Chavell P. Adaptive noise smoothing filter for images with signal dependent noise. IEEE Trans. Pattern Anal Mach Intell 1985; 7: 165-177.
- Puu-An J, Ming-Ni W. Ultrasound speckle image process using wiener pseudo-inverse filtering. Conf IEEE Industrial Electronics Society 2007.
- Vrtost VS, Stiles JA, Shanmugan KS, Holtzman JC. A model for radar images and its application to adaptive digital filtering of multiplicative noise. IEEE Trans Pattern Anal Mach Intell 1982; 4: 157-166.
- Yu Y, Acton ST. Speckle reducing anisotropic diffusion. IEEE Trans Image Process 2002; 11: 1260-1270.
- Aja-Fernandez S, Alberola-Lopez C. On the estimation of the coefficient of variation for anisotropic diffusion speckle filtering. IEEE Trans Image Process 2006; 15: 2694-2701.
- Loupas T, McDicken W, Allan P. An adaptive weighted median filter for speckle suppression in medical ultrasound images. IEEE Transactions Circuits Sys 1989; 36: 129-135.
- Dabov K, Foi A, Katkovnik V, Egiazarian K. Image denoising by sparse 3-D transform-domain collaborative filtering. IEEE Trans Image Process 2007; 16: 2080-2095.
- Pyatykh S, Hesser J, Zheng L. Image noise level estimation by principal component analysis. IEEE Trans Image Process 2013; 22: 687-699.
- Wang X, Ge L, Li X. Evaluation of filters for Envisat Asar speckle suppression in Pasture area. ISPRS Ann Photogramm Remote Sens Spatial Inform Sci 2012.
- Sahba N, Maghooli K, Tavakoli V. An optimized method for B-mode echocardiographic video compression based on motion estimation and Wavelet. IAJIT 2014; 11: 487-492.