ISSN: 0970-938X (Print) | 0976-1683 (Electronic)
Biomedical Research
An International Journal of Medical Sciences
- Biomedical Research (2010) Volume 21, Issue 3
Alternative markers of glycemic status in diabetes mellitus
1Department of Biochemistry, Kasturba Medical College, Manipal University, Mangalore-575004, Karnataka, India.
2Department of Community Dentistry, Manipal College of Dental Sciences, Manipal University, Mangalore-575001, Karnataka, India.
- *Corresponding Author:
- Poornima Manjrekar
Department of Biochemistry
Centre for Basic Sciences
Kasturba Medical College, Manipal University
Bejai, Mangalore- 575004
Karnataka, India.
Accepted Date: March 15 2010
Monitoring people with diabetes by repeatedly estimating blood glucose and glycosylated hemoglobin levels is invasive which becomes appalling and expensive over time. Potential of saliva as a diagnostic tool could be exploited in this regard. 26 diabetes patients were compared with 21 age matched non-diabetic healthy controls for Fasting plasma glucose (FPG), salivary glucose (SG), salivary pH (SpH), Oral health status and markers of oxidative stress in saliva namely Thiobarbituric Acid Reactive substance (TBARS) or Malondialdehyde (MDA) and Total antioxidant activity (AOA). Significantly high FPG (p=0.005) along with high salivary AOA (p < 0.0001) levels, markedly lesser SpH and MDA were found in the diabetic group. Changes in SG levels between the groups were of no consequence. FPG showed positive correlation to SG (r = 0.410) and even better correlation with salivary MDA (r = 0.562) only in diabetes. Since SG levels did not differ between the two groups, the study concludes that conventional marker like FPG is a better indicator of glycemic status. Lower MDA seen in saliva of diabetic group may be probably due to the exceptionally high AOA activity seen in these people
Keywords
Fasting Plasma Glucose, Diabetes, MDA, TOA, Saliva, Salivary glucose, Salivary pH
Introduction
Diabetes mellitus is the commonest endocrine metabolic disorder resulting in hyperglycemia either due to primary insulin deficiency or reduction in its biologic effectiveness or both. Asian Indians seem to be at a greater risk of developing this disorder. Currently we have 40.9 million people suffering from diabetes and the predicted estimate by the year 2025 is around 70 million. The crude prevalence rate of diabetes in urban areas is about 9% and in rural areas, has increased to around 3% of the total population [1].
Long standing diabetes is also associated with poor oral health manifested by xerostomia, periodontitis, gingivitis, etc. Oral problems seen may be related to metabolic control of the disease and poorly controlled glucose levels happen to affect the salivary glands [2,3]. There is evidence suggesting an unbalance between oxidant and antioxidant status associated with diabetes. Mechanisms involved in the increased oxidative stress in diabetes include oxygen derived free radical generation due to nonenzymatic glycosylation (glycation), auto-oxidation of glycation products, and also changes in the tissue content and activity of antioxidant defense systems. Increased levels of the products of oxidative damage to lipids have been detected in serum of diabetic patients, and their presence correlates with the development of complications [4-7]. Free radicals produced as a result of oxidative stress cause chemical modifications and damage proteins, lipids, carbohydrates, nucleic acids in the tissues.
Monitoring people with diabetes involves repeated estimations of Plasma glucose either by finger pricks or by intravenous blood sampling. Hence a non invasive procedure for glucose measurements would be most welcome under the circumstances.
Considering these facts, this study was designed to estimate glucose levels and markers of oxidative stress in saliva, and determine their relation to fasting plasma glucose levels if any.
Oral consent was obtained from the patients and written consent was obtained from the Medical records department (MRD) to access data from the records.
Materials and Methods
The study was conducted at Kasturba Medical College Mangalore.
Study group
Group I: Consisted of 21 normal healthy people without diabetes or any other illness who came for monthly FPG check.
Group II: Consisted of 26 people of the ‘Diabetic club’ with type 2 diabetes who came for their monthly FPG check. They were either on insulin or oral hypoglycemics. Sample collection: Unstimulated whole saliva was collected for a period of 2 minutes in clean fluoride bottles. Samples were immediately centrifuged, supernatant separated and frozen at - 4ºC until further assay.
Biochemical Analysis
The salivary glucose was estimated by Glucose Oxidase Peroxidase method [8] using commercially available kits. Assessment of oxidative stress - Salivary MDA levels as a measure of TBARS were estimated spectrophotometrically by the modified method of Yagi [9]. Total antioxidant activity of saliva was estimated by the inhibition of ferric reducing ability [10].
The data on Fasting plasma glucose values and duration of the disease of diabetics were noted from MRD of Kasturba Medical College Hospital (KMCH), Attavar. The saliva was analyzed at Centre for Basic sciences, KMC, Bejai, Mangalore.
Oral examination
After collection of saliva, a detailed oral health check was done so as to detect the presence of periodontal problems. A Community Periodontal Index (CPI) score was used to assess the severity of the periodontal condition as per the WHO standards [11]. The scores ranged from 0-9. Lesser scores indicated poor periodontal health status.
The salivary pH was recorded qualitatively by dipping pH strips in the collected saliva and the colour obtained was matched on the colour scale for comparison.
Statistics
Descriptive analysis was done using SPSS package. Data was compared by ‘ANOVA’ and Pearsons coefficient was used for correlation studies.
Results
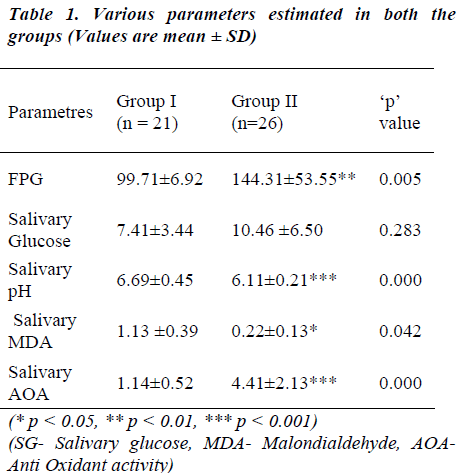
The mean values of the parameters assessed in blood and saliva are displayed in Table 1. Fasting plasma glucose (FPG) was significantly higher in the diabetic group (Group II) as compared to the control (Group I). Whereas, the salivary glucose levels between the groups did not differ significantly. Mean pH levels and MDA levels were considerably higher in the control group. Low MDA levels with significantly elevated AOA levels were seen in the diabetic group.
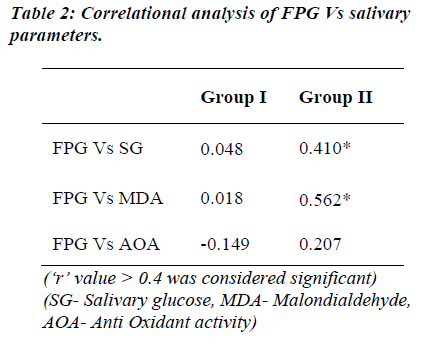
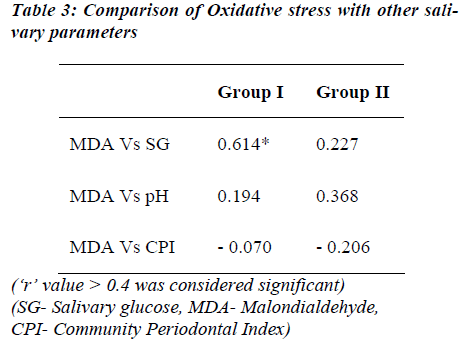
FPG levels show significant positive correlation to the salivary glucose and MDA levels of diabetic group. The FPG levels of both the groups did not show correlation to the AOA levels, except that it showed negative correlation in the control group (Table 2). MDA levels as marker of oxidative stress was correlated with other salivary parameters (Table 3). A significant positive correlation was seen between salivary glucose and MDA levels only. The CPI score showed a non-significant negative correlation with MDA in both the groups studied.
Discussion
Several studies have been conducted on biochemical changes in saliva of diabetic patients with debatable results. Along with SG various parameters such as total proteins, immunoglobulins, amylase, electrolytes, pH, and buffer capacity have been estimated [2,12-16 ]. Regarding the SG concentration, the results obtained in different studies are varied due to diversity of selection criteria / sampling / study population. The current study involved people with type 2 diabetes with mean duration of the disease for 11.43 years as well as healthy control group. The diabetic group had significantly high FPG as compared to controls. Despite these significant differences in FPG levels salivary glucose (SG) levels did not differ and were comparable between the two groups. Similar findings have been reported by Forbat et al [17] on comparison of blood glucose with parotid saliva in diabetics. On the contrary Darwazeh et al [12], Ben-aryeh et al [18], Prabal et al [2] and Shehla et al [19] have observed SG concentration to rise with rise in plasma glucose levels. Furthermore, Prabal et al [2] also found SG levels to decrease in people with long standing diabetes. This latter finding is supportive of present observations. Carda et al [16] estimated various salivary biochemical parameters along with SG and correlated it with the morphological changes in parotid gland in type 2 diabetic patients. They observed that longer duration of the disease leads to fatty infiltration and micro angiopathies of salivary glands and Prabal et al [2] have attributed decreased SG levels in long standing diabetics to this aspect. The current study group was long standing diabetics and failure to observe an increase in SG could be attributed to this fact.
Carda and co-workers [16] observed an increase in SG levels in poorly controlled diabetics with plasma glucose ≥ 180 mg/dl and HbA1c ≥ 8%. Studies conducted by Twetman et al [20] in young type 1 diabetics have also shown that an increase in HbA1c ≥ 8% coexisted with higher glucose levels in saliva. Reuterving [21] observed a positive correlation between parotid saliva and blood glucose levels in type 1 diabetics followed by a decrease in SG concentration during their period of improved metabolic control. Currently the study undertaken was comparison between FPG and SG rather than with HbA1c levels. A significant positive correlation of FPG with SG (r = 0.410; Table 2) was seen in the diabetic group despite similar SG levels as controls.
Soares et al [22] found no difference in SG values between sexes and no correlation of SG to capillary glycemia in healthy adults. The healthy control group of the current study was in accordance with this finding. Jurysta et al [23] studied the dependency of SG concentrations on glycemia during oral glucose tolerance test (OGTT) in both diabetic and non-diabetic subjects. A two fold increase in SG was observed within first 60 min followed by decrease in SG concentrations during successive sampling despite unaltered salivary flow. Moreover between type 1/ type 2 diabetes SG levels did not vary, level of glycemia had no significant correlation with SG levels or glucose excretion rate and remained unaffected by stimulated or unstimulated collection of saliva. Thus it can be inferred that acute changes in glycemia as during OGTT does not affect SG levels whereas chronic glycemia does so.
Other parameters assayed were MDA and Total antioxidant activity (AOA) in saliva. Significantly low MDA levels and very high AOA was seen in the diabetic group. Astaneie et al [24] have reported no difference in salivary Vs serum MDA levels and presence of high AOA in type 1 diabetics. Studies conducted on diabetic rats have reported an increase in salivary and serum MDA with variable antioxidant activity [25]. Celec et al [26] have found an increase in MDA levels in non diabetics which was attributed to age, altered periodontal status and smoking. Hodosy et al [27] suggest that MDA levels depend on the time of sampling and also are affected by factors like tooth brushing and antioxidative therapy received by the patients. Analysis of AOA showed that, saliva of diabetic patients had more antioxidant power than normal healthy people. It could be thus explained that high AOA in saliva could be an indication for the existence of oxidative stress and is subsequently responsible for decrease in the MDA levels of this group.
Studies by Reznick et al [15] and Astaneie et al [24] have shown both salivary and serum antioxidants to increase depending on HbA1C levels and severity of diabetes. The AOA levels of both the groups did not show notable correlation with FPG but a significant correlation existed between salivary MDA and FPG levels in the diabetic group (Table 2). Serum MDA levels have been compared to salivary MDA levels with no significant difference by Astaneie et al [24] in diabetics and by Celec et al [26] in people with periodontitis. It can be thus inferred that salivary MDA levels could as well reflect serum MDA levels without any difference. In control population, MDA levels correlated significantly only with SG levels (‘r’ =0.614; Table 3). SG rather than FPG could be a better marker of oxidative stress in these people considering the fact that SG levels did not differ between two groups.
Oral health status was evaluated by salivary pH and CPI score. Diabetic group had significantly altered pH (acidic) pointing to poor oral health. Decrease in pH favors microbial growth, a common manifestation in diabetes [2,3,13,20] which is known to further disturb the status. Thriving microbes using the available glucose can also be an explanation for normalization of SG in this group.
The CPI score although not significant showed a negative correlation with MDA levels in both the groups suggesting that, increase in MDA levels was associated with decrease in CPI scores in both the groups. As per scoring pattern lower scoring indicates poorer periodontal health status, suggesting oral health may be influenced by MDA levels which in turn are affected by FPG or SG levels.
Overall, salivary glucose concentrations showed no difference between two groups implying association of high plasma glucose with high SG levels to be an infrequent observation which may be affected by metabolic control of the disease. Significant positive correlation of FPG with SG in diabetics further supports this aspect. Hence the usage of SG as the only tool for evaluating glycemic status is debatable. Studies to compare long term indicators of glycemic status viz HbA1C, fructosamine levels with salivary glucose / glycated proteins can be undertaken. Salivary MDA is not completely elucidated as to its content, composition and source. Advances in uncovering the origin of these markers of lipid peroxidation may have profound importance in evaluation of diabetes.
References
- Current Diabetes scenario in India. Br. J Diabetes Vasc Dis 2007; 7(1): 12-16.
- Pal P, Desai NT, Kannan N, Masur VN, Daniel MJ, Bhatt N. Estimation of Salivary glucose, salivary amylase, salivary total protein and periodontal microflora in Diabetes mellitus. JIDA 2003; 74: 143-149.
- Edbald E, Lundin S, Sjodin B, Aman J. Caries and salivary status in young adults with type 1 diabetes. Swedish Dental Journal 2001; 25(2): 53-60.
- Vadde R, Rama J. Evaluation of Oxidative stress in Insulin Dependent Diabetes Mellitus (IDDM) patients. Diagnostic Pathology 2007; 2: 22.
- Wolff SP: Diabetes mellitus and free radicals. Free radicals, transition metals and oxidative stress in the etiology of diabetes mellitus and complications. Br Med Bull 1993; 49: 642-652.
- Brownlee M. Biochemistry and molecular cell biology of diabetic complications. Nature 2001; 414:813-820.
- Wieruszwysocka B, Wysocki H, Byks H, Zozulinska D, Wykretowicz A, Kazierczak M. Metabolic control quality and free radical activity in diabetic patients. Diabetes Res. Clin Pract 1995; 27: 193-197.
- Trinder P. Determination of glucose in blood using glucose oxidase with an alternative oxygen acceptor. Ann Clin Biochem 1969; 6: 24.
- Poornima K, Cariappa M, Asha K, Kedilaya H.P, Nandini M. Oxidant and antioxidant status in vegetarians and fish eaters. Ind J Clin Biochem 2003; 18(2): 197-205.
- Koracevic D, Koracevic G, Djordjevic V, Andrejevic S, Cosic V. Method for the measurement of antioxidant activity in human fluids. J Clin Pathol 2001; 54: 356- 361.
- Oral health surveys Basic methods. IV ed, WHO, Geneva 1997.
- Darwazeh AM, Macfarlane TW, McCuish A, Lamey PJ. Mixed salivary glucose levels and candidal carriage in patients with diabetes mellitus. J Oral Pathol Med, 1991; 20(6): 280.
- Ben-Aryeh H, Serouya R, Kanter Y, Szargel R, Laufer D. Oral health and salivary composition in diabetic patients. J Diabetes Complications 1993; 7(1): 57-62.
- Dodds MW, Dodds AP, Effects of glycemic control on saliva flow rates and protein composition in non-insulin dependent diabetes mellitus. Oral surg Oral Med Oral Pathol Oral Radiol Endod 1997; 83 (4): 465-470.
- Reznick AZ, Shehadeh N, Shafir Y, Nagler RM. Freeradicals related effects and antioxidants in saliva and serum of adolescents with Type 1 diabetes mellitus. Arch Oral Biol 2006; 51(8): 640-648.
- Carda C, Mosquera-Lloreda N, Salom L, Gomez de Ferraris ME, Peydró A. Structural and functional salivary disorders in type 2 diabetic patients. Med Oral Patol Oral Cir Bucal 2006; 11: E309-14.
- Forbat LN, Collins RE, Maskell GK, Sonksen PH. Glucose concentrations in parotid fluid and venous blood of patients attending a diabetic clinic. J Royal Soc Med 1981; 74: 725-728.
- Ben-Aryeh H, Cohen M, Kanter Y, Szargel R, Laufer D. Salivary composition in diabetic patients. J Diabet Complications 1988; 2 (2): 96-99.
- Shehla A,Muniza Y, P.Q. R. Siddiqui, Junaid A, Salivary glucose concentrations in patients with diabetes mellitus ? a minimally invasive technique for monitoring blood glucose levels. Pakistan Journal of Pharmaceutical Sciences 2001; 14(1): 33-37.
- Twetman S, Johansson I, Birkhed D, Nederfors T. Caries incidence in young type 1 Diabetes mellitus patients in relation to metabolic control and caries associated risk factors. Caries research 2002; 36:31-35.
- Reuterving CO, Reuterving G, Hägg E, Ericson T. Salivary flow rate and salivary glucose concentration in patients with diabetes mellitus influence of severity of diabetes. Diabet Metabol 1987; 13(4):457-62.
- Soares MSM, Batista-Filho MMV, Pimentel MJ, Passos IA, Chimenos-Küstner E. Determination of salivary glucose in healthy adults. Med Oral Patol Oral Cir Bucal 2009 Oct 1;14 (10):e510-3.
- Jurysta C, Bulur N, Oguzhan B, Satman I, Yilmaz TM, Malaisse WJ, Sener A. Journal Biomed and Biotech 2009; doi:10.1155/2009/430426.
- Astaneie F, Afshari M, Mojtahedi A, Mostafalou S, Zamani MJ, Larijani B, Abdollahi M. Total antioxidant capacity and levels of epidermal growth factor and nitric oxide in blood and saliva of insulin-dpendent diabetic patients. Arch Med Res 2005; 36(4): 376-81.
- Nogueira FN, Carvalho AM, Yamaguti PM, Nicolau J. Antioxidant parameters and lipid peroxidation in salivary glands of streptozotocin-induced diabetic rats. Clin Chim Acta 2005; 353 (1-2): 133-139.
- Celec P, Hodosy J, Celecová V, Vodrázka J, Cervenka T, Halcák L, Bozek P, Kopáni M, Kúdela M. Salivary thiobarbituric acid reacting substances and malondialdehyde- their relationship to reported smoking and to parodontal status described by the papillary bleeding index. Dis Markers 2005; 21(3): 133-137.
- Hodosy J, Celec P. Daytime of sampling, toothbrushing and ascorbic acid influence salivary thiobarbituric acid reacting substances--a potential clinical marker of gingival status. Dis Markers 2005; 21(4): 203-207.


