ISSN: 0970-938X (Print) | 0976-1683 (Electronic)
Biomedical Research
An International Journal of Medical Sciences
Research Article - Biomedical Research (2016) Computational Life Sciences and Smarter Technological Advancement
Abnormal walk identification for systems using gait patterns
1Department of Electronics and Computer Engineering, Syed Ammal Engineering College, Ramanathapuram, India
2Department of Electronics and Computer Engineering, Government College Of Engineering, Salem, India
- *Corresponding Author:
- S.M.H. Sithi Shameem Fathima
Department of Electronics and Communication Engineering, Syed Ammal Engineering College, India
Accepted on August 11, 2016
Gait based person recognition is an emerging technique in this recent era. Most of the biometrics system requires high resolution and proximity sensors. Gait based identification is used for identification, authentication and gender calculation. Due to various reasons, 5 to 15% of persons are not having normal walk pattern because of drug abuse or habitual and medical rehabilitation. So it is mandatory to classify normal or abnormal walk. Steppage gait, circumduction gait, Charlie Chaplin gait and antalgic gait are taken into consideration for this data base. In this modern time by using computer vision based techniques, normal and abnormal walk pattern can be identified. This paper considers gait cycle of a person of abnormal walk and his height and width are taken as feature vectors. K-Nearest Neighbour (KNN), Convolutional Neural Networks (CNN) and Artificial Neural Network (ANN) Classifiers are used to classify normal and abnormal gait patterns. The Artificial Neural Network (ANN) classifier outperforms well than K-Nearest Neighbour (KNN) and Convolutional Neural Networks (CNN) classifiers and it produced good recognition rate using this feature vectors.
Keywords
Gait recognition, Abnormal walk, KNN classifier, CNN classifier, ANN classifier.
Introduction
An ever increasing crime rate, there is always a demand for intelligent surveillance system. Biometric plays a vital role in identifying the person since the physical traits are always with the person. The recent biometrics includes face, iris and finger print. These are the biometrics do not valid if the subject wears helmet, mask and gloves. Also these said biometric require proximity sensors to measure face or iris or finger print. More over the subjects who have measured by these devices has mentally prepared for their measuring activity. In order to avoid these drawbacks, gait recognition technique is emerged as a supporting biometrics as an alternative solution. Gait refers to one’s own walk pattern. It is unique for every individual person. Gait requires only low resolution and nonproximity sensors. Gait recognition mainly consider the gait cycle. Gait cycle starts, when one foot makes contact with the ground and ends with the same foot contacts the ground again. Gait cycle is unique for every individual. In recent years, most of the recognition systems and the concerned algorithms are dedicated to identify the person with normal walk styles. A number of databases are available, like CASIA (China), USF gait Challenge data set, CMU Mo Bo dataset, OU-ISIR (Japan) database etc., are having silhouettes of normal walking persons with various angle, various speed, different clothing. So the new algorithms are required to classify the persons with abnormal gait patterns. Hence this paper, considers the problem of classification of persons who is having a normal gait pattern or an abnormal walk pattern. Such a categorization minimizes the effort of identifying a person from a large data base and henceforth reduces the recognition timing. The abnormality in walking sequences is due to obesity, medical reasoning and rehabilitations, human psychology, drug abuses or due to occurrence of criminal offences.
Contribution in this work
• A dataset is created with normal and abnormal gait using 105 subjects of both male and female subject of age variation is above 18 to 35.
• The walk includes antalgic gait, circumduction, Charlie Chaplin gait, steppage gait
• Gait cycle, height and width parameters of every subjects taken as the feature vectors.
• K-Nearest Neighbour (KNN), Convolutional Neural Networks (CNN) and Artificial Neural Network (ANN) Classifiers are used to train and test the feature vectors.
Literature Survey
Machine learning techniques can be used here as it learns like intelligence and covers a wide range of processes that are complicated to classify accurately. A numerous researches are being carried out on gait analysis to determine any abnormality in gait. Rohila et al. proposed a method which distinguished between normal and abnormal gait pattern [1]. A person having abnormal gait may be categorize as a suspicious one and hence alarming actions may be taken. Experiments have been done on real world data and almost 77 subjects were walked on the track. The system has been trained for normal walk for real world subjects. Aspect ratio, knee rotation, thigh rotation were taken into consideration for training and testing using nearest neighbour classifier. Smith et al. proposed abnormal walk identification pattern by measuring the hip angles, knee angles by, motion estimation techniques. Each subject was instructed to walk in one of five different ways like normal walk, limping, shuffling with one leg straight and jogging [2]. These trials result in having one normal walking data set for each subject and four walking sets with different abnormalities being exhibited in each individual video sequences. Wang et al. proposed a simple and effective method to abnormal gait analysis using computer vision techniques using motion metric histogram [3]. The proposed method initially extracted the human silhouettes from input videos and frame-to-frame optical flows are evaluated. The motion metric histogram of silhouette-masked flow is calculated with Eigen space transformation.
Hybrid Extreme Learning Machine (ELM) algorithm classifies the data precisely and was proposed by Rani et al. [4]. In this paper, a two phase algorithm is proposed and implemented to detect the abnormal gait. During the first phase, ranking is performed to determine the top gait features using T-Test techniques. And in the second phase, the machine learning algorithms are used for training and testing of abnormal gait. Okusa et al. proposed young and elderly person abnormal gait analysis using statistical registration and modelling on video data [5]. In this section, K-Nearest Neighbour (KNN) classifier (K=3), using the estimated parameters, to perform normal/ abnormal gait detection, and present results from an experiment involving 120 subjects (young person), and 60 subjects (elderly person). Mann et al. proposed the systematic review which aims to identify pertinent methodologies and characteristics measured using plantar pressure devices and to consolidated their associations with Running Related Injury (RRI) [6]. Retrospective and prospective, biomechanical studies on running using any kind of pressure-sensitive device with running related injury as an outcome were included. Continuous measurement in the natural running environment will help uncover the link between epidemiological study findings and biomechanical analyses. This approach will provide more complete and representative information to identify potential risk factors for specific running related injury.
Villarrasa et al. proposed the alterations were detected in the intermittent postural control in obese children [7]. According to the results obtained, active anticipatory control produces higher center of pressure displacement responses in obese children. A multi-layered back-propagation algorithm-based artificial neural network for walking, jogging, jumping, running gait pattern classification and compared the results obtained with those produced using the k-means and k-nearest neighbour algorithms. A novel aspect of the feature extraction procedure was the use of kernel-based principal components analysis was proposed by Semwal et al. [8]. Stroke survivors commonly adopt sedentary activity behaviours by the chronic phase of recovery. However, the change in activity behaviours from the sub-acute to chronic phase of stroke is variable. This study explored the recovery of ambulation activity. Most activity was spread across short bouts so that gait cycle changed. Whereas most number of bouts was of low intensity, most time was spent in moderate intensity ambulation across all time points. Fathima et al. proposed normal/abnormal gait classification using ellipse fitting model [9]. In this work two ellipses are fitted to cover the whole body. Vertical ellipse covers head to toe and horizontal ellipse covers ankle to toe portions. The feature vectors considered as major axis, minor axis of the two ellipses and height and width. This algorithm effectively classifies the abnormal person using SRC classifier. The above said algorithms are effectively classified as normal and abnormal walk. The proposed work further classified the abnormal walk into four different walks (Figure 1).

Figure 1. The block diagram shows the training phase and testing phase for Normal/Abnormal Gait classification.
Video Acquisition
During video acquisition of subjects are asked to wear different types of clothes, shoes and slippers. They were asked to walk on the track shown in Figure 2. Totally 105 subjects were considered for creating the dataset. The video has been recorded using Sony handy cam HDR-CX240. It has a CMOS sensor with a size of 1/5.8 inch. Resolution of "1920 × 1080", "1440 × 1080", frame rate of 60 pixels. The distance between camera and track was around 25 feet and length of the track was 20 feet in such a way the shadows are eliminated. Three minutes of continuous normal walk and abnormal walk that converted around 1200 frames in JPEG (.jpg) format with frame size of 1920 × 1080 were thus obtained. These images are converted into silhouettes. In this experiment we took movie of 105 subjects walking video data from side view 20 steps, number of male candidates are 85 with average height of 171 cm and number of female candidates 20 with average height of 158 cm and apply to our proposed method for the gait analysis.

Figure 2. Frame conversion.
Background subtraction
One of the common and easy methods to perform the segmentation operation is image subtraction technique (Figure 3). The background image is subtracted from the current frames then threshold is applied to segmented portion. Subtraction of current frame to known frame is less than the threshold value it is called background or otherwise foreground. Threshold value is known as shown in Equation 1.

Figure 3. Back ground subtraction and silhouette reconstruction.
Silhouette Reconstruction
After the Background subtraction the silhouettes are having some discontinuity and noises. This can be easily removed by morphological operation. By using continuous erosion and dilation operations the discontinuities and noises is removed .Then it is suitable for recognition procedure (Figure 4).

Figure 4. Silhouette reconstruction.
Feature Extraction
Gait recognition mainly depends on the gait cycle under the hypothesis of gait cycle is unique for every individual person. In this paper three features are suitably selected. They are gait cycle, silhouettes height and width of a person.
Gait cycle calculation
The gait cycle starts when the right foot touches the ground and the cycle ends when the same foot touches the ground again. Gait cycle and its parameters, cadence/speed can be calculated using mathematical relations by Kharb et al. [10]. By using Image processing, a gait cycle can be evaluated by the method of counting the successive number of white pixels in every frames. The system initially finds the number of white pixels in reference frame and match with the nth frame of similar white pixel count. Then the number of frames from reference frame to similar white pixel count frame n is considered as a gait cycle (Figure 5).

Figure 5. Abnormal gait cycle.
Height and Width Calculation
The maximum Height (H) and the maximum Width (W) features of silhouettes are extracted by using blob detection method. When a person moves towards the camera, the height value is continuously increasing. In the same way, a person moves away from the camera, the frame height is continuously decreasing. By defining the bounding box and the centroid point for each observed frame is calculated [11-15].
Let H1, H2, ……HN be the successive skeleton heights in a gait cycle. Then the maximum height of the person in the entire silhouettes is denoted by Hmax=max (H1, H2, …HN)
The height of outer contour of binary silhouettes is calculated as feature vectors. For successive N frames Hmax ε RM
The Eigen values corresponding to the width vector is computed as {U (1)….U (M)}
Similarly variation of the width is an important cue for gait analysis, since it contains structural and dynamical information about the gait. When a person stands in a middle stance position, the space between the two legs is small and hence the width is reduced. A person walks by swinging his arms then the width of a skeleton is increased. The maximum spacing between the two legs for a person is expressed as in Equation 2
Wmax=max (W1, W2,….WN)
The width of the outer contour of the binarised silhouettes of a walking person is one of the feature vectors. For N number of frames, Wmax ε RM. So Eigen values, corresponding to width vector are then computed by Eigen vectors of {V (1)…V (M)}
The centroid point of human silhouettes are obtained by using the given Equation 3.
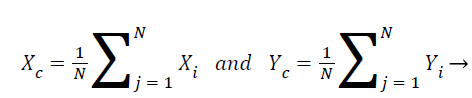 (3)
(3)
Where (Xc, Yc) represents the average contour pixel position (Xi, Yi) represents the points on the human blob. N is the total number of points on the contour.
Training and Testing with Different Classifiers
The feature vectors are trained and tested with K-Nearest
Neighbour (KNN), Convolutional Neural Networks (CNN) and
Artificial Neural Network (ANN) Classifiers. K-Nearest
Neighbour (KNN) is one of the simplest algorithms for pattern
classification. The algorithm is fits to instance based
competitive learning algorithms. It models the problem using
data instances and it internally uses competition between
model elements in order to make a predictive decision by using
all training observations are retained as part of the model. The
similarity measure is obtained, depends on the type of dataset.
For real-valued data, the Euclidean distance can be used. Here
K=3 is selected. Let {xi, yi}i=1 n denote a training set of n
labelled examples with input xi ε RD. For the discrete binary to
represent whether yi and xi are matched with each other or not.
The computation of squared distance between two vectors are
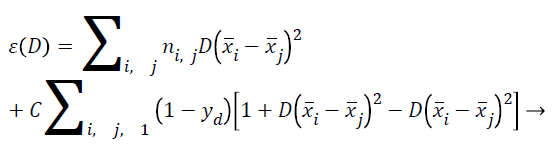
denoted by the given Equation  is linear
transform which optimizes the K NN classification. The cost
function over the distance metrics is defined by the Equation 4.
is linear
transform which optimizes the K NN classification. The cost
function over the distance metrics is defined by the Equation 4.
 (4)
(4)
Here nij ε {0, 1} is to indicate whether input ͞xj is an expected neighbour of ͞xi
Experimental Analysis
In this section the effectiveness of the proposed methodology is analysed by investigating experiments using the abnormal gait data set.
Training phase
During the training phase, all persons abnormal walk sequences was recorded. Feature vectors of gait cycle, height and width are extracted using all the three classifier for all the 105 persons. These extracted features are trained by K-Nearest Neighbour (KNN), Convolutional Neural Networks (CNN) and Artificial Neural Network (ANN) Classifiers (Figure 6). It is stored in a data base for further matching process. The feature matrix dimension consists of 105 × 105 × 105.

Figure 6. Recognition rate obtained by KNN,CNN and ANN classifiers.
Testing phase
During the testing phase, any one of the video frame was given. Then normal and abnormal walk style was identified using this algorithm. Here the sample of 20 persons and their recognition percentage was given in the Table 1.
| Persons | Recognition rate (KNN) % | Recognition rate (CNN) % | Recognition rate (ANN) % |
|---|---|---|---|
| Person 1 | 77.4 | 78.9 | 81.1 |
| Person 2 | 79.6 | 81.8 | 82.9 |
| Person 3 | 81.6 | 85.7 | 88.3 |
| Person 4 | 84.6 | 68.7 | 75.8 |
| Person 5 | 70.9 | 72.7 | 76.8 |
| Person 6 | 89.6 | 91.4 | 93.5 |
| Person 7 | 74 | 80.8 | 84.5 |
| Person 8 | 77.4 | 80.7 | 83.3 |
| Person 9 | 76.5 | 79.9 | 81.1 |
| Person 10 | 75.3 | 77.6 | 79.5 |
| Person 11 | 81.8 | 82.5 | 84.6 |
| Person 12 | 82.3 | 83.8 | 85.9 |
| Person 13 | 86.8 | 87.7 | 89. 9 |
| Person 14 | 76.9 | 77.8 | 79.6 |
| Person 15 | 71.8 | 73.6 | 76.9 |
| Person 16 | 77.4 | 79.8 | 81.6 |
| Person 17 | 74.6 | 75.5 | 80.4 |
| Person 18 | 82.9 | 83.6 | 85.8 |
| Person 19 | 84.9 | 85.9 | 87.6 |
| Person 20 | 78.5 | 79.7 | 81.5 |
Table 1. Recognition rate with different classifiers.
Result and Discussion
Initially we have been working to demonstrate the classification of normal and abnormal walk patterns. Then the applicability and reliability of our gait classification scheme used to differentiate various abnormal gait patterns in unconstrained real world settings, using a suitable image processing techniques. In this work our algorithm identified the four different abnormal walk patterns from the abnormal walk sequence (Table 2 and Figure 7). Still the algorithm shows its weakness to find completely the abnormal walk patterns. In addition, we are working to adopt an approach to situations with several people in such a way that they will occlude each other [16-21].
| Actual Class | Predicted Class | |||
|---|---|---|---|---|
| Antalgic gait | Charlie Chaplin gait | Steppage Gait | Circumduction Gait | |
| Antalgic gait (50) | 40 | - | - | - |
| Charlie Chaplin gait (50) | - | 45 | - | - |
| Steppage Gait (50) | - | - | 38 | |
| Circumduction Gait (50) | - | - | - | 34 |
Table 2. Various abnormal gaits and its correct prediction.

Figure 7. Gait classifiction accuracy for different gati patterns.
References
- Pochini AC, Ejnisman B, Andreoli CV, Monteiro GC, Silva AC, Cohen M, Albertoni WM. Pectoralismajor muscle rupture in athletes: A prospective study. Am J Sport Med 2010; 38: 93-98.
- Smith BA. Determination of normal or abnormal gait using a two dimensional video camera, dissertation MS Thesis 2007, Blacksburg, Virginia.
- Wang L. Abnormal walking gait analysis using silhouette-masked flow histograms. 18th International Conference on Pattern Recognition (ICPR06).
- Rani MP. Abnormal GAIT classification using hybrid ELM. Elect Comput Eng 2014; IEEE 27th Canadian Conference on Toronto.
- Okusa K, Kamakura T. Human gait modeling and statistical registration for the frontal view gait data with application to the normal/abnormal gait analysis. Transact Eng Technol 2013; 247: 525- 539.
- Mann R, Malisoux L, Urhausen A, Meijer K, Theisen D. Plantar pressure measurements and running-related injury: A systematic review of methods and possible associations. Gait Posture 2016; 47: 1-9.
- Villarrasa-Sapiñaa I, García-Massób X, Serra-Añóc P, Garcia-Lucergac C, Luis- Millán G, Lurbed E. Differences in intermittent postural control between normal-weight and obese children. Gait Posture 2016; 49: 1-6.
- Semwal VB, Raj M, Nandi GC. Biometric gait identification based on a multilayer perceptron. Robotics Auto Syst 2015; 65: 65-75.
- Fathima SS, Banu W. Abnormal gait classification using silhouettes. ARPN J Eng Appl Sci 2015; 10: 1819-6608.
- Kharb A, Saini V, Jain YK, Dhiman S. A review of gait cycle and its parameters. IJCEM Int J Comput Eng Manag 2011.
- Kumar AGB, Daigle KE, Pandy MG, Cai Q, Aggarwal JK. Lower limb kinematics of human walking with medial axis transformations,in motion of non- rigid and articulated objects. Procceding of the 1994 IEEE Workshop, Austin TX, 70-76.
- Bleyenheuft C, Bleyenheuft Y, Hanson P, Deltombe T. Treatment of genu recurvatum in hemiparetic adult patients: A systematic literature review. Annal Physic Rehab Med 2010; 53: 189-199.
- Coquart JB, Tourny-Chollet C, Lemaıtre F, Lemaire C, Grosbois JM, Garcin M. Relevance of the measure of perceived exertion for the rehabilitation of obese patients. Annal Physic Rehab Med2012; 55: 623-640.
- Cover T, Hart P. Nearest neighbor pattern classification. IEEE Transact Info Theory 1967; 13: 21-27.
- Fathima SS, Banu W. Elliptical Model for Normal and Abnormal Gait Classification. Res J Appl Sci Eng Technol 2015; 11: 1238-1244.
- Murray M. Gait as a total pattern of movement. Am J Physical Med 1967; 46: 290-332.
- Moore S, Schurr K, Wales A, Moseley A, Herbert R. Observation and analysis of hemiplegic gait: Swing phase. Australian J Physiother 1993l; 39: 271-278.
- Rohila N, Kumar B, Chauhan N. Abnormal Gait Recognition. Int J Comput Sci Eng 2010; 2: 1544-1551.
- Mahendrana N, Kuysb SS, Brauera SG.Recovery of ambulation activity across the first six months post-stroke. Gait Posture 2016.
- Bar-Cohen Y. Biologically inspired intelligent robots using artificial muscles. International Conference on MEMS NANO Smart Syst 2003.
- Góes SM, Leite N, deSouza RM, Homann D, Osiecki ACV, Stefanello JMF, Rodacki ALF. Gait characteristics of women with fibromyalgia: A premature aging pattern.Revistabrasileira de Reumatologia Revbrasreumatol2014; 54: 335-341.