ISSN: 0970-938X (Print) | 0976-1683 (Electronic)
Biomedical Research
An International Journal of Medical Sciences
Research Article - Biomedical Research (2018) Volume 29, Issue 20
A review on optimized K-means and FCM clustering techniques for biomedical image segmentation using level set formulation
Chenigaram Kalyani, Kama Ramudu* and Ganta Raghotham Reddy
Department of ECE, KITS-Warangal, Telangana, India
Accepted date: October 20, 2018
DOI: 10.4066/biomedicalresearch.29-18-1052
Visit for more related articles at Biomedical ResearchImage segmentation plays a vital role in a research area of computer vision as well as image processing. One of the most popularly used image segmentation techniques are named as Clustering. It is a process of segmenting a non-homogenous image intensities into a homogeneous regions based on their similarity function. But, here the clustering techniques need a prior initialization of random cluster centers, which is a primary disadvantage. So, in order to get an “optimum” cluster centers we need to initialize a PSO algorithm in pre-processing an image. In this way successfully we can stay away from the drawback of sensitivity of initial esteems. Algorithm of PSO clustering, were widely utilized in recognition of pattern approaches just like an image segmentation, after initializing the PSO algorithm, it improves the clustering efficiency but we do have increasing of computational time based on the population size. At the same time few boundary leakages i.e., outliers presented in clustered outputs. So, in post-processing, we were introducing a level set formulation (LSF) to overcome the boundary leakages which were occurred in pre-processing of an image. Here in this paper, we give a brief description on few clustering methods at the same time some of the recent works by researchers on these methods and also we present K-means in addition with Fuzzy C-means (FCM) clustering algorithm along with the Particle Swarm Optimization an application to a biomedical image for an efficient segmentation of the biomedical images. The performances of the segmentation outputs are compared using Dice similarity and Jaccard similarity values and it validate the effectiveness of the proposed method.
Keywords
Biomedical image segmentation, K-means, Fuzzy c-means clustering, Particle swarm optimization, Level set formulation
Introduction
Image segmentation [1] is the method at which dividing the digital image into a multiple segments like sets of a pixel, which is also treated as a super-pixel in a computer vision. Here the aim of a segmentation [2] were that to have a streamline and to change the depiction of image into some type which is more significant as well as easier to examine. Typically image segmentation were utilized to locate an objects as well as boundaries just like curves, lines etc.., in an images. Image segmentation is the strategy or a procedure of designating a mark to each pixel in the image so pixels with a comparable name portion definite qualities. The characterization of image segmentation grouped into two kinds: Local segmentation which is worried about particular part or district of an image and also global segmentation which is worried about segmenting in an entire image, dwelling of enormous number of pixels. In image segmentation fundamental applications were: Medical imaging, content based image recovery, and Automatic Traffic Control (ATC) frameworks, object discovery and additionally recognition tasks and so on. Among many segmentation methods mostly we come across clustering analysis.
Many modified clustering algorithms had been introduced and proven to be an effective for image segmentation. In the images as well as segments consists of some specific noise and clustering accuracy can be specifically upgraded or developed by the process known as a “Particle Swarm Optimization (PSO)”. In 1995, PSO were introduced by the Eberhart in addition with Kennedy. Originally, these two were initiated an emerging computer simulations software of a birds flocking around the food sources, then earlier comprehended in what way their algorithms are going to get worked on optimization issues. The method can be applied to optimization issues of large dimensions, often producing eminent solutions more rapidly than alternative approaches and it has a low convergence rate in the iterative process. Here in the combined approach i.e. PSO and clustering algorithms were suffered from edge and boundary leakage problems. To overcome these leakages, we are implementing optimized clustering algorithm to level set formulation. The level set formulation-LSF’ [3] were initially introduced by means of tracking moving boundaries in other areas like computational geometry, image enhancement as well as grid generation, shape detection and recognition, noise removal, and electro-migration. It could be utilized to efficiently address an issue of a curve or surface and so on.
The level set technique bears immense number of points of interest: it's a without parameter, it's an understood, gives a straight way to have the estimation on a geometric parameters of a developing structure, and is characteristic, takes into consideration a difference in topology. It can be used to express an optimization system, as presented by Zhao et al. in the year 1996. One can presume that it is an exceptionally helpful structure for tending to numerous utilizations of computer vision furthermore medicinal image examination. The classification of level set formulation image segmentation can be of two types. They were: (i) Edge based-segmentation; (ii) Region based-segmentation. Geodesic Active Contour (GAC) in an edge based active contour technique is popularly chosen method which progresses the gradient of an image for the purpose of acquiring an Edge Stopping Function (ESF) on a way to localize the contour about a boundaries of the preferred object. Active contours’ utilizes balloon forces popularly in order to improve the contour which is very composite or unpredictable to enterprise. Here Balloon force sign chooses a developing contour positive for contracting and in addition negative for an expansion. For an extensive balloon forces the contour progresses faster on the other hand it may familiar with weak edges and the form may not be acceptable in the incident that it’s a small. To recognize or distinguish inside as well as outside limits of an object Edge based models fails, if an initial contour characterized is a long way from favored objects as these Active Contour Models (ACM's) were slanted to nearby minimum. The disadvantages which were occurred mostly in an edge based Active Contour Model-ACMs can be overcome by a model called Region based ACM’s. These gives a very good result as well as very less sensitive towards noise for an images with a fragile or with-out edges as they uses a statistical data with-in the contour or it might be outside a contour. Albeit, beginning contour form were very much characterized far from an object, and has a capacity to distinguish inside and additionally outside boundaries of a chose object. Chan et al. were presented a conspicuous active contour without edges which delight at a level set model (LSM) that confines the Mumford-Shah work. A C-V prototype includes a possession of a global segmentation which segments all the objects within the image nevertheless of a beginning contour. Though Geodesic Active Contour (GAC) show discriminates inside boundaries if a contour were characterized inside an object as well as identifies outside boundaries at which it were outside, with the intention of it could be known that Local Segmentation Formulation (LSF). To segment medical images in k-means, FCM and KFCM clustering algorithm this cannot be segmented efficiently with the GAC as well as C-V prototypes individualistically. A suggested Active Contour Model (ACM) which is established on an advantage of a GAC in addition to C-V prototypes utilizes a Particle Swarm Optimization (PSO) as an additional constraint. At last, we get a precise as well as accurate segmentation results were possible with PSO which is combined with suggested clustering using level set formulation [4-7]. In level set method the main advantages were relatively has fine resolution that could be attained, the handling of corners as well as marginally tilted lines, it is accurate in addition it’s an easy calculation of surface normal. This paper had been systematized as below. Literature Review on Clustering Algorithms is about a review on K-means as well as Fuzzy C-means clustering algorithm. Particle Swarm Optimization would give the information about the Particle swarm optimization. Implementation of level set method using Optimized clustering Algorithms gives the detailed information on level set formulation; Experimental results and its discussion says about the experimental results which were given.
Literature Review on Clustering Algorithms
Cluster generally treated as a gathering of an object’s which were “similar” between them as well as “dissimilar” to an object’s belonging to the further clusters [7]. Clustering algorithms could be categorized as: (i) Exclusive-clustering; (ii) Overlapping-clustering; (iii) Hierarchical-clustering; (iv) Probabilistic-clustering. In principal case data [8] were assembled in exclusive path, so as to if a specific datum’ has the place with an un-mistakable cluster then it couldn't be incorporated into another cluster. Despite what might be expected the second category, an ‘overlapping clustering, utilizes the fuzzy sets to the cluster information, so every opinion might have a place with at least two clusters with a various degrees of member-ship. Here, in this case, information would be a related one to the appropriate membership esteem. Rather, a hierarchical clustering algorithm depends on a combination among a two nearest clusters. A starting condition’ was acknowledged by situating each datum as cluster. After few iterations it achieves a last cluster’s required. At long last, the last categories of a clustering utilize the totally probabilistic’ method; so here, in this we intend three of mostly used clustering algorithms were as below:
• K-means clustering.
• Fuzzy C-means (FCM) clustering.
K-means clustering
The K-means algorithm which was the simplest un-supervised learning algorithms that could solve the eminent clustering issues [4,6]. K-means remains the popular choice for its easiness, effectiveness as well as moderate but it had a stable presentation across different issues. On one hand, k-means [8,9] had been generally received in a various applications. Then again, nonstop endeavours had been committed in order to progress the execution k-means [7] also. Although it’s prominence, it really experiences a few inactive issues. In spite of the fact that the time complication were linear to the data size, conventional k-means is as yet not meritoriously effective to deal with a web-scale information .The strategy follows a basic as well as simple approach to characterize a given data set via a specific number of clusters (let consider ‘ k’ clusters) settled an earlier.
An initial thought is that to characterize the ‘k’ centroids, single one for each cluster. These the centroids ought to be set ingeniously in a thought of different area causes a distinctive outcome. So, the better decision is that to place them nevertheless much as could reasonably be estimated far from an each other. A subsequent stage has to take individual point having a place towards a given data set and subordinate it to a closest centroid. When there is no point pending, the initial stage is finished. Presently we have to re-ascertain 'k' new centroid’s as a bary focal points of the clusters occurring on an account of the past advance. Later we have these ‘k’ new centroid’s, another coupling had to be done in between comparable informational set point's as well as the nearest new centroid in this way, that a loop had been made. In light of this the loop we might see that the k-centroid’s varies their territory all around requested until the point when the moment that no more changes are done. As a yield of this loop we could see that k-centroid’s adjusts their area stage towards stage till the point when there is no more changes were finished. In additional words, centroid’s doesn't move no more. At last, this type of algorithm goes for limiting the objective function, for this type of situation the squared error function is as given below.
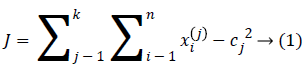
At which ||xi(j)-cj||2 indicates a distance measure in between the information point xi(j) along with a ‘cluster center’ cj, which is the pointer of a distance of an n information points from their corresponding cluster centers’. The algorithm was framed in following steps:
1. Locate ‘K’ point into a space located by an object’s which distinctly clustered were. And these points’ indicates the primary set of centroids.
2. Allocate every object to a set which consists of a closest’ centroid.
3. When the entire object’s had allocated, re-calculate the positions of ‘K’-centroids.
4. Repeat the 2 as well as 3 steps till centroids were no elongated to move. So, this harvests a partition of an object into sets where a metric had to be get minimized and to be get calculated.
In spite of fact that it could be demonstrated that a strategy will dependably end, k-means algorithm doesn’t really locate the maximum optimal configuration’, relating to a “global objective function minimum”. The algorithm was additionally altogether sensitive to a primary randomly select particular cluster centers’.
Fuzzy C-means clustering
This method is considered as a considerably high gainful on the grounds that this strategy separates a great deal of data from an original image unlike a hard-segmentation technique. In FCM clustering method [10-13] the pixel of an image were allocated to the fuzzy clusters rather than a label. FCM [14,15] enables pixel so as to have a place with various clusters through changing degrees of member-ship function, unlike a hard clustering strategy which mightily allocates the pixel to only single class. Lastly the clustered image having sensible image segmentation with fuzzy boundaries had existed to a physician in order to accurate the boundary region. The FCM Algorithm is the method of clustering at which it agrees a single point of a content belonging to a two or more cluster’s. This process had been technologically advanced by Dunn in the year 1973 as well as upgraded by the Bezdek in year 1981 which were often utilized in the pattern recognition. It was founded on a minimization’ of a following objective function which were given below:
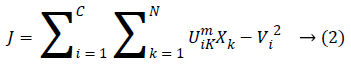
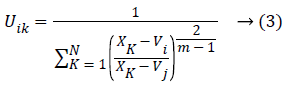
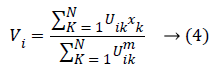
At which Uik specifies the member-ship of a pixel Xk to a ith cluster Xk ɛ Ω, Ω-indicates the set of a point’s that composed an image, N as well as C denotes the total count of a clusters in addition data point’s in Ω, Vi is the ith-cluster of a centroid, and ‘m’ is the degree of fuzzy-ness. FCM cost function was minimized through updating a cluster centroid iteratively. Depending on the distance from the center of s dissimilar cluster to a pixel, the fuzzy member-ship values were allocated. The degrees of a member-ship would be higher if the distance in between the pixels besides the cluster center is a smaller one and vice versa. To update the fuzzy member-ship function as well as the cluster center, respectively the following mathematical expression was utilized:
Besides, we saw that every one of the methods needs a prior user initialization’, at which it is a primary disadvantage of clustering methods. Both initialization and globally optimum of cluster center are produced by Particle Swarm Optimization (PSO) algorithm, which can successfully stay away from the drawback of sensitivity to initial esteems.
Particle swarm optimization
Kennedy et al. (1995) stayed enlivened to have a development [16-18] in look system of PSO by the scavenging conduct of groups of fowls as well as schools of fish. Each and every particle consists of its personal position and additionally velocity, at which a qualities speaks to the factors of choice in the present emphasis and additionally a development vector for the following cycle, separately. The velocity as well as the position of every particle as needs to be varieties to a data which is partaken in the middle of each particle in the present cycle; every particle can record the individual single and additionally revive through cycles or by following a process. The worldwide best commonality was characterized by looking at the individual best recognition of all particles. The pursuit procedure of PSO includes perceiving the new velocity keeping in mind an end goal to have figuring of a position which is another one at the following procedure as per the velocity which is unique of an each and every particle (vi), the individual best commonality of each and every particle (xp (i)) and the worldwide best nature of each particles (xg) which is appeared in Figure 1. PSO would get a surmised ideal arrangement by rehashing the grouping or process over number of development emphases.

Figure 1: Particle swarm optimization search strategy.
Figure 2 demonstrates the procedure to be looked by PSO. The Principal Step is to instate the particle swarm and furthermore in-corporate particles velocity and also position in the space looking. Afterward, as certain the wellness of the particle swarms so as to refresh the individual best recognition of each and every particle and in addition the worldwide best nature of each particle. The most vibrant preparing step is that to figure a novel velocity as well as the position of each particle in following procedure by using Equations 1 and 2.

Figure 2: PSO flow chart.

At which vid (t) represents the esteem of velocity of dth. Dimension of an ith particle in a tth iteration. A variable xid xid (t)-represents a location of the dth dimension if a ith particle in a tth iteration. A variable “w” indicates weight of inertia, c1 is the self-cognition acceleration co-efficient, and c2 is socialcognition acceleration co-efficient.
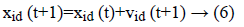
Equation (6) indicates a new position of each and every particle is refreshed utilizing the first position and the new velocity by an equation (5). At which r1 as well as r2 were produced independently. Range of uniform distributed random numbers are (0, 1). The below segment depicts fast about these two classes of estimations of parameter segment.
Implementation of Level Set Method Using Optimized Clustering Algorithms
Level set segmentation
Earlier in 1970’s Dervieux as well as Thomasset were projected some concepts in the level set method or formulation but their work haven’t paid much effective one. In 1987 to capture dynamic interfaces as well as shapes Osher et al. [19,20] introduced a method called level set method. The main Moto of level set formulation is to signify the contour as a zero level set of a higher dimensional function’ known as a ‘level set function’, and to formulate the motion of a contour as the evolution of a level set function. It’s an only after the work by Osher et al. [19], the level set method had become well known and had a great impact in various applications, like image processing, computational geometry, fluid dynamics, as well as computer vision.
Level set formulation as well as optimization: As the information determined vitality term and also relating penalty term is portrayed in above segment. So, the complete plan about a level set [3,21] in this process had been communicated as:
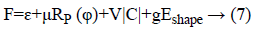
At which μ, v, g were the weighting co-efficient of relating regularized term. Supplanting ε, RP (φ), |C| as well as Eshape using conditions of Level Set Formulation [3] we can recompose the level-set function as below:
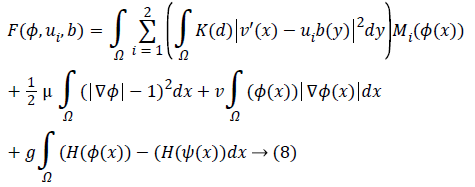
Keeping as a remembrance the end goal to disentangle an Articulation, we characterize:
Along these lines, the level set capacity can be communicated as below:
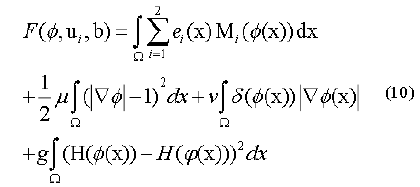
By limiting this capacity, we get a segmentation aftereffect of pro-state MR image which were indicated by a bend of the level set capacity φ. So, the minimization of this capacity could be achieved through an iterative procedure which is a limiting the capacity F as for its factor’s φ, ui as well as b flowingly. An arrangement as for every factor is appeared as takes after.
For φ, we must fix ui, b, as well as utilizes a stand gradient’ descent technique to resolve a gradient’ flow condition:
(∂φ/∂t)=-(∂F/∂φ) → (11)
As (∂φ/∂t) is the gateaux derivative of energy function ‘F’. Through calculating the gateaux equation, we do have:
(∂φ/∂t)=-δ (φ) (e1-e2)+vδ (φ) div (φ/|φ|)+μdiv (dp (|φ|)|φ|)+2gδ (φ) (H (φ)-H (φ)) →(12)
At which is the gradient operator, divergence operator is div (.) the as well as dp is the function which is declared as:
dp (s)=p’(s)/s → (13)
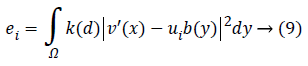
For a ui, through setting φ, b, the optimal ui would be gained by calculating the partial differential ∂F/∂ui.
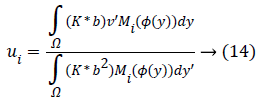
At which (*) indicates the convolution’s operation.
For b, via fixing φ, ui, the optimal b had been gained through solving a partial differential ∂F/∂b.
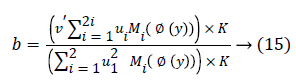
The streamlining of level set formulation could be communicated as an accompanying procedure:
First stage: Instate a level set formulation φ (x).
Second stage: Modernize φ (x) by using φn+1= φn+θ (∂φn/∂t), ө is step size as well as ∂φ/∂t is represented in condition (12). Modernize ui which is signified in condition (14). Modernize b signified in condition (15). Compelling the zero level set c transfer in a direction of the borderline of a pro-state organ.
Third stage: Crisscross a convergence’ of an energy function- ‘F’; the convergence criteria which were used in this methodology represented as |F(n)-F(n-1)| ≤ n, is set to 0.001.
In this way, we attain a model which is suitable for feature extraction from a panchromatic image. The speed development makes it much easier to test as well as evaluate a level set segmentation [22-24].
Experimental Results and its Discussion
Implementation of the suggested algorithm is performed on two unique biomedical images for segmentation of both T1 brain and Coronal of brain images. The proposed results are analyzed and compared with the DS and JS as shown in Figures 3 and 4. The proposed segmentation results are accurate and faster based on the following parameters i.e. segmentation accuracy (SA), iterations, and elapsed time of biomedical images.

Figure 3: In figure row (a) one shows the original MRI Brain T1 image with 3% noise and slice thickness is 1 mm and non-uniformity of pixels 20%; second row (b-d) depicts the corresponding the ground truth images of cerbro-spinal fluid-(CSF), White matter-(WM), as well as the gray matter-(GM) tissues respectively; third row (e, f, g) represents the optimized K-Means; fourth row (h-j) represents the optimized FCM segmented image and its level set evolution of three tissues.

Figure 4: In figure row (a) one shows the original Coronal of Brain image with 3% noise and slice thickness is 1mm and non-uniformity of pixels 20%, second row (b-d) depicts the corresponding the ground truth images of cerbro-spinal fluid (CSF), White matter (WM), as well as the gray matter (GM) tissues respectively; third row (e-g) represents the optimized K-means; fourth row (h-j) represents the optimized FCM segmented image and its level set evolution of three tissues.
The database was taken from the brain web simulated database [25]. In this paper we consider two different types of MRI brain image scans with three tissue classifications such as WM, GM and CSF. The simulation parameters that had chosen for both T1 brain and Coronal of brain images are: (i) Slicethickness of an image is 1 mm; (ii) Noise is 3% (calculated relative to the brightest tissue); (iii) Intensity non-uniformity is 20%. These images were rescaled to 256 × 256 for contour evolution of the both proposed as well as conventional methods for pre-processed images. The initial contours for the three images are taken as initial contour functions defined from 10 to (N-100)th pixels of N × N size input image. The final contour evolution to the desired output had taken 100 iterations for both the algorithms.
Figure 3 depicts the extraction of the segmented regions of T1 brain image (example) using conventional and proposed methods. In figure row (a) shows the original MRI Brain T1 image, second row (b-d) depicts the corresponding a ground truth images of cerbrospinal fluid (CSF), White Matter (WM), as well as gray matter (GM) tissues respectively, third row (eg) represents the optimized k-means clustering via level set formulation (LSF) and fourth row (h-j) represents the optimized FCM clustering via level set formulation (LSF) segmented image and its level set evolution of three tissues.
Figure 4 depicts the extraction of the segmented regions of Coronal of Brain Image (example) using conventional and proposed methods. So from figure row (a) one shows the original MRI Brain T1 image; second row (b-d) depicts the corresponding a ground truth images of cerbrospinal fluid (CSF), white matter (WM), and gray matter (GM) tissues respectively; third row (e-g) represents the k-means clustering via level set formulation (LSF); fourth row (h-j) represents the optimized FCM clustering via level set formulation (LSF) segmented image and its level set evolution of three tissues.
In Figures 3 and 4 clearly shows that the proposed optimized k-means clustering via level set formulation (LSF) is fails to detect and extract the regions of the three tissues compared to the ground truth image as shown in the Figure 3 second row. So this proposed method is not superior for an MRI Brain T1 as well as coronal brain images compared to other proposed optimized FCM clustering via LSF. The optimized FCM clustering via LSF is best suitable for detecting and extracting of a three tissues in terms of accurate segmentation of regions.
The performance parameters of our proposed model and conventional models are tabulated in Table 1. Quantitative evaluation performances of segmentation results of previous and proposed approaches are given in Table 1 respectively. So here we can say that optimized k-means clustering via level set formulation (LSF) in terms of DS and JS at which segmentation for the CSF, WM as well as GM tissues couldn’t detected satisfactorily. At the same time it takes more elapsed time and has less segmentation accuracy. So to improve the draw backs occurred in Table 1 of optimized k-means clustering via level set formulation (LSF) can be done by the proposed method optimized FCM clustering via level set formulation (LSF). A pixel based quantitative evaluation approach is used. In this evaluation approach made a comparison between the final segmented image ‘P’ and ground truth image ’Q’. The segmentation similarity coefficient (SSC) is measured with the help of Dice and Jaccard coefficients.
| Images | Tissue type | Optimized k-means via LSM | SA (%) | Elapsed time | Iterations | Optimized FCM clustering via LSM | SA (%) | Elapsed time | Iterations | ||
|---|---|---|---|---|---|---|---|---|---|---|---|
| DS | JS | DS | JS | ||||||||
| MRI brain T1 | CSF | 0.7123 | 0.5356 | 71.23 | 4.6911 | 100 | 0.9234 | 0.7456 | 92.34 | 4.0941 | 100 |
| WM | 0.6678 | 0.5237 | 66.78 | 3.6281 | 100 | 0.9705 | 0.7029 | 97.05 | 3.0763 | 100 | |
| GM | 0.79 | 0.5819 | 79 | 3.6152 | 100 | 0.9643 | 0.6268 | 96.43 | 3.5105 | 100 | |
| Coronal of brain | CSF | 0.5146 | 0.4309 | 51.46 | 3.5756 | 100 | 0.8618 | 0.4309 | 86.18 | 3.4292 | 100 |
| WM | 0.5806 | 0.4577 | 58.06 | 3.6156 | 100 | 0.9154 | 0.4503 | 91.54 | 3.1348 | 100 | |
| GM | 0.7721 | 0.4452 | 77.21 | 3.6222 | 100 | 0.8901 | 0.3861 | 89.01 | 2.4045 | 100 | |
Table 1. Performance analysis of well-known existing models and proposed level set model in terms of Dice Similarity (DS) index and Jaccard Similarity (JS) index measures.
For the higher values of the dice and Jaccard coefficients gives the better performance. The dice and Jaccard index had been defined as:
Dice=(2|P ∩ Q|)/|P|+|Q| → (16)
Jaccard=(P ∩ Q)/(P ∪ Q) → (17)
In Table 1, the proposed model is faster, accurate and superior for detection of tumors and tissues in biomedical images based on a dice along with jaccard similarity coefficients. And it also gives good segmentation accuracy at the same time it takes less elapsed time when compared with the existing method. In Table 2 it shows the average values of DS and JS for both optimized k-means and FCM algorithms using level set method. Based on this analysis optimized k-means algorithm is not superior for segmenting the three tissue classifications as mentioned in Figures 3 and 4 respectively. Similarly in optimized FCM algorithm using level set method we get the superior segmentation results for the three tissues over optimized k-means segmentation (Figures 3 and 4 for comparison). All the experimentation is done on MATLAB R2017b 64b in Windows 10 OS with Intel (R) dual Core (TM) 32 bit processor, CPU@1.80 GHz, 2 GB RAM. The elapsed time is recorded for all the algorithms are tabulated in Table 1.
| Images | Tissue type | Optimized k-means via LSM | Average of DS and JS | Optimized FCM clustering via LSM | SA (%) | Average of DS and JS | ||
|---|---|---|---|---|---|---|---|---|
| DS | JS | DS | JS | |||||
| MRI brain T1 | CSF | 0.7123 | 0.5356 | 0.62395 | 0.9234 | 0.7456 | 92.34 | 0.8345 |
| WM | 0.6678 | 0.5237 | 0.59575 | 0.9705 | 0.7029 | 97.05 | 0.84975 | |
| GM | 0.79 | 0.5819 | 0.68595 | 0.9643 | 0.6268 | 96.43 | 0.79555 | |
| Coronal of brain | CSF | 0.5146 | 0.4309 | 0.4768 | 0.8618 | 0.4309 | 86.18 | 0.64635 |
| WM | 0.5806 | 0.4577 | 0.51915 | 0.9154 | 0.4503 | 91.54 | 0.68285 | |
| GM | 0.7721 | 0.4452 | 0.60865 | 0.8901 | 0.3861 | 89.01 | 0.6381 | |
Table 2. Average value of Dice Similarity (DS) and Jaccard Similarity index (JS).
From Figures 5 and 6 represents that segmentation result of kmeans and FCM via level set method without PSO algorithm. These methods are fails to detect the accurate segmentation of MRI Brain T1 scan images when compared with PSO Algorithm as mentioned in above clustering algorithms via LSM. So, in this regard PSO algorithm is capable for improving the clustering efficiency in pre-processing an image. Even after applying PSO algorithm few obstacles were present in the pre-processing results just like boundary leakages and outliers. In order to overcome these issues we were including LSM in post-processing. So, by going through all the above mentioned considerations we can say that optimized FCM algorithm via level set method is a superior one and best suitable for segmenting MRI brain images.

Figure 5: Segmentation results of three tissues using FCM clustering via level set method without PSO; First row shows that White Matter and its segmented regions using K-means via LSM; similarly, second row and third row depicts the gray matter and CSF and its segmented regions using K-Means via LSM with 100 iterations.

Figure 6: Segmentation results of three tissues using K-means clustering via level set method without PSO; First row shows that white matter and its segmented regions using K-means via LSM; similarly, second row and third row depicts the gray matter and CSF and its segmented regions using K-means via LSM with 200 iterations.
Conclusion
A review on segmentation of biomedical images using optimized k-means and FCM clustering via level set formulation is presented in this paper for efficient segmentation of T brain image and coronal brain image. This is used to reduce the noise effect throughout the segmentation. In our proposed algorithm’ PSO with k-means and FCM are performed in the primary step for improving the clustering efficiency. Later, in secondary step, for achieving the robust image segmentation using level set method. The segmentation accuracy is measured based on two similarity metrics Dice similarity and Jaccard similarity. To demonstrate the superiority of our proposed method it can show better results than the other methods.
References
- Yu-Hsiang W. Tutorial: image segmentation, Graduate Institute of Communication Engineering. National Taiwan University, Taipei, Taiwan, ROC 2011.
- Khan MW. A survey: image segmentation techniques. Int J Fut Comp 2014; 3: 89-93.
- Ji L, Yan H. An attractable snakes based on the greedy algorithm for contour extraction. Patt Recogn 2002; 35: 791-806.
- Emre Celebi M, Hassan AK, Patricio AV. A comparative study of efficient initialization method for K-means clustering algorithm. Exp Sys Appl 2013; 40: 200-210.
- Caroline P, Martial H. A comparison of image segmentation algorithm. Robotics Institute, Carnegie Mellon University, Pittsburgh, Pennsylvania 2005.
- Andrew M. K-means and Hierarchical Clustering 2001.
- Nameirakpam D, Yabem JC, Kuma MS. Image segmentation using K-means clustering algorithm and subtractive clustering algorithm. Proc Comp Sci 2015; 54; 764-771.
- Brian TL. K-means clustering 2008.
- Tariq Rashid: Clustering 2009.
- Dunn JC. A Fuzzy relative of the ISODATA process and its use in detecting compact well-separated clusters. J Cybern 1973; 3: 32-57.
- Bedeck JC. Pattern recognition with fuzzy objective function algorithms. Plenum Press New York 1981.
- Tariq R. Clustering 2010.
- Xiong Y, Shu Z, Dongdong X, Hong Z, Toru K. Hierarchical prostate MRI segmentation via level set clustering with shape prior. Neuro Comp 2017; 257: 154-163.
- Juraj H. Image Segmentation using Fuzzy C-means SAMI 2006.
- Bezdek JC, Ehrlich R, Full W. FCM: the fuzzy c-means clustering algorithm. Comp Geosci 1984; 191-203.
- Liu KCR, Yang MS, Liu HC, Lirng JF, Wang PN. Generalized Kohonens competitive learning algorithm for ophthalmological MR image segmentation. Magn Reson Imag 2003l 21: 863-870.
- Hou Z, Qian W, Huang S, Hu Q, Nowinski WL. Regularized fuzzy c-means method for brain tissue clustering. Pattern Recogn Lett 2007; 28: 1788-1794.
- Li C, Huang R, Ding Z, Gatenby JC, Metaxas DN, Gore JC. A level set method for image segmentation in the presence of intensity inhomogeneities with application to MRI. IEEE Trans Image Process 2011; 20: 2007-2016.
- Osher SJ, Fedkiw RP. Level set methods and dynamic implicit surfaces. Springer-Verlag 2002.
- Ramudu K, Srinivas A, Rangababu T. Segmentation of satellite and medical imagery using homomorphic filtering based level set model. Indian J Sci Technol 2016; 9.
- Osher S, Sethian JA. Fronts propagating with curvature-dependent speed: algorithms based on Hamilton-Jacobiformulations (PDF). J Comput Phys 1988; 79: 1249.
- Li C, Huang R, Ding Z, Gatenby JC, Metaxas DN, Gore JC. A level set method for image segmentation in the presence of intensity inhomogeneities with application to MRI. IEEE Trans Image Process 2011; 20: 2007-2016.
- Wang L, Macione J, Sun Q, Xia D, Li C. Level set segmentation based on local Gaussian distribution fitting. Asian Conference Comp Vis 2009; 293-302.
- Wang XF, Min H. A level set based segmentation method for images with intensity in homogeneity. LNAI 2009; 670-679.
- http: //www.ctisus.com/responsive/teachingfiles http: //brainweb.bic.mni.mcgill.ca/.