ISSN: 0970-938X (Print) | 0976-1683 (Electronic)
Biomedical Research
An International Journal of Medical Sciences
Research Article - Biomedical Research (2018) Computational Life Sciences and Smarter Technological Advancement: Edition: II
A recursive support vector machine (RSVM) algorithm to detect and classify diabetic retinopathy in fundus retina images
1Department of Computer Science and Engineering, Saveetha School of Engineering, Saveetha University, Chennai, Tamil Nadu, India
2Department of Computer Science and Engineering, Sri Venkateswara College of Engineering, Chennai, Tamil Nadu, India
- *Corresponding Author:
- K Malathi
Department of Computer Science and Engineering
Saveetha School of Engineering
Saveetha Universitym India
Accepted on February 01, 2017
DOI: 10.4066/biomedicalresearch.29-16-2328
Visit for more related articles at Biomedical ResearchDiabetic retinopathy is a type of eye disease characterized by retinal damage brought on by diabetes, and is the leading cause of blindness in people aged between 20 to 64 years. Image processing techniques are used to detect and classify retinopathy images effectively. This paper is based on a proposed segmentation algorithm titled “Shrinking Edge-Mark,” which displays two classes of labelled regions, including veins and other regions in the retinal image. From the extracted veins, parameters such as the width and length of each vein are calculated, along with the cotton wool region size and contour of the image. In all, these four parameters are used to detect the stages of diabetic retinopathy. The width and length are calculated from the segmented area by using a basic formula. The area of the cotton wool region is obtained by subtracting the value of the area of the vein region. Finally, a Recursive Support Vector Machine (RSVM) is used to classify the images and accurate detection is successfully determined, notwithstanding the normal or abnormal condition of the retina. MATLAB, a high-performance language for technical computing, is used to implement the concept.
Keywords
Diabetic retinopathy, Image processing, Shrinking edge-mark, Support vector machines.
Introduction
Diabetic retinopathy is a common diabetic eye disease and one of the primary reasons for blindness in adults. Each year diabetic retinopathy accounts for 12% of all new cases of blindness. It is caused by changes in the retina’s blood vessels, which may bulge and leak fluid in some people with diabetic retinopathy. New blood vessels grow, abnormally, on the surface of the retina. The retina is the light-sensitive tissue at the back of the eye. For normal vision, the retina ought to be essentially healthy. Diabetic retinopathy usually affects both eyes. Unluckily, people who have diabetic retinopathy seldom notice changes in their vision in the initial stages of the disease. As it progresses, however, diabetic retinopathy generally causes loss of vision and cannot, in many cases, be reversed. It is an ocular symptom of diabetes, a universal disease, affecting a majority of patients who have had diabetes for 10 years or more. In spite of these threatening statistics, researchers point out that nearly 90% of all new cases could be reduced if there were proper and attentive treatment, and a cautious, sustained watching of the eyes. The longer a person has diabetes, the higher the possibility of his/her developing diabetic retinopathy.
The global diabetic retinopathy market is expected to touch USD 10.11 billion by 2022, according to a new study by Grand View Research Inc. Diabetic retinopathy is considered a serious sight-threatening complication, a result of long-term diabetes. The selection of treatment for diabetic retinopathy varies on the condition of its severity and might include intraocular injections, anti-VEGF drugs, laser surgery or vitrectomy. The increasing frequency of diabetes, the rising elderly population base, and the growing demand for early detection are certain high-impact drivers of the market for diabetic retinopathy. The advance of retinopathy can be controlled before it causes loss of vision. Certain factors leading to the development of the disease are:
The duration of diabetes: Someone who has had diabetes for a long time is more likely to be affected by diabetic retinopathy, which invariably worsens over a period of time. Blood sugar levels: Where blood sugar levels are poor, the possibility of diabetic retinopathy development is high. As soon as retinopathy begins, firm control of sugar levels can curb the progress of vision loss. Controlling other risk factors, checking cholesterol and blood pressure levels are also vital in delaying the progress of diabetic retinopathy. Modifying behaviour by choosing a healthier, alternative lifestyle-such as healthy eating, weight control, regular exercise and not smoking – helps in controlling these risks.
Fundus imaging plays a major role in detecting and monitoring diabetic retinopathy as the fundus is susceptible to vascular diseases, and fundus imaging can therefore be considered a contender for non-invasive screening. The success of such a screening approach depends on the accurate capturing of fundus images and, particularly, on precise and strong image processing and investigative algorithms for the detection of defects. Several algorithms have been recommended for the analysis of fundus images using assorted methods and approaches.
The fundamental idea behind an image pre-processing technique is to satisfy image disparity by normalizing the actual retinal image against a reference model. Difference naturally occurs in the same image (intra-image difference) and also between images (inter-image variation) and it is consequently essential to compensate for this inconsistency to facilitate effective image analysis. Intra-image changes arise as a result of variations in light distribution, the presence of defects, variations in fundus reflectivity and the thickness of the fundus. Inter-image inconsistency is caused by factors including differences in cameras, lighting, angles and the pigmentation of the retina. The rest of the paper is designed as follows: Section 2 details a literature survey. Section 3 focuses on the proposed work, while Section 4 discusses the results and their implementation. The final section, 5, concludes the paper.
Literature Survey
A mechanism to detect red lesions associated with DR (Diabetic Retinopathy) from retinal fundus images is suggested. The input image is decomposed into lesser subimages and filters applied to it. A support vector machine classifier, trained by the characteristics taken from the filter response, checks if the image has lesions. Experiments were conducted on a dataset of 143 retinal fundus, and the mechanism achieved areas under the ROC curve equal to 0.97 and 0.87 for microaneurysms and hemorrhages correspondingly. The method has proved to be effective and helps considerably in the automatic detection of DR with fewer false positives [1]. A method usinga 2-D Gabor wavelet for vessel enhancement, and a novel multilayered threshold technique for precisely segmenting vessels, is discussed. The aim is to enhance and segment blood vessels in retinal images. It executes well for huge variations in illumination and, further, captures the thinnest vessels. The suggested technique is experimented with on publicly available retinal images. This system has achieved a standard accuracy rate of 94.85% and has proved more successful [2] than more recently available ones.
The system, algorithms and mechanisms used for detecting hemorrhages from diabetic retinopathy retinal images are reviewed. DR is a condition in which the retina is affected by fluid leaks from blood vessels. Hemorrhages present in the retina are an early symptom of diabetic retinopathy, with their number and shape indicating the severity of the disease. Early detection through automation can aid in a decrease in the occurrence of blindness [3]. Algorithms used in extracting features from digital fundus images are analyzed here. Also, methods using these characteristics for the classification of individual fundus images are discussed. A majority of the reported mechanisms are highly optimized in relation to the fundus images examined, as a result of which it is hard to generalize individual results. However, the analysis shows that there is an improvement in classification results, and it comes within striking distance of the classification standards set by the best ophthalmologists at work in the field. [4]. an ensemble-based framework for improving the detection of microaneurysms is discussed, an issue yet to be addressed in medical image processing. Here, a composite of the internal parts of microaneurysm detectors (like preprocessing methods) and candidate extractors is suggested. The approach is analyzed for detecting microaneurysms in an online contest, where the algorithm is first ranked. As microaneurysm detection is vital ingrading diabetic retinopathy, the suggested method is tested for this assignment on thepublicly available Messidor database. A promising AUC 0.90 with 0.01 uncertainty is realized in a ‘DR/non-DR’-type categorization based on the existence of the microaneurysms [5].
Image recognition for the screening of diabetic retinopathy is investigated. An algorithm is introduced to take a decision based on a combination of results by meta-classification. The output of numerous lesion detectors is the input of the metaclassifier, thereby generating a powerful high-level feature illustration for retinal images. Various options are explored for the bag-of-visual words (BoVW)-based lesion detectors. An area under the curve of 93.4% using the SOFT–MAX BoVW (soft-assignment coding/max pooling) is achieved by the final classification approach, bypassing the need for normalizing the high-level feature vector of scores [6]. The latest developments in research towards apprehending the complications involved in retinal neuro-degeneration and functional vision loss in DR are revealed. Widespread research has concluded that DR is a vascular disease that also possesses a neuro-degenerative component. Consequently, all kinds of cells in the retina are affected, leading to loss of vision. A lot of work using animal models of DR has found loss of neurons and pathology of all cell varieties. Emphasis is also placed on measuring the retinal function in the said models [7].
A novel algorithm for detecting exudates, the existence of which inside the macular region is a key feature of diabetic macular edema, is recommended and the algorithm permits their detection with a high degree of sensitivity. Therefore, detecting exudates is a major diagnostic task. The detection of the optic disc through morphological filtering techniques and watershed transformation is crucial for this approach. The results show that a mean sensitivity of 92.8% and a mean predictive value of 92.4% are achieved. Robustness is also examined with regard to the parameter changes of the algorithm [8]. A set of morphological operators, adjusted optimally and used for the detection of exudates on diabetic retinopathy patients’ non-dilated pupils, and low-contrast images is discussed. Diabetic retinopathy is a condition brought on by the onset of diabetes and changes in the retina’s blood vessels occur as a result. The morphological operators detect exudates automatically and are authenticated by evaluating them with expert ophthalmologists’ hand-drawn ground truths. The result was a success and the degree of sensitiveness and specificness for detecting exudates is 80% and 99.5% correspondingly [9].
A noninvasive mechanism to identify DM and nonproliferative diabetic retinopathy (NPDR), an early stage of DR, based on three groups of attributes taken from tongue images is analyzed. Firstly, tongue images are captured by means of a noninvasive capture device incorporating image correction. The surface values of eight blocks are used to differentiate among nine tongue texture features. Lastly, 13 features are extracted from the tongue images based on measurements, distances, areas, and their ratios, symbolizing geometric elements. The suggested method can separate healthy/DM tongues and also NPDR/DM-minus NPDR tongues with an average accuracy rate of 80.52% and 80.33%, correspondingly [10]. A fundus image analysis-based, computer-aided system for classifying and grading cataracts is presented. The system comprises fundus image pre-processing, image feature extraction, automated cataract categorization and grading. Wavelet transform and sketch-based methods are examined to take, from the fundus image, characteristics suitable for cataract classification and grading. Research shows that fundus image examination for cataract categorization and grading is extremely useful for improving the efficiency of a fundus image review and the quality of ophthalmic health care.
10 moderate non-proliferative diabetic retinopathy (NPDR) patients and 10 severe NPDR ones, retrospectively, as a group are selected for analysis. Mathematical morphological methods are used for segmenting lesions automatically. The images are pre-processed with an adaptive histogram equalization to improve contrast for exudate detection, and pre-processed by top-hat and bottom-hat transformations for detecting microaneurysms. The results show that the morphological features of a lesion could be an image marker for NPDR. Grading and quantifying computer-aided retinal lesions might be a sensible way for clinicians to investigate diabetic retinopathy [11]. An automated method is described for locating the optic nerve in images of the ocular fundus and it uses a novel algorithm known as fuzzy convergence for determining the origin of the blood vessel network. The method is evaluated using 31 healthy retina images and 50 diseased ones, and a precise detectionrate of 89% is achieved. This method is also compared against three simple methods, indicating enhanced performance. Other researchers can use these images and data, freely available for the purpose of evaluation [12].
A common framework of an adaptive local threshold, based on a verification-based multi-threshold probing method, is proposed. The application-dependent verification process is devised to fully utilize all related information about the objects of interest. This approach, considered a knowledge-guided adaptive threshold, is dissimilar to most algorithms known from the literature surveyed. The results from the experiment demonstrate a performance that is superior to the global threshold, as well as a vessel-detection method, reported in the literature in recent times [13]. Notable progress was made in the past 15 years in ophthalmology, especially in developing automated diabetic retinopathy diagnostic systems, age-related macular degeneration and retinopathy prior to maturity. The quantitative dimensions of retinal vascular topography, using a digital image study of retinal photography, are used as research tools. This review also outlines the principles based on retinal digital image analysis, and the latest techniques used for automatic detection of landmark features of the fundus are also discussed. The possible utilization of fundal image study in telemedicine, going forward, is also reviewed [14].
The focal point of this study is medical imaging, especially retinal images, and a new algorithm for detecting blood vessels efficiently is discussed. The region of interest (ROI) method, and the extraction of the vein using Kirsch's template technique are used for segmenting the fundus image of the retina. A simulated neural network-based firefly clustering algorithm is used for disease classification. The mechanism has achieved enough results to support the four stages of diabetic retinopathy diagnosis. A high-performance language for technical computing, MATLAB, is used for the implementation of the concept [15]. A method to detect, automatically, the position of the OD in digital retinal fundus images is examined. Two kinds of filters, the Gaussian-based bilateral filter and the Haar filter, are considered. The former reduces/ eliminates noise in fundus images and the latter detects diabetic retinopathy in them. The optimum method for image segmentation is thresholding-based linked component pixels. An efficient image-filtering mechanism, known as the OpenCV 2.4.9.0 and cvblobslib, is used for implementation to achieve a successful outcome [16].
Proposed Work
This module extracts a non-vein region, the cotton space, by means of a specially designed c function. Initially, in the extracted area, the mark is equal to the size of the retina and then shrunk according to the pixel contour. This algorithm deals mainly with the pixel contour. Finally, the cotton spot is extracted from the image.
Procedure for the shrinking edge-mark algorithm
Extract the contour from the image. (contour is Also known as border following or boundary following; contour tracing is a technique that is applied to digital images in order to extract their boundary. )
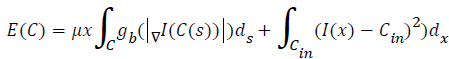
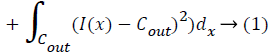
cin,cout – Mean intensities
C is the curve.
I is the image.
Distinguish the edge and intermediate region using threshold values.
Extract the region from the image.
Energy minimizing function:
Label the extracted region using the energy minimized function.
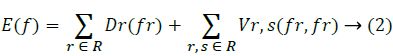
Find the weights of edges connecting neighbouring pixel nodes.
r- Set of pixels
L – Set of labels
Fr,fs– Labels
r,sSet of pixels
Dr– Energy minimizing measure to pixel r.
Do this for all edges.
Take the average of weightages.
Set the average value as the threshold.
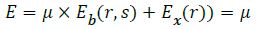
μ - the energy regularising parameter. (Threshold value)
rs is the angular difference between the pixels.
Xr – pixels in the destination area or extracted region. β>0
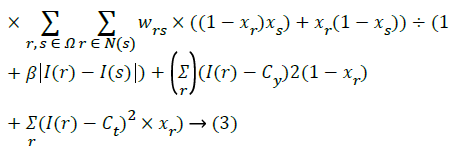
 (4)
(4)
Optimizing the extracted edges
The energy is modified in equation (3). To edge sharpening for each segment.
E=Eb(r,s) × E’r(r,s) → (5)
Find the energy difference between the pixels.
E’= Σ min((I(r)-Cy)2+(I(s)-Ct)2),((I(r)-Ct)2+(I(r)-Cy)2) → (6)
Segment the low energy level region from the image.
φy(r)=(I(r)-cy)2,φt(r)=(I(r)-Ct)2), Δφ(p)=(|φy(r)-φt(p)|) ÷ 2 → (7)
Segment the region using this threshold value.
For global segmentation:
φy(r)>φt(r)+Δφ(p)
Steps for the shrinking edge-mark algorithm
Step 1. Extract the contour from the given image.
Step 2. Distinguish the edge and intermediate region using threshold values.
Step 3. Extract the region from the image.
Step 4. Label the extracted region using the energy minimized function.
Step 5. Find the weights of edges connecting neighbouring pixel nodes.
Step 6. Do this for all edges
Step 7. Take the average of weight ages
Step 8. Set the average value as the threshold.
Step 9. Segment the region using this threshold value.
Flow for segmentation of fundus images
1. Start the initial segment(S) in the image (I) for segmentation.
2. Assign the binary value t=0 and t=1.
3. Using this binary value, split S0, S1.
4. S0 indicates outside the segment and S1 inside it.
5. Now consider I is I0, I1 belongs to I.
6. I0 undergoes segmentation and I1 has not started segmentation as yet.
7. Update the binary variable for the next segment.
8. Smoothen the segmented region using a suitable filter.
9. Continue steps 2 to 6 for all segments.
Classification for fundus images recursive support vector machines (RSVM) algorithm with featurebased optimization
Recursive support vector machines (RSVM) algorithm with feature-based optimization: SET of points in the SVarray
INPUT: Input datamatrix, label information
OUTPUT: Set of support vectors
INITIALIZATION: Error threshold =Huge value
Begin:
Randomly sample 2 points belonging to different classes. Add the m to the current set of support vectors.
Set the corresponding dual variables-“α”values
FUNCTION SVMRECUR ()
{
LOOP Forever
LOOP to Randomly sample 40 points.
Choose the set of 40 points with which current SVs give 40 pt test error less than the current error threshold.
BREAKIF Points are insufficient.
ENDLOOP Random sampling of 40 points
BREAKIF the Inner LOOP is at QUIT because of insufficient points.
Update error threshold as the average of 40 pt test errors.
LOOP Over misclassified points.
Add the point to current SVs.
Train using IMSMO with a warm start and test over the remaining points.
ENDLOOP over misclassified points.
ADD the misclassified point that gave the min-most error to the SVarray over the remaining points.
Save dual variable “α” s for the next iteration end loop FOREVER.
SVMRECUR (); // recursive call
END.
Note: The algorithm above is optimized using a number of points. If the points are high, the optimization steps are more. Figure 1 shows the classification steps involved in fundus images. Before entering the classification algorithm, 2 parameters are removed from the 4 derived. We use those two as input parameters. The recursive SVM algorithm is designed as a recursive function, helping multi-image classification. During testing time, more than one image can be provided. The recursive SVM function is called recursively and provides output for all images. On the first call, the image is classified as affected or not affected. A further call furnishes the grade of the disease for affected images, input parameters being cotton wool spots and extracted vein pixels. Using these two parts, we can create models (database) for trained images and establish a clear classification of the testing time. The output is simply tagged to read “affected with (the grade of the disease)” or “not affected.”

Figure 1: Classification of fundus images: Steps.
Results and Implementation
Implementation
Input images are collected from local hospitals, pre-processed by standard methods, and segmentation undertaken using our proposed algorithm. We get the extracted cotton wool spot region from the image, from which we can also extract exudates, veins and the suspected region of the disease. All steps are followed in serial order. Consequently, some images do not support the exudates and suspected region of extraction. The steps involved in classification use only two parameters: cotton wool spot extraction and vein extraction. Only 75 images - tagged Stage 1, Stage 2, Stage 3 and Stage 4 - and two parameters are considered. These grades use the listener value given by the eye specialist. Stage 1 indicates that the retina has not been directly attacked. Others mark progressive stages of the disease. Table 1 shows the ranges of the grades. To classify the Grades for images as per the value of Cotton wool region and vein thickness (as per user test). This above table is user defined as per her classification we give the value to the table.
| Types of DR | Grade1 | Grade2 | Grade3 | Grade4 |
|---|---|---|---|---|
| Cotton wool region | 0.90-0.91 | 0.91-0.92 | 0.92-0.93 | Above 0.94 |
| Vein thickness | 0.012-0.04 | 0.03-0.05 | 0.02-0.08 | 0.45-0.08 |
Table 1. Grade ranges.
Figure 2 describes cotton wool spot extraction. The given fundus image is segmented from the cotton wool spot extraction and the Figure 3 shows exudates extracted calculated from the thickness of the boundary of a cotton wool spot of the given image: the grade range is 0.9050, and the grade is Grade1.

Figure 2: Cotton wool spot extraction.

Figure 3: Extraction ofexudates.
In Tables 2 and 3, we depict a comparative study of our proposed algorithm with miscellaneous algorithm results taken from a variety of papers. In terms of accuracy, our algorithm is more reliable than the others. The following charts (Figures 4 and 5) show the table values in a pictorial format, with the xaxis denoting names and the y-axis, values.
| Model | tp | tn | fp | fn |
| Shrinking | 200 | 48 | 1 | 1 |
Table 2. Shrinking model tp, tn, fp and fn value.
| Models | Sensitivity | Specificity | Accuracy |
|---|---|---|---|
| Probabilistic Neural network (PNN) | 91 | 87 | 89.6 |
| Support Vector Machine SVM | 97 | 95 | 97.7 |
| Color Histogram (Thresholding) | 99 | 98 | 98.9 |
| Shrinking Edge-Mark (Proposed) | 99.5 | 97.5 | 99.2 |
Table 3. Various models with statistical measures.

Figure 4: Statistical measures with models.

Figure 5: Comparison against various models with statistical values.
Sensitivity = TP/TP+FN
Specificity= TN/TN+FP
Accuracy = (TN+TP)/ (TN+TP+FN+FP)
Table 2 drawn as per the reference on “Comparative Study of segmentation techniques in Diabetic Retinopathy Detection”
Table 4 indicates the region of extraction collected from various papers which use exudates and vein extraction in segmentation. Finally, we remove the exudates from the classification. The table data also indicate the removal is accurate.
| Models | True Positive | True Negative | False Positive | False Negative |
|---|---|---|---|---|
| Probabilistic Neural network (PNN) | 181 | 45 | 7 | 21 |
| Support Vector Machine SVM | 197 | 49 | 2 | 4 |
| Color Histogram (Thresholding) | 199 | 48 | 1 | 2 |
| Shrinking Edge-Mark (Proposed) | 200 | 48 | 1 | 1 |
Table 4. Various segmentations with statistical values.
Table 5 and Figure 6 show the segmented region in the x-axis and the percentage of accuracy in the y-axis. Of the four segmentations, only 2 are used. In the two, exudates are removed at the classification stage because the sensitivity is very low, when compared to that of veins.
| Types of DR | Grade1 | Grade2 | Grade3 | Grade4 |
|---|---|---|---|---|
| Cotton wool region | 0.90-0.91 | 0.91-0.92 | 0.92-0.93 | Above 0.94 |
| Vein thickness | 0.012-0.04 | 0.03-0.05 | 0.02-0.08 | 0.45-0.08 |
Table 5. Features with ranges: Fundus images.

Figure 6: Various segmentations with statistical values.
Table 5 and Figure 7 explain the ranges of normal retinas and affected ones, classified using six sub-parameters comprising the radius, diameter, area, arc-length, centre angle and half area. These, extracted from the vein and cotton wool spot extraction steps, are called sub-parameters and classify images, based on the progression of the disease, as normal, initial stage and final stage.

Figure 7: Features with ranges: Fundus images.
In Table 6 and Figure 8, the firefly algorithm is compared with our proposed algorithm as the basis of segmentation. A minimum and maximum number of segments are considered in both algorithms. Our proposed algorithm shows the maximum number of segments, indicating that minute segmentation will be done in the proposed algorithm. The x–axis denotes the names of the algorithm and the y-axis denotes the number of segments.
| Name of Algorithms | Number of Segment Minimum |
Number of Segment Maximum |
|---|---|---|
| Firefly Algorithm | 19 | 100 |
| Shrinking Edge-Mark (Proposed) | 25 | 250 |
Table 6. A comparison of the firefly with the shrinking edge-mark algorithm.

Figure 8: A comparison of the firefly with the shrinking edge-mark algorithm.
In Table 7 and Figure 9, we compare the firefly algorithm with our proposed algorithm as the basis of segmentation. The percentage of cotton wool spots and vein regions are obtained from the listener test. Our proposed algorithm gives better results than the firefly algorithm and is best suited for images of this type, collected from hospitals. The x-axis is the number of algorithms and the y –axis the percentage of the system test with the listener test.
| Name of Algorithm | Percentage of Covered Vein Region as Per Listener Test |
Percentage of Covered Cotton Wool Spot Region as Per Listener Test |
|---|---|---|
| Firefly Algorithm | 80 | 73 |
| Shrinking Edge-Mark (Proposed) | 92 | 82 |
Table 7. A comparison of the firefly with the shrinking edge-mark algorithm on the basis of segmentation.

Figure 9: A comparison of the firefly with the shrinking edge-mark algorithm on the basis of segmentation.
Conclusion
Digital imaging techniques are used everywhere now. Based on the concept of image processing, the shape of image particles can be analysed in detail. In eye clinics today, the imaging of the eye fundus with modern technology is in great demand because of its value and expected life span. Eye fundus imaging is considered a non-invasive and painless route to screen for, and observe, the micro-vascular differentiation between diabetes and diabetic retinopathy. Parameters like the cotton wool spot area and the diameter of the vein are used for grouping the areas affected. The system has achieved results adequate enough to support the four stages of a diabetic retinopathy diagnosis. This study is based on a proposed segmentation algorithm termed the “Shrinking Edge-Mark.” The algorithm gives two classes of labelled regions, which could include the vein and another region in the retina image. From the extracted vein, parameters such as the width and length can be calculated. Furthermore, the cotton wool region size and the contour of the image are also calculated. In all, four parameters are used to detect the progressive stages of diabetic retinopathy. The width and length are calculated using a basic formula and, by subtracting the value of the area of the vein region, the area of the cotton wool region is obtained. Finally, a recursive support vector machine (RSVM) is used to classify the said images. Accurate detection is successfully determined, notwithstanding the normal or abnormal condition of the retina. MATLAB, a high-performance language for technical computing, is used to execute the concept. In future works focuses, in this paper classification has done Recursive SVM but in future will use successive SVM because Recursive SVM always have high cost if will use successive in the execution time will be low.
References
- Srivastava R. Red lesion detection in retinal fundus images using Frangi-based filters. Eng Med Biol Soc (EMBC). 37th Annual International Conference of the IEEE. IEEE, 2015.
- Usman AM, Khan SA. Multilayered thresholding-based blood vessel segmentation for screening of diabetic retinopathy. Eng Comput 2013; 29: 165-173.
- Jitpakdee P, Aimmanee P, Uyyanonvara B. A survey on hemorrhage detection in diabetic retinopathy retinal images. Elect Eng Electron Comput Telecommun Informa Technol (ECTI-CON) 2012.
- Oliver F. Algorithms for the automated detection of diabetic retinopathy using digital fundus images: a review. J Med Syst 2012; 36: 145-157.
- Antal B, Hajdu A. An ensemble-based system for microaneurysm detection and diabetic retinopathy grading. IEEE Transact Biomed Eng 2012; 59: 1720-1726.
- Ramon P. Assessing the need for referral in automatic diabetic retinopathy detection. IEEE Transact Biomed Eng 2013; 60: 3391-3398.
- Barber AJ. Diabetic retinopathy: recent advances towards understanding neurodegeneration and vision loss. Sci China Life Sci 2015; 2015: 1-9.
- Thomas W. A contribution of image processing to the diagnosis of diabetic retinopathy-detection of exudates in color fundus images of the human retina. IEEE Transact Med Imag 2002; 21: 1236-1243.
- Akara S. Automatic detection of diabetic retinopathy exudates from non-dilated retinal images using mathematical morphology methods. Comput Med Imag Graphics 2008; 32: 720-727.
- Boming Z, Kumar BVK, Zhang D. Detecting diabetes mellitus and nonproliferative diabetic retinopathy using tongue color, texture, and geometry features. IEEE Transact Biomed Eng 2014; 61: 491-501.
- Wu H. Computer aided quantification for retinal lesions in patients with moderate and severe non-proliferative diabetic retinopathy: a retrospective cohort study. BMC Ophthalmol 2014; 14: 126.
- Hoover A, Michael G. Locating the optic nerve in a retinal image using the fuzzy convergence of the blood vessels. IEEE Transact Med Imag 203; 22: 951-958.
- Jiang X, Daniel M. Adaptive local thresholding by verification-based multithreshold probing with application to vessel detection in retinal images. IEEE Transact Pattern Anal Machine Intell 2003; 25: 131-137.
- Sakthivel K, Jayanthiladevi A , Kavitha C. Automatic detection of lung cancer nodules by employing intelligent fuzzy cmeans and support vector machine. Biomed Res 2016; 27: S123-S127.
- Malathi K, Nedunchelian R. Detecting and Classifying Diabetic Retinopathy in Fundus Retina Images using Artificial Neural Networks-based Firefly Clustering Algorithm. ARPN J Eng Appl Sci 206; 11: 3419-3426.
- Malathi K, Nedunchelian R. An Efficient Method to Detect Diabetic Retinopathy Using Gaussian-Bilateral and Haar Filters with Threshold Based Image Segmentation. Res J Appl Sci Eng Technol 2014; 8: 1389-1395.