ISSN: 0970-938X (Print) | 0976-1683 (Electronic)
Biomedical Research
An International Journal of Medical Sciences
Research Article - Biomedical Research (2017) Artificial Intelligent Techniques for Bio Medical Signal Processing: Edition-I
A novel region based segmentation of hepatic tumors and hepatic vein in low contrast CTA images using Bernstein polynomials
Department of Electronics and Communication Engineering, College of Engineering, Anna University, Chennai, India
- *Corresponding Author:
- Selvalakshmi VM
Department of Electronics and Communication Engineering
College of Engineering, Anna University
India
Accepted date: January 18, 2016
The paper presents the automated region based segmentation of liver tumor and hepatic vein from abdominal CTA images of diseased populations with inconsistent enhancement. In this paper, the liver is first segmented from abdomen CTA images using fast and reliable semi-automatic method localizing region-based active contours. A new fuzzy Bernstein polynomial level set algorithm is proposed for fast and efficient segmentation of liver lesions and hepatic vein. The region of interest is represented in a lower dimensional subspace using a set of pre-defined Bernstein basis functions. The initial level set is able to evolve directly from the initial segmentation by spatial fuzzy clustering to segment lesions and hepatic vein. The performance evaluation of the proposed algorithm was carried out on the dataset of 10 liver tumor patients. The performance comparison of the proposed algorithm with other state of art algorithms demonstrates its robustness in segmenting low contrast and inhomogeneous CTA images.
Keywords
Level set methods, Spatial fuzzy clustering, computed tomography images, Bernstein polynomials
Introduction
According to the statistics of American Cancer society, throughout the world, more than 700,000 people are diagnosed with liver cancer every year. Liver cancer ranks at fourth place among predominant cancer types, accounting for more than 600,000 death cases each year. The development of methods explained/proposed in this paper is inspired by two clinical applications [1] (i) Living-Related Liver Transplantation (LRLT): It is a surgical procedure where a part of the liver from a living donor is transplanted into the patient’s body. (ii) Oncologic resections: it is a resection procedure of cancer affected liver tissue. The structure and location of hepatic vessels and their relationship to tumors and liver segments are of great interests to the surgeons for performing liver surgery planning [2]. For planning of surgeries, the surgeon should be provided with the 3D representation of the hepatic vasculature and lesions. In this paper, computational methods for the segmentation and visualization of hepatic vasculature and lesion are focused.
The computerized medical image segmentation techniques face two important challenges such as poor resolution and weak contrast. In Computed Tomography (CT) images, neighbouring organs will have low-intensity differences due to similar Hounsfield Units (HU) [3]. To overcome these challenges in CT image segmentation, the geometric active contours have been used. It is divided into two subgroups such as edge based and region based techniques. In edge based technique, the initial contour evolves geometrically with the stopping criteria governed by edge information extracted from the image. Region based techniques are used in cases where edge information is unreliable. There have been many hybrid medical systems which use fuzzy clustering to speed up the level set evolution [4]. Mukherjee and Acton proposed an edge independent segmentation approach called Legendre Level Sets (L2S) which is robust to intensity variations [5]. Our previous work on liver tumor segmentation [6] has shown that the fuzzy clustering not only relieves manual intervention by approximately delineating the boundaries but also accelerates the Legendre Level set evolution.
In this paper, we propose a new edge independent segmentation algorithm Bernstein Level Set (BLS) which is initialized using fuzzy clustering approach. Compared to our previous methods [6], the new algorithm is very fast and efficient in segmenting highly inhomogeneous regions. The remainder of this paper is organized as follows. Section 2: describes the proposed BLS algorithm initialized using spatial fuzzy c-means clustering for hepatic tumor segmentation and hepatic vein segmentation. Section 3: The results of the proposed and existing algorithms applied to different images are presented. The performance evaluation metrics of the existing and proposed algorithm are presented and discussed. Finally, the conclusion on the efficiency of the proposed algorithm is discussed in section 4.
Methods and Materials
Liver segmentation
In order to perform liver tumor and vessel segmentation, the liver has to be extracted from the whole abdomen CTA image (Figure 1). In this work, the liver is extracted by utilizing the local region based semi-automatic approach introduced [7]. The contour is roughly selected by the user in all the slices. The selected contour is used as the initial contour for the active contour to evolve. The evolution of initial contour is based on local information, which makes it capable of segmenting objects with heterogeneous feature profiles.

Figure 1: A schematic of the automated technique for the hepatic lesion and hepatic vein segmentation. The blue and green boxes show the input and output data respectively. The orange boxes represent different modules of the proposed algorithm.
Figure 2 shows the 3 different initial contours marked. Figure 2a shows contour marked well inside the area of interest Figure 2c shows contour marked well outside the area of interest and Figure 2e shows contour more near the area of interest. As the segmentation result depends completely upon user’s knowledge of location of liver, the contour which is near the area of interest evolves very fast and produce good segmentation results when compared to the other two initial contours.

Figure 2: Segmentation of liver from CTA abdomen image using localizing region-based active contours (a) Manual initialization-1 (b) Final segmentation after 350 iterations (c) Manual initialization-2 (d) Final segmentation after 100 iterations (e)Manual initialization-3 (b) Final segmentation after 15 iterations.
Tumor segmentation
The proposed tumor segmentation algorithm is a multistage segmentation technique consisting of 3 stages
1). Image de-noising: Median filter is used to improve the contrast of the tumor region and reduce the speckle noise.
2). Spatial fuzzy c-means algorithm: The spatial FCM clustering is applied to the filtered image with the number of clusters defined by the user. The cluster of interest is also selected by the user.
3). Bernstein level set: The initial contour of the level set is obtained from the spatial fuzzy c-means output. It is able to evolve directly from the initial segmentation done by spatial fuzzy clustering. The automatic initialization of initial contour will speed up the level set evolution and accurate segmentation.
Image de-noising using median filter
A 3 × 3 2D mask of 8 neighboring pixels is considered for median filtering. The median filter considers each pixel in an image and analyses its 8 neighboring pixels. Then the filter replaces the value of pixel under consideration with the median intensity value of 8 neighboring pixels. The median is calculated by first sorting the neighborhood pixel intensity values and then the average of their two middle values is obtained as median value. When considering the next pixel for filtering the updated neighborhood values are used. The concept of median filter can be represented pictorially by Figure 3.

Figure 3: Working of 3 × 3 median filter. In filtering process the center pixel value 150 is replaced by 124 which is the median value of the 8 neighborhood pixels.
Spatial fuzzy c-means algorithm
The estimation of the centroid and the scope of the subclass are done adaptively in fuzzy clustering, thereby minimizing the predefined cost function. Hence it is appropriate to consider fuzzy clustering as adaptive thresholding. The standard FCM algorithm wrongly classifies the noisy pixel in noisy images because of its abnormal feature data [8]. To avoid this, Chuang et al. incorporated the spatial information into fuzzy membership function.
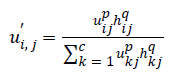
P and q are controlling parameters.
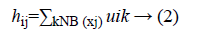
NB (xj) represents a square area with xj as spatial domain center. hij is the spatial function. In the homogenous region, the original membership and clustering result does not change. In the case of noisy images the Equation 2 reduces the weight of noisy cluster [8]. Hence the misclassified pixels in noisy images are corrected by spatial fuzzy c-means algorithm.
Bernstein polynomial basis function
In the mathematical theory of function approximation, the Bernstein polynomial plays a very important role. It approximates known as well as unknown functions with the desired degree of accuracy. The level set formulation [9] of Chan-Vese energy functional is written as,
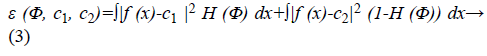
The image f (x) is defined over the domain Ω. Φ is the level set function which is positive inside the zero level set and negative outside the zero level set. The regularized version of Heaviside function is represented by Hϵ. The level set function Φ which minimizes the energy function ε (Φ, c1, c2) creates segmentation so that the foreground and background are approximated by intensity levels c1 and c2. In the proposed method the scalar c1 and c2 of Chan-Vese energy functional is replaced by two smooth functions c1m (x) and c2m (x). Linear combination of few Bernstein basis functions is used in the proposed method to represent c1m (x) and c2m (x). Mathematically the two smooth functions are written as,
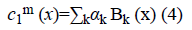
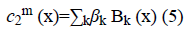
Bk is a multidimensional Bernstein polynomial. The 2D Bernstein polynomial is given by [9],

where 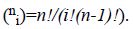 There are
 degree Bernstein
polynomials
degree Bernstein
polynomials 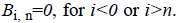 The main objective of the
proposed method is to perform segmentation in the presence of
intensity inhomogeneity. For example, the Bernstein
polynomial [10] of degree 2 are given by,
The main objective of the
proposed method is to perform segmentation in the presence of
intensity inhomogeneity. For example, the Bernstein
polynomial [10] of degree 2 are given by,
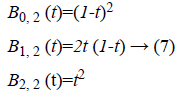
Where  is plotted as (Figure 4)

Figure 4: Bernstein polynomial of degree 2.
Curve evolution of Bernstein level set
The Bernstein polynomial in vector form is given by Ɓ=(B0 (X)
….BN (X))T. The coefficient vectors of two regions are given
by 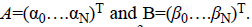 The total number of basis
function is N=(m+1)2. The Chan-Vese energy function given
by Equation 3 can be rewritten in vector form as,
The total number of basis
function is N=(m+1)2. The Chan-Vese energy function given
by Equation 3 can be rewritten in vector form as,
The parameter ν which regulates the smoothness of the evolving curve should be set according to the noise level of the image to be segmented.
Spatial FCM clustering based Bernstein level set
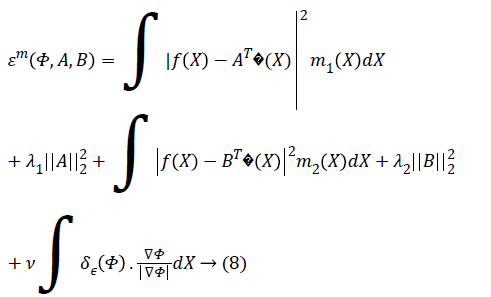
In the proposed method, general-purpose computational models such as spatial FCM and level set methods are applied to segment liver tumor efficiently. The results of spatial fuzzy clustering are utilized to initiate level set segmentation and regularizing level set curve evolution. The spatial FCM algorithm is used to determine the approximate contours of interest. The approximate contour of interest known as zero contour starts from an arbitrary region [11].
C is a constant. The Dirac function is given by
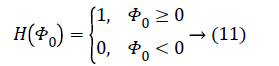
The Heaviside function H (Φ0) is given by,
 The smoothing
parameter ν will have values 0<ν<1, where higher value of ν
makes the contour smoother. For noisy images, ν should be set
higher. The regularizing parameters λ1, λ2>0 are the fitting term
parameters. It can adjust intensity variations between average
intensity inside and outside the level set curve C. ie c1 and c2 with the corresponding values of object and background [8]. λ1,
λ2 are considered equal in this paper. By numerically solving
the following Equation 5 curve evolves,
The smoothing
parameter ν will have values 0<ν<1, where higher value of ν
makes the contour smoother. For noisy images, ν should be set
higher. The regularizing parameters λ1, λ2>0 are the fitting term
parameters. It can adjust intensity variations between average
intensity inside and outside the level set curve C. ie c1 and c2 with the corresponding values of object and background [8]. λ1,
λ2 are considered equal in this paper. By numerically solving
the following Equation 5 curve evolves,
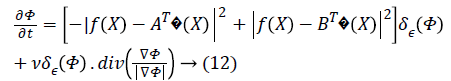
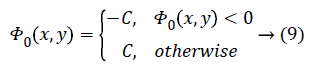
where δε (Φ) is the regularized version of the Dirac delta function.
Vessel segmentation
Once the liver and tumor were segmented, vessel segmentation is carried out. The hepatic vessels extraction is one of the critical tasks in clinical practice. The complex structure and low contrast of the hepatic vessels make CTA image segmentation a challenging task. The structure and location of hepatic vasculatures are very important in planning and performing hepatic surgeries. For performing surgeries better, the surgeon must know the relative location of the hepatic tumor to major blood vessels. Based on the information which radiologist gives to the hepatic surgeon the proper surgical approach is chosen. The information on anatomy and location of the hepatic vein plays an essential role in surgical planning to avoid post-operative complications such as venous congestion [12]. Various algorithms have been proposed for vasculature segmentation in medical images. Meinzer et al. proposed a surgical planning system based on object-oriented framework [13]. The vessel tree is segmented by threshold based method where the threshold and starting point are selected by the user. Sum and Cheung proposed an approach for segmenting vessels based on level sets. They considered a local term that takes local image contrast into account [14]. This is a semi-automatic method where the user initiates the initial level set. Oliveira et al. proposed a region growing algorithm based on Gaussian mixture model to segment liver vasculature [15]. Zeng et al. proposed the extreme learning machine method for liver vessel segmentation [16]. At first, the image noise is removed by anisotropic filter and then vessel filters like sato, frangi, offset medialness filter and strain energy filter are used to extract vessel structure features. Then ELM is applied to segment liver vessels from the background. The vessel segmentation algorithms [17,18] are generally classified into i) pattern recognition techniques ii) model-based approaches iii) Tracking-based approaches iv) artificial intelligence-based approaches v) Neural network-based approaches. In this paper, the vessel segmentation technique is similar to the segmentation algorithm for tumor. The proposed Fuzzy Bernstein level set algorithm segments the hepatic vessel very fast and accurate when compared to other existing techniques.
Results and Discussion
Dataset
In order to demonstrate the strength and limitations of the proposed algorithm, the clinical dataset of portal venous phase images of 5 liver tumor patients have been used. Each patient dataset has an average of 35 CT scan images. The patients are in the average age group of 60. The dataset has been collected from Liberty scans, Chennai, India. The dataset used are acquired using a Philips iCT 256 machine. The resolution of the CT image is 0.68 × 0.68 mm in axial view with a thickness of 5 mm. the ground truths are marked carefully by the expert radiologists.
Parameter selection
The proposed algorithm requires specification of few parameters namely a number of cluster for spatial FCM clustering n, Bernstein polynomial degree m and regularizing parameters λ1 and λ2. To cluster both the inhomogeneous and homogeneous tumor, the cluster number n=3 is enough. As the CTA images used have very low contrast, to cluster the hepatic vein, n=6 is required. The 1D Bernstein polynomial of highest degree m=2 adequately models the intensity variations in the image. Choosing a larger value of m will add to the computational cost. The regularizing parameters λ1 and λ2 are considered equal for simplicity. λ1=λ2=0.5 is used throughout in this paper. For all the images, the smoothing parameter ν=0.3 is used in this paper.
Figure 5 illustrates the liver tumor segmentation where 5 examples are shown to demonstrate the capability of the proposed model. They include a phantom image of the liver with lesions, extracted from CT abdomen phantom to illustrate the idea and 4 CTA images obtained from the same patient for the feasibility study. In each image, the tumor has a weak and indistinct boundary. Moreover, the tumor is inhomogeneous and lies near the liver boundary, which makes the segmentation task tougher. The input image is clustered into three, among which the cluster containing tumor is selected for level set evolution.

Figure 5: Comparison of liver tumor segmentation algorithms. (a) CT Liver images of a single patient (b) Spatial FCM of liver images (c) Segmentation output using fuzzy level set technique (d) Segmentation output using fuzzy legendre level set technique with iterations=3, m=3, λ=0.5 (e) Segmentation output using the proposed fuzzy Bernstein level set technique with iterations=2, m=2, λ=0.5.
As the input image has very low contrast, using the spatial FCM algorithm the number of clusters needed to segment the hepatic vein is six. The cluster containing the hepatic vein is chosen so as to evolve the initial level set.
Performance evaluation
To evaluate the performance of the proposed algorithm, it is compared pictorially and quantitatively with those closely related algorithms such as fuzzy level set approach [4] and our previous work fuzzy Legendre level set (Figure 6) [6]. The spatial fuzzy clustering level set method [4] proposed by Li et al. is an automated segmentation technique. The level set evolves utilizing the spatial fuzzy cluster as an initial contour. The FCM algorithm which incorporates the spatial information into fuzzy membership function approximates the boundaries of interest well. Our previous method fuzzy Legendre level set algorithm [6] is an edge independent segmentation approach. The Legendre level set approach proposed by Mukherjee and Acton [5] is utilized to evolve the initial curve obtained from the spatial FCM clustering. In the Legendre level set algorithm, the intensity inhomogeneity is modelled using Legendre basis function.

Figure 6: Comparison of hepatic vein segmentation algorithms.
The computational time of the proposed algorithm for both tumor and hepatic vein segmentation is very less compared to the existing methods (Figures 7 and 8, Tables 1 and 2).
| Algorithm | Image 1 | Image 2 | Image 3 | Image 4 | Image 5 |
|---|---|---|---|---|---|
| Fuzzy level set | 22.35379 | 22.93168 | 22.03924 | 22.12314 | 22.27158 |
| Fuzzy L2S | 1.367888 | 1.509594 | 1.509213 | 1.628049 | 1.569496 |
| Proposed method | 1.288124 | 1.120557 | 1.206863 | 1.204285 | 1.105159 |
Table 1: Comparison of computation time of liver tumor segmentation algorithms in seconds.
| Algorithm | Image 1 | Image 2 | Image 3 | Image 4 | Image 5 |
|---|---|---|---|---|---|
| Fuzzy level set | 31.35321 | 21.27127 | 22.43313 | 22.04474 | 23.91555 |
| Fuzzy L2S | 1.92264 | 1.554592 | 1.28743 | 1.615414 | 1.420854 |
| Proposed method | 1.511343 | 1.474345 | 1.263298 | 1.292721 | 1.227347 |
Table 2: Comparison of computation time of liver vessel segmentation algorithms in seconds.
| Algorithm | AUC calculated | Diagnostic accuracy |
|---|---|---|
| Tumor segmentation | ||
| FLS | 90.41% | Excellent |
| FL2S | 95.25% | Excellent |
| FBLS | 98.61% | Excellent |
Table 3: Comparison of AUC and diagnostic accuracy of algorithms in segmenting Tumors.

Figure 7: Graphical representation of computation time of liver tumor segmentation algorithms in seconds.

Figure 8: Graphical representation of computation time of liver vessel segmentation algorithms in seconds.
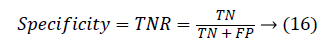
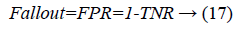
Spatial overlap based metrics: The spatial overlap metrics are derived from the four basic cardinalities of the confusion matrix, namely True Positives (TP), the False Positives (FP), the True Negatives (TN) and False Negatives (FN). To explain these evaluation metrics, consider the following definitions [19]. X: Set of all voxels in an image. G: a set of voxels labelled as ground truth by the experienced radiologist. G ϵ X. A: a set of voxels labelled as the segmented object by proposed algorithm. AϵX. True Positive (TP) is set of commonly labelled voxels between ground truth and proposed method.TP=G ∩ A. True Negative (TN) is set of non-target-object labelled voxels between ground truth and proposed method. TN=(G) ∩ A. False positive FP=Ĝ ∩A. False negative FN=G ∩ Â. X=TP FP FN TN.
The Dice coefficient (DICE) is also called overlap index is the most commonly used metric in medical image segmentation evaluation.
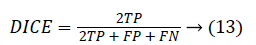
0 ≤ DICE ≤ 1. The DICE value closer to 1 indicates good segmentation and closer to 0 indicates poor segmentation. The Jaccard index (JAC) is given by,
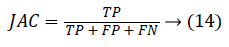
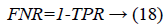
0 ≤ JAC ≤ 1. JAC value closer to 1 indicates good segmentation result and closer to 0 indicates poor segmentation result. The True Positive Rate (TPR) is also called Sensitivity or recall [20] is given by,

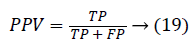
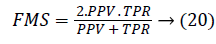
Another measure related to above definitions is precision which is otherwise called as Positive Predictive Value (PPV). It is used to calculate F-measure.
The local confinement error is given by
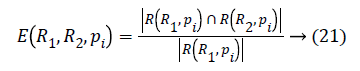
If two segments R1 and R2 are subsets then pi will be the area of confinement. If they are not subsets then error value should be calculated. The Global Consistency Error [14] is calculated in terms of Local Consistency Error, it is given by
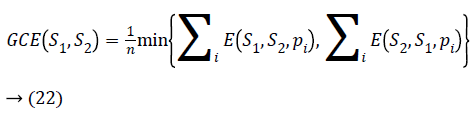
Lower the GCE value, better the segmentation and vice versa.
Calculation of pair-counting based metrics: Rand Index (RI) is a measure of similarity between two segmented regions [3]. RI=(a+b)/(a+b+c+d), where the number of agreements between two segmented regions is given by a+b and disagreements are given by c+d. Rand Index value closer to one indicates good segmentation and 0 indicates poor segmentation (Figure 9).

Figure 9: Graphical representation of DC, JAC, Precision, RI, Entropy (PPV), GCE, VoI.
Information theoretic based methods: Variation of
Information (VoI) is a measure of distance between two
clusters. VoI  where H (R1) is entropy of R1, H (R2) is entropy of R2 and MI (R1, R2) is
mutual information between R1 and R2. VoI value closer to 1
indicates identical clusters and 0 indicates dissimilar clusters.
where H (R1) is entropy of R1, H (R2) is entropy of R2 and MI (R1, R2) is
mutual information between R1 and R2. VoI value closer to 1
indicates identical clusters and 0 indicates dissimilar clusters.
The evaluation of segmentation accuracy metrics shows that the proposed algorithm outperforms the other state of art algorithms in segmenting the liver tumor and hepatic veins.
The ROC (Receiver Operating Characteristic) curve (Figure 10) is a plot of TPR against FPR. A ROC curve demonstrates:

Figure 10: ROC curve (a) Comparison of algorithms in tumor segmentation.
1. The tradeoff between sensitivity and specificity.
2. The more accurate test: the curve is closer to the left-hand border and then to the top border of the ROC curve.
3. Less accurate test: when the curve is closer to the 45-degree diagonal of the ROC space.
4. The area under the ROC curve (AUC) is a measure of test accuracy [21].
The Area Under the ROC Curve (AUC) will always satisfy, 0 ≤ AUC ≤ 1. When AUC is close to 1, the test is said to be a perfect diagnostic test. When the AUC is less than or equal to 0.5, it is said to be a non-discriminating test [22]. It can be observed that the proposed algorithm segmented even the fine branches and larger branches of the hepatic vein. The validation results for blood vessels are obtained through corrosion casts that require expensive equipment. Hence the hard to achieve validation of vessels are not carried out in this paper.
Conclusion
A novel fuzzy level set algorithm has been proposed for automated segmentation of liver tumor and hepatic vein. The proposed algorithm utilizes the spatial fuzzy clustering to locate the boundary of the region of interest exactly. The extracted region of the interest boundary is used as the initial level set contour. This enables the level set evolution to be faster and accurate. The Bernstein polynomials are used to model the regions of foreground and background in Chan-Vese energy functional. Performance evaluation has been carried out using 5 different slice images from the same patient. The experimental results showed satisfied performances. In future work, we would like to reconstruct the segmented tumor and hepatic vein in 3D. The 3D model will be used to calculate the distance between tumor and hepatic vein, which will be critical information for efficient hepatic surgery planning.
Acknowledgement
The authors would like to thank Dr. Ramesh, Liberty Scans, Chennai for providing the necessary CTA images and evaluating the results. We would also like to extend our gratitude to Dr. Prabhakarakumar, Kovai scans, Coimbatore for his valuable discussion and comments.
References
- Selle PB, Schenk A, Peitgen HO. Analysis of vasculature for liver surgical planning. IEEE Trans Med Imag 2002; 21: 11.
- Do YK. Hepatic vessel segmentation on contrast enhanced CT image sequence for liver transplantation planning. J Biomed Sci Eng 2013; 6: 498-503.
- Anusha A, Rajeswari M, Ramachandran D, Aziz ME, Shuaib IL. Wavelet energy-guided level set based active contour: A segmentation method to segment high similar regions. Comp Biol Med 2010; 40: 608-620.
- Li BN, Chui CK, Ong SH, Chang S. Integrating FCM and level sets for liver tumor segmentation. Proc 13th Int Conference Biomed Eng 2009; 23: 202-205.
- Mukherjee S, Acton ST. Region-based segmentation in presence of Intensity inhomogeneity using Legendre Polynomials. IEEE Sig Proc Lett 2015; 22: 3298-3302.
- Selvalakshmi VM, Nirmala DS. Improved fuzzy clustering and Legendre level sets for segmentation of multiple tumors in low contrast liver CTA images. Mach Learn Techn Med Biol Appl Int J Biomed Eng Technol 2011.
- Lankton S, Tannenbaum A. Localizing region-based active contours. IEEE Trans Imag Proc 2008; 17: 11.
- Chuang KS, Tzeng HL, Chen S, Wu J, Chen TJ. Fuzzy c-means clustering with spatial information for image segmentation. Comput Med Imaging Graph 2006; 30: 9-15.
- Chan TF, Vese LA. Active contours without edges. IEEE Trans Image Process 2001; 10: 266-277.
- Kenneth IJ. Bernstein polynomials- On-line geometric modeling notes. Univ California 2005.
- Li BN ,Chee KC, Stephen C, Ong SH. Integrating spatial fuzzy clustering with level set methods for automated medical image segmentation. Comp Biol Med 2011; 41: 1-10.
- Barbaro B, Soglia G, Alvaro G, Vellone M, Giuliante F. Hepatic veins in presurgical planning of hepatic resection: what a radiologist should know. Abdom Imaging 2013; 38: 442-460.
- Meinzer HP. Computerized planning of liver surgery-an overview. Comp Graphics 2002; 26: 569-576.
- Sum KW, Paul YSC. Vessel extraction under non-uniform illumination: A level set approach. IEEE Trans Biomed Eng 2008; 55: 358-360.
- Dario ABO, Raul QF, Mauro MC. Segmentation of liver, its vessels and lesions from CT images for surgical planning. Biomed Eng 2011.
- Zeng YZ,Yu QZ, Miao L, Bei JZ, Xiao FW, Wei W. Liver vessel segmentation based on extreme learning machine. Eur J Med phys 2016; 709-716.
- Kirbas C, Quek F. A review of vessel extraction techniques and algorithms. ACM Comput Surv 2004; 36: 81-121.
- Dice LR. Measures of the amount of ecologic association between species. Ecology 1945; 26: 297-302.
- Khooshabi GS. Segmentation validation framework. Res Thesis Linkoping Univ 2013.
- Taha AA, Hanbury A. Metrics for evaluating 3D medical image segmentation: analysis, selection, and tool. BMC Med Imaging 2015; 15: 29.
- Antonin S. ROC analysis with Matlab. Proc 29th Int Conf IT Interf 2007; 25-28.
- Ana-Maria S. Measures of diagnostic accuracy. J Int Feder Clin Chem Lab Med 2009.