ISSN: 0970-938X (Print) | 0976-1683 (Electronic)
Biomedical Research
An International Journal of Medical Sciences
Research Article - Biomedical Research (2019) Volume 30, Issue 1
A novel approach-foot tumour detection algorithm using watershed and thresholding based segmentation.
Ashok Kumar VD1* and Subedha V2
1Department of Computer Science and Engineering, St.Peter’s University, Chennai, India
2Department of Computer Science and Engineering, Panimalar Institute of Technology, Chennai, India
- *Corresponding Author:
- Ashok Kumar VD
Department of Computer Science and Engineering
St.Peter’s University, Chennai, India
Accepted date: January 5, 2019
DOI: 10.35841/biomedicalresearch.30-17-1943
Visit for more related articles at Biomedical ResearchDetection of foot tumour has always been a little tedious as it is generally confounded with other diseases of the foot. Hence, the method of detecting foot tumour is of utmost importance. Though image processing techniques have replaced the original biopsy method, these classical methods are still attributed to a few drawbacks. In this paper we have proposed an efficient methodology which extracts the image and converts an input color image to YcBcRc components and each component of YcBcRc component are extracted separately to detect the exact size and location of tumour region in the foot using threshold and watershed segmentation algorithms by applying morphological operators. After the scanned MRI is enhanced using segmentation, the tumour can be detected effectively.
Keywords
Footprint, Tumour, Segmentation, Detection
Introduction
The human foot is the most neglected area of the body, often ignored until a serious problem arises. Foot tumor is often missed or is diagnosed very late, owing to the difficulty in identification. A study shows that the overall survival rate for 5 y was 52% for patients having a primary foot melanoma compared to 84% patients with primary melanoma in other parts of the lower part of the human body [1]. Foot tumor can be of primarily 2 types: bone tumor and soft tissue tumor. The right way of detecting the type and intensity of tumor is of at most importance as it aids in timely diagnosis. When it comes to diagnosis, imaging is an essential area of medical sciences to visualize the human body’s anatomical structures. Several imaging techniques are used, of which magnetic resonance imaging (MRI) is significant in detecting tumor in various parts of the human body. It is a superior technique wherein high quality images with good spatial resolution are generated depicting a magnificent discrimination of soft tissues. Segmentation is often employed as a part of image processing technique to detect the exact region where a tumor exists. It is used to partition the digital image into different segments and locate tumors and various other pathologies. Segmentation can be done in different methods. Choice of a particular segmentation technique depends on type of image under consideration and its properties and characteristics. In our paper, we have proposed a hybrid technique of segmentation that will overcome the difficulties of the techniques considered individually.
Review of Existing Methodology
It is difficult to identify a soft tissue tumor, because they are often mistaken as simple lesions. Certain examples such as ganglion cysts occur so frequently in the foot ankle that it has often led to the careless assumptions that every asymptotic, soft, movable represents a benign lesion. Sometimes this lackadaisical confidence can lead to misdiagnosis and disaster in certain situations.
Whenever a patient comes in with a soft tissue tumor, the first step is to determine whether the lesion in benign or malignant. These patients initially represent with a bump on the foot with some sort of pain in shoe-gear. But most of the soft tissue neoplasm in the foot and ankle present earlier in their course than tumors at other sites in the body because of the relatively thin soft tissue covering these areas [2]. Small masses are usually easily palpable in the foot and ankle regions [3]. Always make sure to emphasize a careful history and thorough documentation to determine the duration of symptoms, rate of growth, associated pain, history of trauma or infection. A family history is also essential. Common clinical symptoms, such as pain, discomfort, tenderness and localized swelling, may be secondary to mechanical obstruction of tightly bound gliding mechanisms of muscles, tendons and ligaments that encompass the foot and ankle areas. However, not all soft tissue neoplasms are painful or small [4]. Size is not a predictor of malignancy. Certain cysts can be diagnosed with a large-bore, 18 gauge needle. In general foot tumor detection involves in taking up an MRI scan over the region where the lesion is located and doing a physical test to confirm it.
The commonly used technique for processing an MRI is clustering approach. The existing clustering techniques used to detect tumor cluster are two.
k-means clustering
K-means clustering is an algorithm to group objects based on attributes/features into k number of groups where k is a positive integer. The grouping (clustering) is done by minimizing the Euclidean distance between the data and the corresponding cluster centroid. Thus the function of k-means clustering is to cluster the data [5].
Fuzzy C-means algorithm
The minimization of the c-means functional represents a nonlinear optimization problem that can be solved by using a variety of methods, including iterative minimization, simulated annealing or genetic algorithms. The most popular method is a simple Picard iteration through the first-order conditions for stationary points, known as the fuzzy c-means (FCM) algorithm. Fuzzy clustering is basically a multi valued logic that allows intermediate values member of one fuzzy set can also be members of other fuzzy sets in the same image. There is no abrupt transition between full membership and non-membership. The membership function defines the fuzziness of an image and also to define the information contained in the image. These are three main basic features involved in characterizing by membership function. They are supported boundary. The core is a full member of the fuzzy set. The support is a non-membership value of the set and boundary is the intermediate or partial membership with value between 0 and 1 [6,7].
Proposed Methodology
The main disadvantages of using existing clustering algorithms are:
• The number of clusters is predefined, which makes them inadequate for batch processing of huge image databases [8].
• The clusters are represented by their centroid and built using a Euclidean distance therefore inducing generally a hyperspheric cluster shape, which makes them unable to capture the real structure of the data.
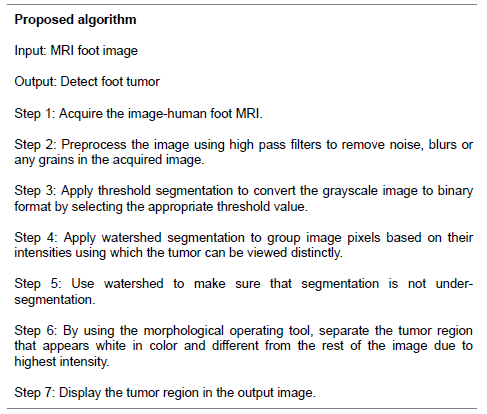
Hence, a new method using segmentation has been proposed for tumor diagnosis. It involves the following steps (Figure 1).

Figure 1: Proposed system.
A. Image acquisition (Acquiring foot MRI)
Images are acquired using MRI scanning. This method involves placing a patient in the presence of a powerful magnet and thereby passing radio waves through the body in short pulses. This can detect the differences in the human tissues as a result of which these tissues produce signals that can be detected and encoded spatially. These signals can be detected by a computerized system using which the strength of the signals can be evaluated. The result of the signals produced can be used to generate images of the human tissues. The images thus obtained, can be in jpg, bmp or any suitable medical image format which is represented in a 2D plane.
B. Conversion of RGB to YcBcRc component
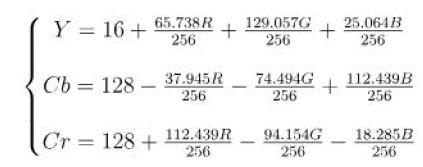
In real time processing, the videos and images are stored in default RGB color space, because of sensitivity of various color in human visual system. In YcBcRc color space, it is often used to take lower resolution capability of human visual system for colors with that of luminosity. Hence RGB to YcBcRc conversion is majorly used in video and image processing. An image in RGB format is taken as an input which is represented in 8 bits per sample, in which 0 and 255 are represent the black and white colors respectively. The following is the equation used for obtaining YcBcRc components.
In general, videos and images stored in RGB image format consume a lot of data. Since these images require larger bandwidth, it is not suitable for transmitting or storing the images in RGB color format. The conversion of entire pixel in YcBcRc can overcome the above mentioned drawback.
• Extract each component of YcBcRc individually
After converting the RGB image to YcBcRc image, extract each component separately.
• Find histogram and pixel value for each component
Histogram is nothing but the representation of frequency of each intensity level in an image.
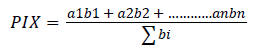
Pixel value for each component using below formulae:
• Calculating threshold for an image
Histogram is be used for representing the frequency of grayscale values of an image. Threshold values can be fixed based on the histogram. In general, two types of thresholding is applied on an colored image namely (a) Global thresholding where all pixels are assigned a zero value if it is below the marginal level else, we assign maximum value i.e. 255 for an 8 bit pixel image. b) Local thresholding is just comparison of value with a marginal value and rearranging the pixel values.
The simplest approach to segment an image is by thresholding (i.e.)
If a (x, y)>T, then a (x, y)=0
Else a (x, y)=255
Where x, y are pixel points of an image and T is the marginal level
(i) Automatic thresholding value: Automatic selection of threshold value by a system will make segmentation more robust. For this, enough knowledge about the environment is required and object should be correctly used to choose the threshold value automatically.
The following factors involved in setting up automatic threshold value are:
• Size of the objects
• Number of different objects representations in an image.
• Intensity of an object
(ii) Choosing the threshold by histogram image: Strong peaks in the histogram are mainly due to uniform intensity in the image regions.
If a (x, y)<T1 then
a (x, y)=255
else If T1 a (x, y) T2 then
a (x, y)=128
else
a (x, y)=0
In general, a threshold value is said to be good if the histogram peaks are tall, narrow and symmetric that are separated by deep valleys.
Algorithm for conversion of RGB to YcBcRc components.
Following is the algorithm used for color image extraction
Input: N number of colored skin images (a0, a1,......an)
Output: Extracted image.
Begin
Read the input image.
Convert the RGB input Image to YcBcRc image.
Extract each COMPONENT of YcBcRc image separately
Evaluate pixel value for the image
If (YcBcRc) pixel value>threshold and histogram values Then
Mask the input Image with some color
else
Return the original input image
End
Preprocessing
It is a primitive operation in image processing. This stage involves correction or complete removal of distortion, abnormality, degradation and noise introduced in the imaging process. This results in conversion of the image into a normalized form which results in a corrected image, as precise as possible to some defined standard. After converting the image to the grayscale form, this operation can be applied and is said to involve various enhancement techniques as follows:
a) Noise removal: Digital images are generally prone to a wide variety of types of noise. It occurs as a result of errors in the image acquisition process that result in pixel values that do not reflect the exact pixel values thereby, altering the intensity of the image [9]. Hence, it is necessary to remove the noise from the image to enhance its quality. There are a number of ways by which noise can be removed. The selection of method depends on how the image is created. Here, linear (for gray noises) or median (for salt and pepper noises) filters can be used for this purpose.
b) Smoothing: Sometimes, images may appear blurred which results in poor quality of the image. In such a case, low pass filters can be used to reduce the blurring effect of the image.
c) Sharpening: Sharpening is a technique used to make the edges appear more distinct to differentiate the gray levels. High pass filters can be used for this purpose which will boost the edge detail but not cause any changes in the image gray levels.
Sharpening is an essential part of pre-processing in this method as it is necessary to sharpen the edges which will aid in detection of boundary and exact area of tumor present in the foot.
At the end of the pre-processing phase, the image is enhanced, thereby resolving finer details.
Processing
This step is when the major technique is applied to the image to analyse and manipulate the image in order to obtain the desired result. In this method, segmentation is used to process the foot MRI.
Segmentation: Segmentation refers to dividing the digital image into various partitions in order to obtain some desired information of object from the image. In order to obtain details about a particular feature, the division can be done based on the occurrence of that feature in various regions of the image. It is an inevitable step in detection of tumor from an enhanced MRI. There are various types of segmentation techniques. In this paper, we describe and use the threshold segmentation and watershed segmentation techniques.
Threshold segmentation: The image that is presented as input image is converted into a binary format from gray scale. This involves selecting a threshold value. It may be applied to the image directly or might include pre and post processing [10]. In this technique, it is applied directly. Depending on the intensity value, the pixels are partitioned.
Global thresholding:
g (x, y)=1, if f (x, y)>T
0, if f (x, y) ≤ T
Common methods under this segmentation include k-means clustering and maximum entropy method [11]. It is the best technique as it is intensity based.
Watershed segmentation: Based on the intensity, the pixels of an image are grouped together. It is the best technique to divide an image in order to separately remove out the tumour region. Watershed technique is a mathematical operational tool. Since watershed suffers from over and under segmentation [12], it is not used on the input but used to check the output.
Post processing
This is the final step that is to be applied to the image to extract the tumour region from the image clearly. For this a set of morphological operators are applied to the image to attain the aim.
Morphological operators: After the image is converted to the binary form, some morphological operators need to be applied to the binary mask image. This is done in order to make visible only that part of the region where the tumour is detected and found to be present. That region is shown specifically in white colour and that is the part which is the region containing more intensity. Some important commands used in this step are: a) strel: to create morphological structuring element. b) imerode: this is used to erode the binary image. This can be applied to either the binary or the grayscale image. Here, erosion refers to shrinking the image.
IM2=imerode (IM, SE)
Here, IM is the binary image and IM2 is the eroded image. SE refers to the structuring element [13]. c) imdilate: It is used to dilate (expand or fill) the image [14].
Experimental Results and Discussion
Following are the various parameters used in evaluation:
Accuracy A=TPV/ TPV+FPV
Precision P=TPV+TNV/ TPV+TNV+FPV+FNV
Case (i) Computation of accuracy and precision values for Yc component
Here true positive value and true negative value gives the appropriate values which represent the Yc component correctness and predictable values (Table 1).
| Input image ID | Pixel values | True positive value (TPV) | True negative value (TNV) | False positive value (FPV) | False negative value (FNV) | Precision value (P) | Accuracy value (A) |
|---|---|---|---|---|---|---|---|
| 1 | 0, 1, 2 | 98 | 8 | 7 | 99.45 | 0.49 | 85% |
| 2 | 0, 1, 2 | 98 | 8.9 | 8.8 | 98.76 | 0.49 | 83% |
| 3 | 0, 1, 2 | 99.77 | 7 | 6.4 | 99.33 | 0.49 | 93% |
| 4 | 0, 1, 2 | 99 | 5.45 | 3.5 | 99.1 | 0.49 | 96% |
| 5 | 0, 1, 2 | 99.34 | 4 | 7.45 | 99 | 0.5 | 93.23% |
Table 1: Computation of precision and accuracy based on TPV, TNV, FPV and FNV.
Case (ii) Accuracy and precision value for Bc component
Here Bc component gives the best and correct values in which the image is exactly same as that of the original image (Table 2).
| Input image ID | Pixel values | True positive value (TPV) | True negative value (TNV) | False positive value (FPV) | False negative value (FNV) | Precision value (P) | Accuracy value (A) |
|---|---|---|---|---|---|---|---|
| 1 | 0, 1, 2 | 99.34 | 5.2 | 5 | 100 | 0.49 | 95.20% |
| 2 | 0, 1, 2 | 99 | 6.9 | 8.6 | 99 | 0.5 | 92% |
| 3 | 0, 1, 2 | 97 | 3.2 | 2.9 | 99.38 | 0.49 | 97% |
| 4 | 0, 1, 2 | 96.3 | 5.8 | 6.4 | 97.23 | 0.49 | 93.70% |
| 5 | 0, 1, 2 | 98.45 | 2.9 | 1.6 | 99 | 0.495 | 98.40% |
Table 2: Computation of precision and accuracy based on TPV, TNV, FPV and FNV.
Case (iii) Accuracy and precision value for Rc component
The values obtained in the below table are equivalent with the original image but with a lighter accuracy value when compared with above cases (Table 3).
| Input image ID | Pixel values | True positive value (TPV) | True negative value (TNV) | False positive value (FPV) | False negative value (FNV) | Precision value (P) | Accuracy value (A) |
|---|---|---|---|---|---|---|---|
| 1 | 0, 1, 2 | 98 | 9.2 | 1.3 | 96 | 0.485 | 98.60% |
| 2 | 0, 1, 2 | 97 | 4.7 | 1.9 | 98 | 0.49 | 98% |
| 3 | 0, 1, 2 | 99 | 8.5 | 5.6 | 99 | 0.49 | 94.60% |
| 4 | 0, 1, 2 | 98 | 3.5 | 6.9 | 99 | 0.5 | 93.42% |
| 5 | 0, 1, 2 | 99.23 | 2.9 | 2.9 | 100 | 0.498 | 97.16% |
Table 3: Computation of precision and accuracy based on TPV, TNV, FPV and FNV.
Case (iv) comparison of accuracy with existing models
Table 4 and Figure 2 show the comparison of accuracy with existing models.
| Method | Accuracy |
|---|---|
| Fourier | 93.26% |
| Fuzzy | 95.21% |
| Wavelet | 96.49% |
| k-means | 98.47% |
| Proposed method (Fuzzy C-means) | 99.45% |
Table 4: Comparison of accuracy with existing models.

Figure 2: Comparison of accuracy with existing models.
Load the input image. Figure 3 shows the input image. This is the MRI image of the foot that contains brain tumour.

Figure 3: Input foot image.
Next step is to convert the image into grayscale from RGB. The result of this is shown in Figure 4.

Figure 4: Gray scale image.
After converting to a grayscale image, High pass filtering is applied in the pre-processing stage, the result of which is the procurement of an enhanced image as shown in Figure 5.

Figure 5: Enhance foot image.
Now, the tumour detection process will begin. To identify the area of the foot where tumour is present exactly, Threshold segmentation is applied to the image. The result of applying threshold segmentation is shown in Figure 6. The white spots shown in the image are the high intensity tumour regions as detected by the threshold segmentation on the enhanced image.

Figure 6: Threshold segmentation.
This is followed by the application of watershed segmentation to mark only the regions containing tumour. After this a set of morphological operators are applied to the image to make the tumour area appear prominent from the binary mask. The series of transitions to arrive at the end result is shown in Figure 7.

Figure 7: Morphological operators.
Output image
Tumour portion is vividly represented as white on the output image as in Figure 8.

Figure 8: Tumor detected as white portion.
Conclusion and Future Scope
Foot tumors are generally the most neglected when compared to tumours occurring in other parts of the body. This paper provides a detailed and more optimistic approach to detect tumors in the human foot. Generally foot tumors are very complex to segment in an MRI. But the algorithm used in this paper is selected in such a way as to overcome the drawbacks of the existing clustering methodologies by the use of converting it into YcBcRc component along with the threshold segmentation and watershed process which provides an effective method of segmentation of the tumor thereby making it possible to be detected with ease, avoiding biopsy process. This paper can provide a future scope in detecting the type of tumor and also find out which stage it is in.
References
- http: //www.ncbi.nlm.nih.gov/pubmed/12907929
- Johnson MR. Epidemiology of soft tissue and bone tumors of the foot. Clin Pod Med Surg 1993; 10: 581.
- Pontious J, Good J, Maxiam SH. Ganglions of the foot and ankle: A retrospective analysis of 63 procedures. JAPMA 1999; 89: 163.
- Walter JH, Galitz J, Robertson DW. Pigmented villonodularsynovitis pedal manifestations. JAPMA 1994; 84: 574.
- Kransdorf MJ, Jelinek, JS, Moser RP. Imaging of soft tissue tumors. Radiol Clin North Am 1993; 31: 359-372.
- Enneking WF. Musculoskeletal tumor surgery. New York, Churchill Livingstone 1983.
- Gonzalez RC, Woods RE, Eddins SL. Digital image processing. Pearson 2008.
- Schmid P. Colorimetry and color spaces 2001.
- http: //in.mathworks.com/help/images/noise-removal.html
- http: //www.cs.uu.nl/docs/vakken/ibv/reader/chapter10.pdf
- Jichuan S. Adaptive local threshold with shape information and its application to object segmentation. Robotics and Biomimetics (ROBIO), 2009 IEEE International Conference 200; 1123-1128.
- Gang Li. Improved watershed segmentation with optimal scale based on ordered dither halftone and mutual information. Computer Science and Information Technology (ICCSIT), 2010 3rd IEEE International Conference 2010; 296-300.
- http: //in.mathworks.com/help/images/ref/imerode.html
- Hedberg H, Kristensen F, Nilsson P, Owall V. A low complexity architecture for binary image erosion and dilation using structuring element decomposition. Circuits and Systems ISCAS 200 IEEE International Symposium 2005; 4: 3431-3434.