ISSN: 0970-938X (Print) | 0976-1683 (Electronic)
Biomedical Research
An International Journal of Medical Sciences
Research Article - Biomedical Research (2018) Volume 29, Issue 11
A novel approach for diagnosing heart disease with hybrid classifier
DOI: 10.4066/biomedicalresearch.38-18-434
Visit for more related articles at Biomedical ResearchA Cardiovascular disease which is additionally referred to as heart diseases that have been a common and steady issue in the field of medical research. Nowadays various methods were applied which is not robust for the prediction of human being expenses and disease risks for patients. This paper proposed an Orthogonal Local Preserving Projection (OLPP) method to reduce the function dimension of the input high-dimensional data. The dimension reduction improves the prediction rate with the help of hybrid classifier i.e. Group Search Optimization Algorithm (GSO) combine with the Levenberg-Marquardt (LM) training algorithm in the neural network. The LM training algorithm is used to solve the optimization problem and it determines the best network parameters such as weights and bias that minimizes the error. The final output of the optimization technique is combined with the performance metrics as accuracy, sensitivity, and specificity. From the result, it is observed that hybrid optimization techniques increase the accuracy of the heart disease prediction system.
Keywords
OLPP, Classifier, GSO, Levenberg-Marquardt, Heart disease prediction D
Introduction
Heart disease has easily identified over the last decade and has become the leading cause of death for people in maximum countries around the world. Doctors are trying to diagnose quickly and accurately [1]. Heart disease can affect the cardiac tissue and cause sudden cardiac death as a result of heart attack [2]. Coronary heart disease is consistently recording the highest fatality rate among non-infectious diseases, and the rate is still increasing [3]. Coronary heart disease is defined as the problems of the heart that happens because its blood circulation is decreased; it leads to the fatty deposits build upon an inner layer of the blood vessels that provide the heart muscles with blood, resulting in contraction [4]. Various heartrelated defects are called as heart disease that mainly spoils the heart. It causes death all over the world. The hazardous disease causes several people in different countries including India. A large number of people died due to cardiovascular diseases that are yearly increasing [5].
The risk factors for the heart disease are manually detected factors from several measures of medical records is too expensive, time-consuming and an error to be disposed [6]. Diagnosing patients are accurately and monitoring treatments are effectively involved by quality services [7]. An existing feature can be divided into two main categories: appearance-based features and manifold-based features [8]. Performance of the feature extraction and representation, such as linear Principal Component Analysis (PCA), Fisher Linear Discriminant Analysis (FLDA) and Locality Preserving Projection (LPP) are utilized [9]. The extracting functions such as kurtosis and peak factor, the faults diagnosis, degradation process assessment, reliability estimation and residual life prediction that are performed to diagnose and predict health states of the mechanical equipment [10]. Locality Preserving Projections (LPP) is termed as a linear technique. The LPP protects the local manifold structure modeled by the nearest neighbor graph of the patterns so that the learned subspace preserves local information [11].
The main aim of the LPP is to protect the local structure only and does not concern the relative positions of two separate samples [12]. LPP and the Kernel LPP (KLPP) as a nonlinear extension of LPP are obtained from a dimensionality reduction algorithm [13]. An orthogonal basis is obtained from the Orthogonal LPP (OLPP) algorithm [14]. Preservation of the local manifold structure of two projections is mutually performed. On the other hand, optimization problems are totally varied [15]. It has a superior convergence and generalization performance in comparison with other nine sophisticated ANNs [16]. Group Search Optimizer (GSO), performs novel optimization algorithm and it provides continuous optimization problems [17]. This hybrid classifier has been performed in the Coronary Heart Disease (CHD) risk assessment problem and the experimental results are explained and analysed. In this paper by using GSO algorithm performance is combined with the evaluation metrics such as accuracy, sensitivity and specificity are evaluated [18].
Literature Review
Poornima et al. [19] had explained to extend a framework to detect the heart disease. Nowadays several methods were involved to healthcare data set which is not robust for the prediction of future health care utilization such as predicting individual expenditures and disease risks for patients. Reducing the feature dimensions of input high-dimensional data; OLPP method was used. Gravitational Search Algorithm (GSA) was used with Levenberg-Marquardt Training algorithm in the neural network due to the hybrid classifier. For practically UCI machine learning repository such as Cleveland, Hungarian and Switzerland was performed by using Gravitational Search Algorithm (GSA). It was subjected to analyse the performance of the system and combined with the evaluation metrics such as accuracy, sensitivity, and specificity.
Feng et al. had estimated a novel life grade recognition technique based on Supervised Uncorrelated Orthogonal Locality Preserving Projection (SUOLPP) and K-Nearest Neighbor Classifier (KNNC) [20,21]. A time-frequency domain feature set was first established to completely expand the function of various life grades, then SUOLPP was projected to compress automatically provide the high-dimensional time-frequency domain function sets of training and test samples into the low-dimensional eigenvectors with better discrimination, and finally the low-dimensional eigenvectors of training and test samples are input into KNNC to conduct life grade recognition technique.
Qi et al. [22], had proposed a novel efficient population-based heuristic approach for optimal location and capacity of Distributed Generations (DGs) in distribution networks. The main objectives of this approach were low fuel cost, reduced power loss, and voltage profile in an efficient manner. This approach provided to increase a performance of Group Search Optimizer (GSO) that can be explained in the paper by incorporating Particle Swarm Optimization (PSO) into Group Search Optimizer (GSO) for optimal setting of DGs. The output of the basic GSO algorithm and PSO algorithm were combined in the same test system and also executed. The final output of this algorithm performed in an effective manner.
Kazem et al. [23], had explained an original solution based on the Group Search Optimizer (GSO) methodology in order to determine the feasible optimal solution of the Economic Dispatch (ED) problem considering valve loading damages. A new Modified Group Search Optimizer (MGSO) was applied for improving the scrounger and ranger operators of GSO. The proposed MGSO was applied on different test systems and combined with several new methodologies. The output of the proposed method in an efficient manner and prove that MGSO can be used for solving the power system economic load dispatch problem, especially in large-scale power systems.
Anooj [24], had anticipated the development of medical domain application has been one of the most active research areas. A knowledge-based clinical decision support system performs the computer that provides knowledge from medical experts and transfers this knowledge into computer algorithms manually. Improve knowledge from examples or raw data by using Machine learning techniques. The risk prediction of heart patients consists of two phases; they are (1) automated approach for the generation of weighted fuzzy rules and (2) developing a fuzzy rule-based decision support system. The neural network output is combined with the performance of the system based on utilizing accuracy, sensitivity, and specificity.
Proposed Methodology
The initial stage of our system is pre-processing which helps to extract useful data from raw heart disease datasets. Here, the input dataset is high dimensional and it is a great difficulty for prediction. Therefore, feature dimension reduction method is used to reduce the features’ space without losing the accuracy of prediction. Here, OLPP is applied to reduce the feature dimension. Once the feature reduction is applied, the prediction is done based on the hybrid classifier. In the hybrid classifier, GSO is used with LM Training Algorithm. The overall process of the proposed algorithm is divided into three steps, such as 1) Pre-processing, 2) feature reduction using OLPP and 3) prediction using hybrid classifier which combined GSO and Levenberg-Marquardt based neural network. The general architecture of our proposed system is shown in the Figure 1 below.

Figure 1: General architecture of the proposed system.
Pre-processing
The preprocessing step is the imperative step; it incorporates the treatment of missing values. The medical databases are collected from UCI repository which has more missing values, errors, repeated attributes etc.; it cannot be directly applied to prediction. In this preprocessing step can remove these unwanted data and convert it into necessary format for the prediction of risk level.
Orthogonal locality preserving projection for dimensionality reduction
Dimensionality reduction techniques reduced the dimensions of databases other words reduce the number of features. The dimensionality procedure expands the accuracy and performance of the proposed model. The pre-processed input data is given to an OLPP [25,26] for dimensionality reduction which results in better classification accuracy. This dimensionality reduction method has a various stage of processing. The initial stage is the PCA projection which reduces the dimensionality of the input data by performing a covariance analysis between two factors. Let the input pre-processed data is of size m × n.
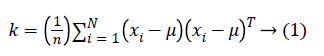
Step 1: Compute the mean μ of the matrix.
Step 2: Calculate the Eigenvector e and Eigenvalues λ of the covariance matrix K. If is a square matrix, a non-zero vector e is an eigenvector of K if there is a scalar such that solve Ke=λe
Step 3: The Eigenvalue and Eigenvectors are arranged and paired. The transformation matrix of PCA is denoted by TPCA. By PCA projection, the extracted features are statistically uncorrelated and the rank of the new data matrix is equal to the number of features (dimensions).
Step 4: Constructing the adjacency graph and choosing the weights: if the node i and j are connected the weight Wij calculated using below equation.
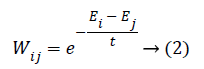
Here, X=(E1, E2, ..., EK) be a set of e-mails. t is a constant. If the node i and j are not connected means we put Wij=0. The weight matrix W of graph G models having the local structure of varies e-mail.
Step 5: Computing the orthogonal basis functions: After finding the weight matrix W we calculate the diagonal matrix M.
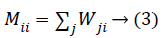
After that, we calculate the Laplacian matrix L using diagonal matrix M and weight matrix W.
L=M-W → (4)
The orthogonal basis vectors 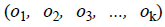 can be calculated as follows:
Step 6: Compute o1 as the eigenvector of associated with the smallest Eigenvalue.
Step 7: Compute ok as the eigenvector of associated with the smallest Eigenvalue of Jk
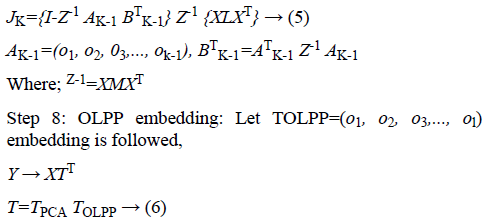
Where; T represents the transformation matrix; Y is the one-dimensional representation of X. This transformation matrix reduces the dimensionality of the feature vectors of the e-mail. This dimensionality reduced features given to the classification process.
Classification process
Heart disease prediction system is applied in hybrid neural network classifier. It is a new model GSO-LM network classifier mainly it is the combination of both the Group Search Optimization algorithm [28] and Levenberg-Marquardt algorithm [27]. The dimensionality-reduced output obtained from the OLPP is applied to the feed forward neural network for training.
Neural network classifier
Generally, it consists of three layers, namely input layer, a hidden layer and an output layer.
• The input layer in this algorithm consists of four neurons, which can be represented as 
• The second layer is the hidden layer, which has 100 neurons that can be referred as 
• Similarly, the output layer of our neural network architecture consists of five neurons, which determine the output classes  with respect to the input data.
Here, the connection between every neuron pairs is associated with a weight factor, which takes a random value between -10 to 10. The structure of the proposed GSO-LM neural network algorithm is shown as below (Figure 2).

Figure 2: Neural network structure.
While training the neural network, the weights are modified at successive iterations based on the input and output data. So the total number of weights assigned in our network is 1005.
Fitness (Activation) function
Evaluate the fitness value of each solution and then calculate the best solution values.
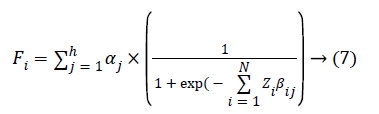
Where, Fi is a fitness function α and β are weights, A is the input parameters, i is the number of inputs; j is the number of weights and h is the number of hidden neurons. The initial stage of our proposed system is to train the LM algorithm based neural network in hidden layer by updating the weights in order to obtain the best solution.
Levenberg-Marquardt (LM) training algorithm
i. Initialize the input weights
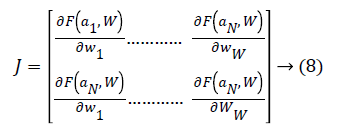
ii. Determine the Jacobian matrix J for the input matrix in LM algorithm.
iii. Evaluate the error gradient G (fitness) from LM algorithm in neural network.
iv. The weight update vector δof Hessian matrix is calculated as
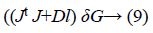
Here D is the Levenberg’s damping factor and δ is the weight update vector used to determine the updated weight. These best weights obtained are again given as input to the neural network for training based on LM algorithm. The obtained best weights BWN are given as input to the GSO algorithm for further processing.
Group search optimization (GSO)
GSO is a population-based optimizer algorithm consists of three members in a group. It split into a producer, scrounger, and ranger [17]. Initially, best weights are determined for each member of the group. Based on the fitness value of GSO algorithm, select the best fitness as the producers, the members of the group of best weights except for producer as scroungers and the remaining members are rangers.
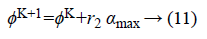
Producer performance: The maximum pursuit angle and the maximum pursuit distance is lmax. At Kth iteration, the producer randomly scans in three directions, namely zero degrees, right-hand side hypercube and left-hand side hypercube. At zero degree direction.
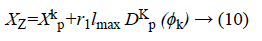
Similarly, right-hand side and left-hand side hypercube are evaluated. Where r1 is the normally distributed number and r2 is the distributed random sequence in the range between 0 and 1.
Scrounging performance: The producer finds the best point by calculating the fitness value, the current point is changed and the new angle is generated by using the following formula, otherwise, the current point is changed and the new angle is generated by using the following formula.
Where αmax denotes the maximum turning angle. If the producer cannot find a better resource than the current position after ath iteration, then the algorithm performs the scrounging operation, which selects 80% of the rest of members randomly.
Ranger performance: The next of the GS algorithm is ranging strategy of moving to the new point which is,
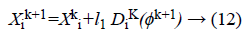
Finally, the best-updated weights are obtained after n number of iterations through GSO algorithm and given as input to the neural network for training. Further, two best groups of weights are obtained through the LM algorithm and the GSO algorithm in a single iteration.
Figure 3 shows the flow diagram of the proposed GSO-LM algorithm. Consequently, we compare the obtained two best groups of weights to determine a new best weight. The determined new best weight is again applied to both the LM algorithm and GSO algorithm to determine the new updated best weights to train the neural network. This process is repeated up to n number of iterations. This classifier classifies the data as healthy and non-healthy with the high optimal rate.

Figure 3: Flow diagram for GSO-LM algorithm.
Results and Discussion
In this section, the results are discussed and analysed. We have implemented the proposed method using MATLAB having 6 GB RAM and 2.6 GHz Intel i-7 processor. In this section evaluated the performance of the proposed model compared with existing methodologies [28,29].
Dataset description
Here we used three different kinds of datasets given in the UCI machine learning repository which is, Cleveland, Hungarian and Switzerland dataset. The description of three kinds of the dataset is given below [17].
i) Cleveland data: All available tests corresponding to the use of 14 of the 76 attributes get packed in the processed Cleveland heart disease database. It has 303 data instances and 14 attributes class distributions reveal 54% heart disease absent, 46% heart disease present.
ii) Hungarian data: It has 294 data instances and 14 attributes. Class distributions revelations are 62.5% heart disease absent and 37.5% heart disease present.
iii) Switzerland data: It has 123 data instances and 14 attributes. Class distributions indicate 6.5% heart disease absent and 93.5% heart disease present.
Performance evaluation
To evaluate the performance of this heart disease prediction system, we used the evaluation metrics are, a) accuracy, b) sensitivity and c) specificity.
Accuracy: Accuracy means the probability that our proposed system can correctly predict positive and negative examples. The accuracy of this system is obtained by the following expression.
Accuracy=TP+TN/TP+TN+FP+FN → (13)
Sensitivity: Sensitivity means the probability that the algorithms can correctly predict positive instances.
Sensitivity (S)=TP/TP+FN → (14)
Specificity: Specificity means the probability that the algorithms can correctly predict negative instances
Specificity (S)=TN/TN+FP → (15)
Where TP indicates true positive, TN indicates true negative, FP indicates false positive and FN indicates a false negative.
Comparative analysis
Here, the accuracy, specificity, and sensitivity of the proposed GSO-LM algorithm and the existing method are noted based on K-fold cross-validation. Here we used three UCI machine learning heart disease dataset for training and testing. The three datasets are Cleveland, Hungarian and Switzerland dataset and the accuracy sensitivity and specificity for these datasets are noted using k-fold cross-validation.
Figures 4-6 show the accuracy, specificity, and sensitivity comparative analysis based on three databases. The performance metrics are compared with NN, NN with LM, and NN with LM and GSO. For the comparison of all the three techniques, NN with LM and GSO reaches the optimal value compared to other two.

Figure 4: Accuracy comparison.

Figure 5: Specificity comparison.

Figure 6: Sensitivity comparison.
Figure 7 depicts the performance metrics for the proposed model (NN with LM-GSO). The performance metrics are shown for three datasets. In the Cleveland dataset, accuracy reaches 93%, sensitivity achieves nearly 80, and specificity attains 98%. Similarly, other two databases are also achieved the optimal result in the proposed model.

Figure 7: Performance metrics for the proposed method.
From the above Table 1, performance measures of Cleveland dataset, Hungarian and Switzerland dataset for each k-fold cross validation is illustrated. From that, the accuracy, sensitivity, and specificity are noted for the proposed model (NN+LM with GSO). The result obtained by the proposed method is better than the existing method.
| K-fold cross-validation | Cleveland dataset | Hungarian dataset | Switzerland dataset | ||||||
|---|---|---|---|---|---|---|---|---|---|
| Accuracy | Sensitivity | Specificity | Accuracy | Sensitivity | Specificity | Accuracy | Sensitivity | Specificity | |
| K=2 | 0.89 | 0.76 | 0.65 | 0.72 | 0.6 | 0.85 | 0.98 | 0.85 | 0.85 |
| K=4 | 0.75 | 0.57 | 0.57 | 0.64 | 0.68 | 0.75 | 0.95 | 0.91 | 0.81 |
| K=6 | 0.65 | 0.73 | 0.46 | 0.69 | 0.63 | 0.92 | 0.93 | 0.84 | 0.79 |
| K=8 | 0.69 | 0.68 | 0.71 | 0.74 | 0.79 | 0.96 | 0.9 | 0.75 | 0.69 |
| K=10 | 0.94 | 0.87 | 0.82 | 0.98 | 0.75 | 0.87 | 0.87 | 0.78 | 0.62 |
Table 1: Accuracy, sensitivity, and specificity obtained for Cleveland dataset.
Figures 8 and 9 shows the comparison graph for three databases with classifier and dimension reduction techniques in literatures. In the graph depicts the accuracy value for the proposed model ad existing model. The proposed model gives the accuracy as above 80% but the existing model reaches the low value. For this comparison proposed approach reaches the optimal result. These models can predict the heart diseases with high accuracy rate.

Figure 8: Comparison for dimensionally reduction technique.

Figure 9: Comparison graph.
Conclusion and Future Work
In this paper planned a heart disease prediction system by orthogonal Local Preserving projection and hybrid classifier. In the hybrid classifier, group search optimizer algorithm was associated with Levenberg-Marquardt Training algorithm in the neural network. The best weight acquired from LM algorithm was associated with GSO algorithm. The proposed LM algorithm based neural network was prepared under n number of iterations and another best weight was acquired which improved the classification accuracy. The result concluded that the performance measures such as accuracy, sensitivity, and specificity achieve optimal value in GSO-LM algorithm while compared to existing approaches. The proposed method minimizes the error and predicts the heart disease with high accuracy. In future consider real-time heart diseases database from healthcare industry by different classifiers like Support Vector Machine (SVM) and inspired optimization techniques. To improve the classification accuracy and to build a model that can predict heart disease.
References
- Nguyen CL, Phayung M, Herwig U. A highly accurate firefly based algorithm for heart disease prediction. J Exp Sys Appl 2015; 1-11.
- Yosawin K, Chanin N, Tanawut T, Thanakorn N. Data mining of magneto cardiograms for prediction of ischemic heart disease. J EXCLI 2010; 9: 82-95.
- Jae-Kwon K, Jong-Sik L, Dong-Kyun P, Yong-Soo L, Young-Ho L, Eun-Young J. Adaptive mining prediction model for content recommendation to coronary heart disease patients. J Clust Comp 2013; 1-11.
- Shamsher BP, Pramod KYS. Predict the diagnosis of heart disease patients using classification mining techniques. J Agr Veter Sci 2013; 4: 61-64.
- Srinivas RRG. Rough-fuzzy classifier: a system to predict the heart disease by blending two different set theories. J Sci Eng 2014; 39: 2857-2868.
- Hui Y, Jonathan G. A hybrid model for automatic identification of risk factors for heart disease. J Biomed Info 2015; 1-12.
- Aditya S, Pushpa L, Rama C. Performance analysis of classification data mining techniques over heart disease data base. J Eng Sci Adv Technol 2012; 2: 470-478.
- Chunlong H, Liyu G, Tianjiang W, Qi F. Effective human age estimation using a two-stage approach based on Lie Algebrized Gaussians feature. J Multimed Tools Appl 2015; 1-21.
- Haifeng H. Orthogonal neighborhood preserving discriminant analysis for face recognition. J Patt Recogn 2008; 41: 2045-2054.
- Chuang S, Zhousuo Z, Zhengjia H, Zhongjie S, and Binqiang C. Manifold learning-based subspace distance for machinery damage assessment. J Mech Sys Sig Proc 2016; 71: 637-649.
- Zhihui L, Minghua W, Zhong J, Jian Y. Sparse two-dimensional local discriminant projections for feature extraction. J Neurocomp 2011; 74: 629-637.
- Weiming S, Xuemin T, Ping W. Supervised local and non-local structure preserving projections with application to just-in-time learning for adaptive soft sensor. J Chem Eng 2015; 23: 1925-1934.
- Lijia L, Shiyi B, Jianfeng M, Di T. Nonlinear process monitoring based on kernel global-local preserving projections. J Proc Control 2016; 38: 11-21.
- Tingjin L, Chenping H, Dongyun Y, Jun Z. Discriminative orthogonal elastic preserving projections for classification. J Neurocomp 2015; 1-15.
- Yongzhou L, Dayong L, Shaoqiang L. Orthogonal discriminant linear local tangent space alignment for face recognition. J Neurocomp 2009; 72: 1319-1323.
- Hai S, Yunlong Z, Ben WN. An improved group search optimizer for mechanical design optimization problems. J Prog Nat Sci 2009; 19: 91-97.
- He W, Saunders Group. Search optimizer: an optimization algorithm inspired by animal searching behavior. J IEEE Trans Evolut Comp 2009; 13: 973-990.
- Vahid K, Gholam AM. A fuzzy-evidential hybrid inference engine for coronary heart disease risk assessment. J Exp Sys Appl 2010; 37: 8536-8542.
- Poornima G. Hybrid classifier and orthogonal local preserving projection for heart disease prediction. J Appl Eng Res 2015; 10: 35470-35480.
- Feng L, Jiaxu W, Baoping T, Daqing T. Life grade recognition method based on supervised uncorrelated orthogonal locality preserving projection and K-nearest neighbor classifier. J Neurocomp 2014; 138: 271-282.
- Chitra S. Heart disease prediction system using supervised learning classifier. J Software Eng Soft Comp 2013; 3: 1-7.
- Qi K, Tian L, Yong Y, Lei W, Qidi W. Group search optimizer based optimal location and capacity of distributed generations. J Neurocomp 2012; 78: 55-63.
- Kazem Z, Mehrdad TH, Elnaz D. Solving non-convex economic dispatch problem with valve point effects using modified group search optimizer method. J Electric Power Sys Res 2012; 84: 83-89.
- Anooj A. Clinical decision support system: risk level prediction of heart disease using weighted fuzzy rules. J King Saud Univ Comp Info Sci 2012; 24: 27-40.
- Rashedi E, Hossein NP, Saeid S.GSA: a gravitational search algorithm. J Info Sci 2009; 179: 2232-2248.
- Vijay KA. Face Hallucination using OLPP and kernel ridge regression. Proc IEEE Int Conf Image Proc 2008; 353-356.
- Gill MW. The Levenberg-Marquardt method, §4.7.3 in practical optimization. London: Academic Press 1981; 136-137.
- Babu M, Ramaraj N, Rajagopalan SP. Heart diseases data classification using group search optimisation with artificial neural network approach. Int J Bus Intel Data Mining 2017; 12: 257-273.
- Datasets from (http: //archive.ics.uci.edu/ml/datasets.html)