ISSN: 0970-938X (Print) | 0976-1683 (Electronic)
Biomedical Research
An International Journal of Medical Sciences
Research Article - Biomedical Research (2018) Volume 29, Issue 15
A Markov model to estimate mortality due to HIV/AIDS using CD4 cell counts based states and viral load: a principal component analysis approach
Delson Chikobvu and Claris Shoko*
Department of Mathematical Statistics and Actuarial Sciences, University of the Free State, Box 339, Bloemfontein (9300), South Africa
- *Corresponding Author:
- Claris Shoko
Department of Mathematical Statistics and Actuarial Sciences
University of the Free State, South Africa
Accepted date: July 30, 2018
DOI: 10.4066/biomedicalresearch.29-18-889
Visit for more related articles at Biomedical ResearchBackground: Improvement of health in HIV/AIDS patients on Highly Active Antiretroviral Therapy (HAART) is characterised by an increase in CD4 cell counts and a decrease in viral load to undetectable levels. In modelling HIV/AIDS progression in patients, researchers mostly deal with either viral load only or CD4 cell counts only as they expect these two variables to be collinear.
Methods: In this study, a cohort of 320 HIV/AIDS patients under HAART follow-up from a wellness clinic in Bela-Bela, South Africa is used. A time homogeneous Markov model is developed to explain and predict probability of death from HIV/AIDS. Principal component variables are created by fitting a regression model of viral load on CD4 cell counts.
Results: Inclusion of a viral load principal component improves the efficiency of the model. The new viral load covariate helps to explain the component of mortality/transition, which could not be explained by the CD4 cell counts alone. CD4 cell counts are categorised to define the states for the Markov model. Results show that the expected percentage prevalence gives almost a perfect fit of the observed data.
Conclusion: The orthogonal viral load covariate along with CD4 baseline, gender, non-adherence to treatment and age in years (y) variables play a significant role in modelling HIV/AIDS progression based on both CD4 cell counts and viral load monitoring.
Keywords
Principal component analysis, HIV progression, Continuous-time Markov model, Orthogonal covariate, Antiretroviral therapy
Introduction
The development of Highly Active Antiretroviral Therapy (HAART) has substantially reduced the death rate from HIV [1]. HAART reduces viral load of circulating HIV by blocking replication at multiple points in the virus life cycle [2] resulting in an increase in CD4 cell counts and increased life expectancy of individuals infected with HIV. This has made CD4 cell counts and viral load counts the fundamental laboratory markers regularly used for patient management [3] in addition to predicting HIV/AIDS disease progression or treatment outcomes [4].
However, although the primary predictor of HIV transmission is the HIV viral load, very few HIV modelling studies include a detailed description of the dynamics of HIV viral load along stages of HIV diseases progression [5,6]. This could be due to the unavailability of data on viral load, particularly from low and middle income countries that have historically relied on monitoring CD4 cell counts for patients on HAART because of higher costs of viral load testing [7]. However, sometimes both CD4 cell counts and viral load information is available.
Estill et al. [8] investigated the benefits of viral load count routine monitoring for reducing HIV transmission. They developed a stochastic mathematical model representing 1000 simulations for both CD4 and viral load routine monitoring. Their findings revealed that viral load routine monitoring reduces both cohort viral load and transmissions by 31%.
Goshu et al. [9] used a semi-Markov process to model the progression of HIV/AIDS. They used five CD4 cell counts classified states. They found out that transition probabilities from a given state to the next worse state increase with time, get to an optimum level at a given time and then decrease with increasing time. In a recent research Osisiogu et al. [10] also used the same states as Goshu et al. [9]. However, they used a non-stationary Markov chain approach. They examined a cohort from Nnamdi Azikiwe University Teaching Hospital with a follow-up in their CD4 cell counts of the HIV/AIDS patients. Their main finding was that low CD4 cell counts do not generally imply faster rates of patient absorption but rather the age of the patient is a relevant factor.
Lee et al. [11] investigated the most vulnerable racial minority races (African Americans) in the United States and the Caucasians in order to predict the trends of the HIV/AIDS epidemic using a Markov chain analysis. They predicted from these races, the number of people living with HIV, and mortality count due to HIV/AIDS. They observed a stable number of deaths over the years in both races.
Gover et al. [12] assessed the effects of antiretroviral therapy on 580 AIDS patients from an ART centre in New Delhi. They used a 5-stage multistate Markov model to estimate transition intensities and transition probabilities. The states of their model were CD4 cell count based as follows; state 1 (>500), state 2 (351 to 500), state 3 (200 to 350), state 4 (<200) and state 5 (death). They further examined the effects of covariates; age, gender and mode of transmission on transition intensities using Cox proportional hazards model.
Shoko et al. [13] used a continuous time-homogeneous Markov model to analyse the effects of reaction to treatment, TB coinfection, age and gender on transmission intensities. Their model was CD4 cell counts based followed by the death state and withdrawal state.
In this study, a continuous time homogeneous Markov process is used to model the progression of HIV/AIDS patients. We classify the states by the level of sickness based on four CD4 cell counts classifications measured in cells/mm3 followed by the end point, death. More importantly, among the determinants of HIV/AIDS, both the viral load counts and CD4 cell counts are included in the same model, thus making this research different from previous studies. The viral load count covariate was included and effects of collinearity with CD4 cell count are corrected using the principal component approach. In addition to that, effects of non-adherence to treatment on transition intensities are assessed. Transitions between the CD4 cell counts states is considered to be bidirection using data recorded from a cohort of 320 HIV+ patients at a wellness clinic in Bela Bela, South Africa.
Continuous-time Markov processes
A stochastic process {X(t),t ϵ [0, ∞)} defined on a finite state space C={1,2,…,c} where X (t) represents the disease state of a patient at time t represents a Markov process if ∀ s, t ≥ 0 and for every i, j ϵ C.

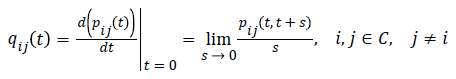
Implying that a Markov process is memory less, that is, the future transitions depend on the entire history only through the present state. Thus, the previous states once occupied by an individual do not matter. These transitions are described using the transition probabilities (pij (t)), transition intensities (qij), from state i to state j. The functions pij (t) are continuously differentiable and are subject to the initial condition:
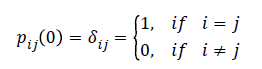
Where δij is a kronecker delta, pij (0)=1, i=j means the patient’s state definitely does not change when no time elapses and pij (0)=0, i ≠ j means that when no time elapses we are sure that the patient’s state cannot change with certainty. The transition intensity is defined as;
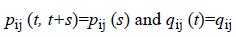
and 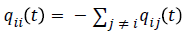 for each i ϵ C. In this study, transition probabilities depend only on the elapsed time and not on the chronological time. Thus, the Markov process is time-homogeneous, implying that
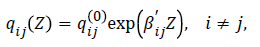
The effect of the above explanatory variables (covariates) on the transition intensities is modelled using the proportional intensities:
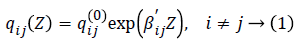
Where Z is a k-dimensional vector of explanatory variables, βij is a vector of k regression parameters relating the instantaneous rate of transitions from state i to state j to the covariates Z, and qij (0) is the baseline transition intensities with covariates set to their means.
Data description
The model is initially applied on 320 HIV positive patients on Highly Active Anti-Retroviral Therapy (HAART) from a Wellness clinic in Bela Bela, South Africa, from year 2005 to year 2009. 224 of these patients were females and 96 were males at treatment commencement (t=0). About 50% and 65% of the female and male deaths respectively occurred during the first 6 months of treatment uptake. The interquartile range of patient ages is (33 y; 48 y) with mean and median ages of 40.62 y and 41 y respectively. The ages were negatively skewed (skew=-0.08) since there were younger patients than older patients in this cohort. At time (t=0) there were 242 individuals with CD4 baseline (CD4BL) cell counts below 200, 59 individuals with CD4 cell counts between 200 and 350, 11 individuals with CD4 cell counts between 350 and 500, 6 individuals with CD4 cell counts between 500 and 750 and 1 individual with CD4 cell count above 750. At (t=0) the CD4 cell counts had mean of 156 cells/mm3, a median of 116 cell/mm3 and the maximum CD4 cell counts was 1202 cells/mm3. The mean Viral Load Count Baseline (VLBL) for these patients was 105573.35 copies/mm3 and it ranged from 56 to 818600 copies/mm3. The median viral load was 58523.00 copies/mm3. From these individuals 155 had a WHO stage baseline (WSBL) of 4 which is related to severe HIV symptoms. WSBL is the categorisation of HIV/AIDS at baseline basing on the clinical markers as defined by World Health Organisation (WHO).
Statistical analysis
Principal component analysis: Principal component analysis is a technique used to combine highly correlated factors into principal components that are much less correlated with each other. This improves the efficiency of the model.
In this study, the predictive power of CD4 cell counts (I1) and viral load (I2) is explored. Two new, uncorrelated factors, I1* and I2*, can be constructed as follows:

Then, we carry out a linear regression analysis to determine the parameters γ1 and γ2 in the equation:
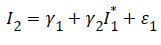
γ1 and γ2 are the intercept and slope parameters of the regression model respectively and ε1 is the ‘error’ term or residual, which by definition is independent of I1*=I1.
We then set:
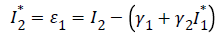
By construction I2* is uncorrelated with the viral load values (I2) since I2*=ε1 is the residual term in the equation. I2* in the model explains the component of mortality that cannot be explained by the CD4 cell counts alone (or in the absence of viral load counts). To deal with multi-collinearity of viral load count and CD4 cell count, the orthogonal viral load covariate (residuals) are used. This is done by regressing viral load count on CD4 cell count and doing the classification below. The residuals from the fitted model are included with the original HIV data to form the new orthogonal covariate, orthogonal viral load (residuals) (VLR). These residuals are coded as; “1” for negative residuals and “0” for positive residuals. A continuous-time Markov model for the effects of age, non-adherence (NA), CD4 baseline (CD4BL), and orthogonal viral load (I2*) on HIV progression based on CD4 cell counts is fitted using the “msm” package for multistate modelling in R. The results are presented in the next section.
The variables in the model are then defined as follows:
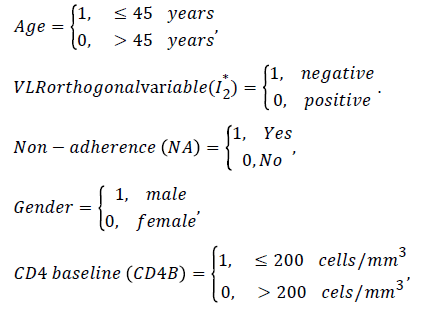
Model formulation
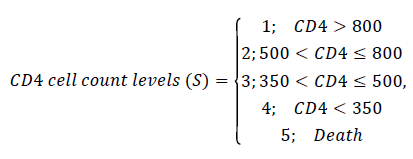
Consider a stochastic process {X(t), t ϵ [0,5) years} defined on a finite state space C=(1,2,3,4,5) based on CD4 cell counts as defined above. X (t) represents the CD4 state of an HIV/AIDS patient at time t. This process represents a Markov process if ∀ s, t ≥ 0 and for every i, j ϵ C.

The above equation implies that a Markov process is memory less, that is, the future transitions depend on the entire history only through the present state. Formulation of the model is based on the assumption that at (t=0), an HIV infected individual enters the study with an HIV state defined by CD4 cell counts levels. As the patient initiates treatment therapy, the patient is either in states 1-3 or 4 and these states are mutually exclusive. At time Δt the patient in state i is expected to either maintain his state (i=1,2,3,4), transition to state of better CD4 cell counts (i-1, I ≠ 1) (or remain at the lowest state) or transit to a state of lower CD4 cell counts (i+1, i=1,2,3,4) (or remain at the highest state). These possible transitions are based on the assumption that not all patients initiated into HAART recover their CD4 cell counts levels. Some may fail to achieve their normal CD4 cell counts levels due to non-adherence, effect of age as younger patients may not adhere and also due to the effect of gender since the assumption is males have busy schedules. However, those who adhere to HAART respond well to treatment. Hence the bi-directional model proposed in Figure 1 below.

Figure 1: Diagraph for HIV progression defined by CD4 cell count states followed by the end point, death. a) States 1-4 are transient and there is a possibility of marinating the same state in 2 or more consecutive visits. b) State 5 is the absorbing state.
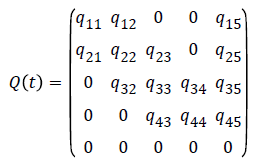
The model in Figure 1 is described by a transition intensity matrix Q=qij;
The effect of the above explanatory variables on the transition intensities is modelled using the proportional intensities:
Where Z is a k=5-dimensional vector of explanatory variables “CD4BL, gender, age, non-adherence (NA), orthogonal viral load (“I2*”).” Thus, the transition intensity for a patient h in this study is given by the model:
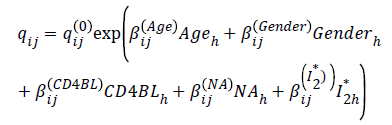
For this model qij(0) are the baseline transition intensities that refer to a patient with age category 0 (over 45-y-old), gender=0 (female), CD4BL=0 (above 200 cells/mm3, Adherent to treatment and positive I2*, βij is a regression parameter relating the instantaneous rate of transitions from state i to state j to the covariate Z. The transition intensities, qij, are presented in rates per year. qij are the elements of a 5 × 5 transition intensity matrix Q from a continuous time-homogeneous Markov process.
An important aspect is the inclusion of both CD4BLh and I2* (the orthogonal viral load covariate) derived after curing for collinearity.
Assessment of the fitted models: Based on Equation (1) two nested models are fitted, one of the models excludes the effect of the orthogonal viral load and the other includes all covariates including the orthogonal viral load. These models are compared using their Akaike information criteria (AICs) defined as:
where -2 × Log (likelihood) represents the bias, 2k represents the variance and k is the number of estimated parameters in the fitted model. The model with the minimum AIC is considered as the better model. Further assessment of the fitted nested models is done using the likelihood ratio test (LRT). The value of the LRT=-2loge ((Ls (θ))/(Lf θ)), where Ls (θ ̂) is the simple model (no viral load orthogonal in the model) and Lf (θ ̂) is the full model (with the orthogonal viral load covariate in the model).
Results
In this section, the combination effect of viral load and CD4 cell counts in the progression of HIV in patients on treatment is analysed. This is done by first fitting a time-homogeneous Markov model for the effects of the covariates; CD4 cell count baseline (CD4BL), Gender, Age and non-adherence to treatment (NA) on HIV/AIDS progression based on CD4 cell count states. Notable is the exclusion of the viral load count covariate in this model. Secondly, a time-homogeneous Markov model for the effects of covariates; CD4 cell count baseline (CD4BL), gender, age, non-adherence to treatment (NA) and the orthogonal viral load covariate is then included in the model. Comparison of these two models is based on their -2 × log (likelihood), Akaike Information Criteria (AIC), likelihood ratio tests and also the percentage prevalence plots. The results are shown in the following subsections.
CD4 cell counts model and other variables excluding viral load: In this subsection we fit a continuous-time homogeneous Markov model for the effects of non-adherence (NA), CD4 baseline (CD4BL), age and gender on the progression of HIV defined by the CD4 cell counts states as defined in the model below:
where Z=(CD4BL, gender, age, NA) is a k=4-dimensional vector of covariates and βij is a vector of k regression parameters relating the instantaneous rate of transitions from state i to state j to the covariates Z and baseline intensities qij(0) relating to the baseline transition from state i to state j. These states are defined by CD4 cell count and an absorbing state, death. The results are shown in Table 1 below.
| State i-j | Baseline (qij(0)) | NA | CD4BL | Age | Gender |
|---|---|---|---|---|---|
| State 2-1 | 0.561 (0.410, 0.7677)* | 0.786 (0.0081, 1.57)* | -0.411 (-0.938, 0.116) | 0.37 (-0.51, 1.25) | 0.106 (-0.51, 0.72) |
| State 1-2 | 0.751 (0.486, 1.159)* | 0.145 (-1.29, 1.003) | -0.491 (-1.232, 0.25) | -1.309 (-2.57, -0.05)* | -0.0618 (-0.94, 0.817) |
| State 3-2 | 1.27 (1.048, 1.537)* | 0.0501 (-0.74, 0.84) | -0.613 (-0.99, -0.23)* | 0.277 (-0.15, 0.71) | 0.117 (-0.30, 0.54) |
| State 2-3 | 0.711 (0.526, 0.964)* | 0.757 (-0.42, 1.94) | -0.0338 (-0.71, 0.64) | 0.188 (-0.92, 0.55) | 0.737 (0.084, 1.39)* |
| State 4-3 | 0.798 (0.686, 0.929) [8] | 0.389 (-0.92, 0.15) | -1.329 (-1.67, -0.99)* | 0.0508 (-0.277, 0.38) | -0.463 (-0.79, -0.13)* |
| State 3-4 | 0.691 (0.528, 0.906)* | 0.751 (-0.049, 1.55) | -0.522 (-1.15, 0.11) | 0.0671 (-0.51, 0.65) | 0.516 (-1.13, 0.09) |
| State 1-5 | 0.0005 (0.000006, 4696) | 0.058 (-39.9, 39.75) | 0.621 (-42.3, 43.6) | -0.607 (-36.1, 34.85) | 0.714 (-42.2, 43.6) |
| State 2-5 | 0.00492 (0.00007, 0.330)* | 1.629 (-14.36, 11.1) | 0.0683 (-2.93, 3.07) | 3.702 (-9.11, 16.51) | 1.509 (-1.48, 4.50) |
| State 3-5 | 0.00036 (0.000005, 2.44)* | 4.48 (-4.15, 13.11) | 2.878 (-8.16, 13.9) | 2.39 (-9.12, 13.90) | -3.194 (-14.1, 7.7) |
| State 4-5 | 0.0010 (0.00004, 0.276)* | 3.35 (-16.4, 9.67) | 3.164 (-9.80, 16.1) | -2.065 (-4.31, 0.181) | -5.271 (-18.3, 7.78) |
| -2log-likelihood: 2646.165; *significant. | |||||
Table 1: Estimated parameters (with 95% confidence intervals in brackets) for the time homogeneous model that excludes the effects of viral loads.
From Table 1, the first column represents possible transitions from state i to state j, where i=1,..,4 and j=1,..,5. The second column represents the baseline transition intensities (with confidence intervals), the third column gives coefficients (with confidence intervals) to represents the effects of non-adherence to treatment, the fourth column gives coefficients (with confidence intervals) to represent the effects of having a CD4 baseline above 200 copies/mm3 to HIV progression, the fifth column gives coefficients (with confidence intervals) to represent the effects of having age below 45 years and lastly the sixth column gives coefficients (with confidence intervals) to represent the effects of gender to HIV progression. The results are as follows:
In Table 1 (model that excludes the viral load count), results from the baseline transition intensities show that patients in state 1 (CD4 cell counts above 800 cells/mm3) are 1502 times more likely to experience immune deterioration to state 2 than being absorbed into the death state. When CD4 cell counts are below 500 cells/mm3 (states 3 and 4), transitions to better states are more likely to occur than transitions to worse states. However, when CD4 cell counts are above 500 cells/mm3 the rates of immune deterioration are higher than the rates of immune recovery.
For patients who experienced non-adherence to treatment, transitions from state 2 to state 1, state 3 to state 4, state 3 to state 2 and state 4 to state 3 estimates are relatively precise as shown by the narrower confidence intervals. The only transition that is significant, is from state 2 to state 1. This is shown by the confidence interval that is narrower (zero excluded in the interval) compared to the other transitions. For these non-adherent patient, there is a significant increase on the rate of immune recovery from state 2 to state 1. Although not significant, there is an increase in immune deterioration from state 3 to state 4 and reduction on the rate of immune recovery from state 4.
For the age variable, transitions from state 2 to state 3, state 3 to state 2, state 3 to state 4 and state 4 to state 3 estimates are relatively precise as revealed by the smaller confidence intervals. The only transition that is significant (zero excluded in the interval) is from state 2 to state 1. The results show a significant reduction in immune deterioration once a normal CD4 cell counts above 800 cell/mm3 (state 1) are achieved for the younger patients aged 45 years and below. These younger patients experience reduced immune deterioration from state 2 to state 3 and increased immune deterioration from state 3 to state 4 although these transitions are not statistically significant.
For the other variables, gender and CD4 baseline, all the estimated transitions between live states estimates are relatively precise since they have narrow confidence intervals. However, for CD4 baseline, only transitions from state 3 to state 2 and from state 4 to state 3 are significant (zero excluded in the interval). These transitions show a significant reduction in immune deterioration. Males experienced significantly increased immune deterioration from state 2 to state 3 compared to their female counterparts. They also experience a significant reduction in immune recovery from state 4 to state 3.
Overall, the fitted model shows relatively wider confidence intervals for the transitions to the death state.
The expected and observed percentage prevalence in each CD4 cell count state and the death state are shown in Figure 2 below.

Figure 2: Observed and expected percentage prevalence in each state for the model with CD4 states without viral load orthogonal. The expected model slightly underestimate motel after 3 years.
Results from Figure 2 show that the expected percentage prevalence give almost a perfect fit of the observed percentage prevalence for state 1 and state 5 (death) up to 3 years. Thereafter deaths are slightly underestimated and state 1 prevalence’s are slightly overestimated. In the first 2 years observed percentage prevalence in state 2 and 3 are slightly overestimated by the expected percentage prevalence. Percentage prevalence in state 4 are slightly underestimated in the first 2 years and slightly overestimated thereafter by the fitted model.
CD4 model for the viral load principal component: since the variables CD4 cell count and viral load are expected to be collinear, orthogonality between these variables is achieved by regressing viral load on CD4 cell count as shown in Table 2 below.
| Estimate | Std. error | t value | Pr(>|t|) | ||
|---|---|---|---|---|---|
| γ1 intercept) | 55166.91 | 3136.54 | 17.59 | <2e-16 | *** |
| γ2 slope | -70.963 | 6.207 | -11.43 | <2e-16 | *** |
| Multiple R-squared: 0.06015; F-statistic: 130.7 on 1 and 2042 DF, p-value<2.2e-16 | |||||
Table 2: Regression of viral load on CD4 cell counts.
The results show a highly significant regression line suggesting correlation between viral load and CD4 cell count as indicated by a p-value below 2.2e-16. The residuals from the regression model are then taken to represent another viral load covariate, which is orthogonal to the CD4 cell count covariate. The orthogonal viral load covariate is coded as follows.
The orthogonal viral load covariate and other variables; age, non-adherence, gender and CD4 baseline are then used as covariates for the continuous-time Markov model with states defined by CD4 cell count. The results are shown in Table 3 below.
| Baseline | NA | CD4BL | Age | Gender | I2* | |
|---|---|---|---|---|---|---|
| State 2-1 | 0.545 (0.40, 0.74) | 0.765 (0.034,1.496)* | -0.28255 (-0.78,0.21) | 0.61259 (-0.146,1.37) | -0.03339 (-0.6273, 0.5605) | -1.17330 (-1.9536,-0.39301)* |
| State 1- 2 | 0.0401 (0.00004, 4242) | 0.1483 (-1.11922, 1.4159) | -0.51969 (-1.3044, 0.26501) | -1.32263 (-2.6596, 0.01434) | -0.08131 (-1.0383, 0.8757) | -4.01482 (-18.5900,10.56033) |
| State 3- 2 | 1.398 (1.135, 1.722) | 0.3269 (-0.60065,1.2544) | -0.54526 (-0.9359,-0.15463)* | 0.30917 (-0.1229, 0.74129) | 0.16951 (-0.2711, 0.6101) | -0.50199 (-1.0694, 0.06537) |
| State 2-3 | 0.669 (0.474, 0.943) | 1.1211 (-0.19695, 2.4392) | 0.03985 (-0.6460, 0.72567) | -0.08423 (-0.8219, 0.65347) | 0.87997 (0.2023, 1.5577)* | 0.70471 (-0.4375, 1.84694) |
| State 4-3 | 0.831 (0.710, 0.973) | -0.3759 (-0.94136,0.1896) | -1.40333 (-1.7733,-1.03333)* | 0.05320 (-0.2799, 0.38628) | -0.48246 (-0.8212,-0.1437)* | -0.07262 (-0.4884, 0.34321) |
| State 3-4 | 0.697 (0.478, 1.018) | 0.8527 (0.01718, 1.6883)* | -0.61048 (-1.2898, 0.06881) | 0.10324 (-0.4845, 0.69097) | -0.50671 (-1.1252, 0.1118) | 0.24935 (-1.3065, 1.80515) |
| State 1-5 | 0.00166 (0.00001, 17.1) | 4.3732 (-1.99613,10.7425) | 7.38286 (-9.1511,23.91685) | 2.64846 (-14.0315,19.32845) | -2.76023 (-21.6692,16.1487) | 7.96834 (-8.9552,24.89188) |
| State 2-5 | 0.0001 (0.00003, 131) | -1.7120 (-28.32334,24.8994) | -2.54389 (-18.2331,13.14536) | 2.06138 (-15.1219,19.24463) | 4.65693 (-8.0486,17.3625) | -5.06520 (-17.1554, 7.02498) |
| State 3-5 | 0.0001 (0.00003, 2768) | 1.7018 (-36.23359,39.6373) | 1.06855 (-45.1581,47.29522) | 0.37856 (-48.2596,49.01677) | -1.37134 (-48.1259,45.3832) | -1.09413 (-55.9253,53.73707) |
| State 4-5 | 0.0006 (0.00004, 1.05) | -3.9372 (-22.01985,14.1455) | 3.75843 (-13.5309,21.04776) | -2.06766 (-4.3237, 0.18839) | -5.76054 (-22.9616,11.4405) | -1.18026 (-2.9828, 0.62225) |
| -2Log-likelihood: 2554.25; *significant | ||||||
Table 3: Parameter effects (with 95% confidence intervals) of age, CD4 baseline, non-adherence, gender and viral load residuals on the transition intensities for the CD4 based Markov model.
The results from Table 3 (model that includes the viral load count) show that for all the covariates the model gives more precise estimates (narrower confidence intervals) of parameters for transitions between live states than the model without the orthogonal viral load covariate (I2*). Just like the model without the orthogonal viral load, non-adherent patients experienced a significant increase in immune recovery from state 2 to state 1. In addition, there is a significant increase in immune deterioration from state 3 to state 4. Although not significant, the inclusion of the orthogonal viral load covariate results in non-adherence to treatment accelerating death from state 3 although the magnitude is lower than when the orthogonal viral load covariate is excluded.
The covariate age results in a more precise estimate of the transition from state 4 to state 5 compared to the other covariates except the orthogonal viral load. The results reveal a reduction of deaths from state 4 for patients aged 45 y and below. Though not significant, the results now show a reduction on immune deterioration from state 1 (CD4 state above 800 cells/mm3) and an increase on the rate of immune recovery from state 2 to state 1 for younger patients aged 45 y and below.
The results generally show a reduction in mortality in cases where the observed viral load is lower than the expected (i.e., negative orthogonal viral load count).
For patients who initiated therapy with a CD4 cell counts below 200 cells/mm3, the rates of immune recovery are reduced. There is a significant reduction in the rates of immune recovery from state 3 to state 2 and from state 4 to state 3.
The continuous-time homogeneous Markov model with the orthogonal viral load component has lower -2log-likelihood than that of the model that excludes the orthogonal viral load component. Next we plot percentage prevalence in each state for the fitted model.
Figure 3 above shows that if the orthogonal viral load covariate is included, the expected percentage prevalence gives a better estimate of the observed percentage prevalence for the mortality state (state 5), better than the Markov model in which the orthogonal viral load covariate is excluded.

Figure 3: Percentage prevalence for the continuous-time Markov model defined by CD4 cell count and the orthogonal variable, viral load, included. It shows an improvement in estimating mortality compared to the model without the orthogonal variable.
Assessment of the fitted models: In this section we further assess the fitted models by performing a likelihood ratio test and calculation of the Akaike Information Criteria (AIC) for each of the fitted model (Table 4).
| lrtest.msm (No orthogonal viral load covariate, with the orthogonal viral load covariate) | -2loLR | df | p |
| with viral load orthogonal | 91.91497 | 10 | 2.22E-15 |
| AIC (No viral load orthogonal)=2746.165; AIC (with viral load orthogonal)=2674.25 | |||
Table 4: Likelihood ratio test for the model with no viral load orthogonal and the model with viral load orthogonal.
A likelihood ratio test for the two nested models has shown that the model with the orthogonal viral load covariate fits the data significantly better than the model with no orthogonal viral load covariate. This is further confirmed by the estimated AICs which is lower for the model with the orthogonal viral load covariate than that of the model with no orthogonal viral load covariate.
Discussions
In this study, a time homogeneous Markov model based on CD4 cell count states is developed to explain and predict probability of death from HIV/AIDS. The model is improved by including an orthogonal viral load covariate derived from principal component analysis. Principal component analysis is a technique used to combine highly correlated factors into principal components that are much less correlated with each other. This improves the efficiency of the model. Principal component variables are created by fitting a regression model of viral load count on CD4 cell count. The new orthogonal covariate is included to represent the viral load covariate for the Markov model defined. This viral load covariate helped to explain a component of mortality/transition, which could not be explained by the CD4 cell count alone.
Results from the likelihood ratio test show that the model with the orthogonal viral load covariate fits significantly better than the model with exclusion of viral load. Thus, the orthogonal viral load covariate along with CD4 baseline, gender, non-adherence and age play a significant role in modelling HIV/ AIDS progression based on CD4 cell counts and viral load monitoring.
Results from the analysis show that when CD4 cell count is below 500 cells/mm3 rates of immune recovery are higher than rates of immune deterioration particularly for younger patients aged 45 y and below. However, when the CD4 cell counts are between 500 and 800 cells/mm3 the rate of immune deterioration is higher than the rate of immune recovery and this was mainly attributed to patients who were non-adherent to treatment and patients who initiated therapy with a CD4 baseline below 200 cell/mm3. Once the CD4 cell count is above 800 cells/mm3, the results show a possibility of immune deterioration, although the magnitude is very low, mainly due to non-adherent to treatment. This contradicts the finding from the previous study that was carried out in India which revealed higher rates of immune recovery than immune deterioration regardless of the HIV/AIDS state of the patient [12].
Progression to death is more pronounced on HIV/AIDS patients who are below the age of 45 y and with a CD4 cell count of 200 cells/mm3 at treatment initiation. Previous studies [12,13] also reported more pronounced risk of death for patients with CD4 baseline of 200 cells/mm3 which concurs with our findings. For this study, progression to death was also more pronounced from the CD4 cell count above 800 cells/mm3 for patients whose CD4 baseline was below 200 cells/mm3 and for patients who were non-adherent to treatment.
The results show that inclusion of the orthogonal viral load covariate results in a reduction in immune deterioration from state 1 (CD4 state above 800 cells/mm3) and an increase in the rate of immune recovery from state 2 to state 1 for younger patients aged 45 y and below. Generally younger patients experienced higher rates of immune recovery than immune deterioration compared to patients who are over 45 y and this concurs with findings from previous studies [14]. This is in agreement with previous study carried out in Tehran, India that showed that mean CD4 cell count increments after initiation of combination therapy are lower on older patients [15].
For patients whose viral load is lower than the expected given the CD4 cell count, there was a reduction in transition to deaths. This means that for given levels of CD4 cell count, the patients ought to have more viral load, but they have less resulting in reduction in mortality.
This study discovers the importance of using both CD4 cell count and viral load in the same model for monitoring progression of HIV/AIDS patients on antiretroviral therapy. By including both variables, the model has revealed that for given levels of CD4 cell count, there is the possibility of reduction of mortality for patients whose viral load is lower than expected given their CD4 count. Progression to death was more pronounced on patients who have achieved normal CD4 cell counts and this is experienced mainly in younger patients, nonadherent patients and also for patients whose initial CD4 cell counts were below 200 cells/mm3. This study will help the researcher to uncover the critical areas of dealing and correcting for collinearity when including both CD4 cell count and viral load in multistate modelling of HIV/AIDS that many researchers were not able to explore. Thus a new application of theory and better understanding of the Principal component approach when dealing with both CD4 and viral load (in the same model) to HIV/AIDS modelling may be arrived at.
Acknowledgements
This study would not have been a success without the assistance of the Microbiology Department at the University of Venda in providing the secondary data through Professor Pascal O. Bessong.
References
- Palella FJ, Delaney KM, Moorman AC, Loveless MO, Fuhrer J, Satten GA, Aschman DJ, Holmberg SD. Declining morbidity and mortality among patients with advanced human immunodeficiency virus infection. N Engl J Med 1998; 338: 853-860.
- Cole SR, Hernan MA, Anastos K, Jamieson BD, Robins JM. Determining the effects of highly active antiretroviral therapy on change in human immunodeficiency virus type 1 RNA viral load using a marginal structural left-censored mean model. Am J Epidemiol 2007; 166: 219-227.
- Mathieu E, Foucher Y, Dellamanica P, Doures JP. Parametric and non-homogeneous semi-Markov process for HIV control. Methodol Comput Appl Probab 2007; 9: 389-397.
- Hoffman RM, Black V, Technau K. Effects of highly active antiretroviral therapy duration and regimen on risk for mother-to-child transmission of HIV in Johannesburg, South Africa. J Acquir Immune Defic Syndr 2010; 54: 35-41.
- Case KK, Ghys PD, Gouws E, Eaton JW, Borquez A, Stover J. Understanding the modes of transmission model of new HIV infection and its use in prevention planning. Bull. World Health Organ 2012; 90: 831-838.
- Herbeck JT, Mittler JE, Gottlieb GS, Mullins JI. An HIV epidemic model based on viral load dynamics: value in assessing empirical trends in HIV virulence and community viral load. PLoS Comput Biol 2014; 10: 1003673.
- Lecher S, Williams J, Fonjungo PN. Progress with scale-up of HIV viral load monitoring-seven sub-Saharan African countries, January 2015-June 2016. Morbid Mortal Week Rep 2016; 65: 47.
- Estill J, Aubriere C, Egger M, Johnson L, Wood R. Viral load monitoring of antiretroviral therapy, cohort viral load and HIV transmission in Southern Africa: A mathematical modelling analysis. AIDS 2012; 26: 1403-1413.
- Goshu AT, Getahun D. Modeling progression of HIV/AIDS disease stages using semi-Markov processes. J Data Sci 2013; 11: 269-280.
- Osisiogu UA, Nwosu CA. A stochastic analysis of the absorption probabilities of CD4 cell counts of HIV/AIDS patients using the smoothed non-stationary Markov chain model: a case study of Anambra State. Eur J Stat Probab 2015; 3: 1-11.
- Lee S, Ko J, Tan X, Patel I, Balkrishnan R, Chang J. Markov chain modeling analysis of HIV/AIDS progression: a race-based forecast in the United States. J Ind Pharm Sci 2014; 76: 107-115.
- Gurprit G, Adesh Kumar G, Prafulla KS, Barnali D. A multistate Markov model based on CD4 cell count for HIV/AIDS patients on antiretroviral therapy (ART). Int J Stat Med Res 2013; 2: 144-151.
- Shoko C, Chikobvu D. Time-homogeneous Markov process for HIV/AIDS progression under a combination treatment therapy: cohort study, South Africa .Theor Biol Med Model 2018; 15: 3.
- Hogg RS, Yip B, Chan KJ, wood E. Rates of disease progression by baseline CD4 cell count and viral load after initiating triple-drug therapy. JAMA 2001; 286: 2568-2577.
- Hasibi M, Hajiabdolbaghi M, Hamzelom S, Sardashti S, Foroughi M, Jozani ZB, Alinaghi SAS. Impact of age on CD4 response to combination antiretroviral therapy: study in Tehran, Iran. World J AIDS 2014; 4: 156-160.