ISSN: 0970-938X (Print) | 0976-1683 (Electronic)
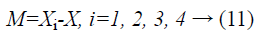
Biomedical Research
An International Journal of Medical Sciences
Research Article - Biomedical Research (2018) Volume 29, Issue 1
Liver cancer detection and classification based on optimum hierarchical feature fusion with PeSOA and PNN classifier
Department of Electronics and Communication Engineering, School of Electrical and Computing, VEL TECH University, Avadi, Chennai, India
- *Corresponding Author:
- Rajesh G
Research Scholar
School of Electrical and Computing
VEL TECH University, Chennai, India
Accepted date: December 12, 2016
DOI: 10.4066/biomedicalresearch.29-16-1320
Visit for more related articles at Biomedical ResearchDetection and segmentation of abnormalities present in the liver is one of the testing and vital steps to treatment planning which expands the survival of a patient. Liver cancer expands the death rate because the side effects cannot be distinguished even the cancer is in its advanced stage. The early diagnosis and consistent observing is the best way to control the development of the malignancy and to save the lives. Ultrasound imaging is a standout amongst the most frequently utilized diagnosis instruments to distinguish and classify irregularities of the liver which is also a non-invasive, safe technique for patient examination, being easy to apply, economical than the CT, MRI, PET based liver tumor detection. Traditional liver cancer detection strategies have high computation time and multifaceted nature. In order to diminish the complexity in the computational procedure and to enhance the diagnostic exactness in this paper we propose a new optimum hierarchical feature fusion based on Penguin Search Optimization Algorithm (PeSOA). The features resulting from PeSOA is used by a Probabilistic Neural Network (PNN) which classifies the liver cancer tissues. Test results demonstrate that the proposed technique acquires 98.92% classification accuracy and the correlation demonstrates that we obtained superior results than the existing strategies.
Keywords
Optimum hierarchical feature fusion, Despeckle filtering algorithm, DVW distance technique, Penguin search optimization algorithm, Probabilistic neural network.
Introduction
The liver is one of the biggest organs in the body, situated in the upper right portion of the stomach area. The liver has numerous imperative capacities, including clearing poisons from the blood, metabolizing drugs, produce blood proteins and bile which helps assimilation. However, there are a wide range of issues that can happen in the liver and some can cause permanent harm. These conditions incorporate virus infection, responses because of medications or liquor, tumors, genetic conditions and issues with the body's immune system [1]. Among them liver tumor is one of the most noteworthy reasons for death due to cancer. An exact detection and appropriate segmentation of liver tumor from CT image is of high essentialness particularly for early recognition and findings of disease [2]. The essential amount of blood reaching the liver with every pulse encourages the spread of metastatic tumors present in different organs into the liver and these tumors are known as secondary tumors. Besides, liver can create essential harmful tumor incorporates Hepatocellular Carcinoma (HCC) and Cholangiocellular Carcinoma (CCC) which are considered as the most vital sorts of carcinomas and cause a lot of death per year worldwide [3].
Since in the early phases of liver cancer, patients do not show signs or side effects, enhancing early diagnosis is vital in order to lessen horribleness and death rates [4]. Generally masses that happen in the liver can be resolved to be safe (kindhearted) or threatening (dangerous) in different ways [5]. The detection and segmentation of those unusual hepatic masses is critical to liver infection determination, treatment arranging and follow up observing. As a significant part of clinical practice in radiology, liver tumors are generally inspected and followed at regular intervals or months to survey the growth organizing and treatment reaction in view of 3D Computed Tomography (CT) information [6]. However, a large amount of CT images should be translated by radiologists for diagnosis, and such undertakings are tedious and time consuming. In order to conduct the task more productively, computer-aided examination is presented [7]. The Computer Aided Diagnosis (CAD) defeats the disadvantages resulting from the biopsy determination which is invasive and not prescribed once in a while [8].
Most cancer growth illustrate the seriousness through stages, Liver cancer tumor staging organizing as per the Barcelona Clinic Liver Cancer (BCLC) system framework depends on American Association for the Study of Liver Diseases (AASLD) rules for the clinical treatment of liver cancer. It evaluates the level of tumor invasion, liver function reserve, and execution status [9]. In the field of liver cancer identification CAD, the surface of the liver CT images, including gray co-occurrence matrix, gray level run length matrix and gray level angle co-occurrence matrix, was utilized to recognize two sorts of liver illness [10]. The determination of liver cancer for the most part happens in later stages in the disease when there is little successful treatment option and the prognosis for patients with Hepatocellular Carcinoma (HCC) stays extremely poor. In this manner in the liver cancer treatment domain, accurate selection of a customized treatment arrangement can be of basic significance for the patient's health or even survival [11]. Liver segmentation is one of the critical essential stages in computer aided techniques for liver disease’s analysis. Analysts have given a few strategies to liver segmentation. In any case, the liver segmentation is a complicated and testing process because of two reasons. Initially, the intensity value similarity (covering) between the liver and the adjacent organs like heart and kidney. Moreover, the segmentation is challenging due to the non-inflexible shape nature of the liver [12].
Diagnostic Ultrasound is a helpful clinical device for imagining organs and delicate tissues in human abdominal wall with no deteriorating impacts. It empowers the operators to select the right image plane to show neurotic life systems precisely. One such use of diagnostic ultrasound is liver imaging [13]. The ultrasonography is a non-intrusive, safe strategy for patient examination, being easy to apply, economical and having the probability of repeatability. Alternative methods, such as the Computer Tomography (CT), or the Magnetic Resonance Imaging (MRI) are considered irradiating or costly [14]. Characterization of Focal Liver Lesions (FLL) is the most important utilization of Contrast- Enhanced Ultrasound (CEUS) in Europe. A right differentiation between benign and malignant. FLL is a significant perspective for an exact diagnosis and proper therapeutic planning of liver cancer. This qualification and further portrayal may be guided by known Dynamic Vascular Patterns (DVP) of FLL as for encompassing healthy parenchyma [15].
To identify the liver cancer tissues a new methodology for the classification is illustrated in this paper. The Optimum Hierarchical Feature Fusion based on PSOA is proposed for location of liver cancer and the classification is done by PNN classifier. To remove the speckle present in the US image preprocessing is done before feature extraction and characterization. The rest of the paper is sorted as follows. Segment 2 portrays the related work of liver cancer detection and classification. In Section 3, depicts the optimum hierarchical feature fusion which can be utilized to distinguish the liver tissues then classify the liver tissues as typical tissues or harmful tissues. In Section 4, trial results for the proposed strategy are displayed. Finally we conclude with an audit of our contribution in Section 5.
Related Work
The recent works regarding liver tumor detection and classification are given below.
Jung et al. [16] have proposed another Fast Kernel Discriminant Analysis (FKDA) that is entirely quick in the calculation of optimal discriminant vectors to handle the peculiarity issue for high-dimensional mass spectrometry information investigation. Their proposed technique avoids the disadvantage in the conventional routine Linear Discriminant Analysis (LDA) for dimension reduction and feature extraction. They connected FKDA to the classification of liver cancer mass spectrometry information that comprise of three classes such as hepatocellular carcinoma, cirrhosis, and healthy. FKDA could be applicable to such multiclass classification issues with nonlinearly structured information.
Marius et al. [17] have proposed the computerized calculation of hepatic tumor trouble from abdominal Computed Tomography (CT) images of diseased population with images with conflicting improvement. They exhibited the automated techniques for the segmentation of the unhealthy livers from the CT images. They utilized a shape descriptor resistant with rotation and noise for comparing local shape features. By producing a consistent sampling of the organ's surface, this parameterization can be adequately used to contrast feature of a set of closed 3D surfaces point-to-point, while avoiding basic issues with the parameterization of concave surfaces. From an initial partition of the livers, the areas of atypical local shape are resolved utilizing training sets. A geodesic active contour amends locally the partition of the livers in irregular images. Graphcuts segment the hepatic tumors utilizing shape and upgrade limitations. Graphcut technique was utilized by them to identify and portion the hepatic tumors of the sectioned liver. Liver segmentation errors are diminished altogether and all tumors are identified. At that point they extract the features for the tumor applicants and done the classification utilizing Support Vector Machines (SVM). They have evaluated their division strategy utilizing the few databases from public and in addition from the existing works. The tumor location true position fraction of 100% is accomplished by them at 2.3 false positives/case and assessed the tumor load with 0.9% error.
Carole et al. [18] have outlined a CAD framework that performed guided localization and classification of small and low-complexity, lung and liver sores in 3D Positron Emission Tomography (PET) imaging. They examined distinctive schemes in view of the combination of two supervised classifiers Linear Discriminant Analysis (LDA), the nonlinear Support Vector Machine (SVM) and three strategies for False- Positive Reduction (FPR). The image feature sets served as input information for both classifiers were comparable and comprise of the coefficients of an undecimated wavelet change. The identification performance investigation depended on a 3D approach considering the entire PET image and not only a cut or a case approach. The detection performance was measured on a different arrangement of 25 testing images with 131 lesions. The combination of the LDA and SVM score maps was appeared to create detection performance for both the lung lesions, with 91% sensitivity and 18 FPIs, and the liver injuries, with 94% sensitivity and 10 False-Positive detection per Image (FPIs).
Changyang et al. [19] have proposed a level set model fusing probability energy with the edge energy for the segmentation of liver tumors from the improved clinical CT volumes. The minimization of the probability energy approximates the density distribution of the objective and the multimodal density distribution of the foundation that can have various regions. They utilized probability energy to isolate the tumor from the unpredictable foundation with an enhanced edge detector to feature the regions with weak boundaries. They have contrasted their methodology with the Chan-Vese and the geodesic level set models and additionally the manual segmentation performed by clinical specialists. The segmentation of the target object in images with complex region and multimodal thickness was problematic for current region based level set models. Probability based clustering algorithm regularly experience issues characterizing regions with comparative density ranges and also partitioning different regions with comparative densities into the same item. The edge-based level set can segment regions with comparative densities if edges can be recognized. They have demonstrated their outcomes on 18 clinical datasets and demonstrated that the calculation had a Jaccard distance error of 14.4 ± 5.3%, the relative volume distinction of-8.1 ± 2.1%, normal surface distance of 2.4 ± 0.8 mm, RMS surface distance of 2.9 ± 0.7 mm, and the maximum surface distance of 7.2 ± 3.1 mm. Their strategy delivered predictable segmentation for different liver tumors of changing sizes and shapes and outperforms the CV region based and the geodesic level set models.
Amalia et al. [20] have proposed a novel registration system called hybrid feature based registration technique that took care of both the Ultrasound (US) imaging challenges and the requests of their tumor tackling application. Our technique has two fundamental attributes: 1) each voxel is described by three image features: intensity, nearby phase, and phase congruency; 2) we figure a set of forces from either local data (Demonskind of forces), or spatial correspondences supplied with a block matching scheme, from every image feature. A group of overhaul deformation fields which are characterized by these forces, and illuminate upon the local or regional contribution of every image feature are then made to frame the final transformation. They have determined a family of forces from local and spatial data supplied by image features and fabricated them from hybrid update deformation fields inside a diffeomorphic structure. They have utilized three image features as compared with the Log-Demons technique, such as image intensity, nearby phase and phase congruency, from which overhaul twisting fields are assessed independently. They have figured a set of forces from either local data (Demons-kind of forces), or spatial correspondences supplied with block matching scheme, from every image feature. The deformation fields from set of forces and the image features are made to form the final transformation.
Proposed Optimum Hierarchical Feature Fusion and PeSOA with PNN classifier
The recognition of the liver cancer can be effortlessly done with the ultrasound liver tissues as it is a standout amongst the most generally utilized diagnostic tools since it is effective in picturing soft tissue and organs, and it is irrelatively inexpensive compared with different modalities. So, it is regularly embraced for routine liver examinations and early identification of liver cancer. Our proposed method for liver malignancy location depends on the optimum hierarchical feature fusion which enhances the exactness with decreased expense. In the initial phase pre-processing should be possible for the decrease of noise in the procured ultrasonic liver tissue images. This may contain speckle noise and this is evacuated by the procedure of despeckle filtering algorithm. At that point feature extraction is utilized by using Dynamic Vector Warping (DVW) distance method which holds both Local cost measure and Local distance measure for feature extraction. The Local cost measure utilizes distinctive features, for example, Intensity vector, Standard up taken quality, Color histogram and LGXP to enhance the precision than the existing strategies. From the above features, the cost values are gathered and trailed by Local distance measure. It holds Manhattan distance as a feature value for feature extraction. In the third stage the optimum feature values are stipulated by using a penguin search optimization algorithm. At last from the features acquired in the past step the ultrasonic images of liver tissue classified into three classes as hepatoma, cirrhosis and typical liver utilizing the classifier, such as a Probabilistic Neural Network (PNN). Generally, the optimum hierarchical feature fusion for liver cancer identification includes four phases as appeared in Figure 1.

Figure 1: Schematic overview of the proposed system.
Next few areas clarify the various stages of the proposed scheme in brief. A few images have been utilized in subsequent segments, in order to make the document readable and justifiable.
Pre-processing using despeckle algorithm
Consider the dataset comprise of liver image as Di, j= (d1, d2… dn}. From the dataset the image d1 is taken and pre-handled.
The pre-processing of ultrasound liver image d1 comprises of speckle reduction and enhances the nature of images. The image d1 is taken from the database di which contains a wide range of images. The d1 perseveres from a typical issue of noise. Undesirable data that may diminish the complexity, deteriorating the size or shape of objects in the d1 and blurring of edges or weakening of fine details in the d1 could be termed as noise. There are two key models of noise; additive and multiplicative. Additive noise known as Gaussian noise is systematic in nature also it could be demonstrated, eliminated, and lessened effortlessly, while multiplicative noise known as speckle noise is complicated to model, image subordinate and difficult to diminish. So, that we need to utilize the Despeckle filtering algorithm to diminish the speckle noise.
Despeckle filtering algorithm: The speckle noise model might be approximated as multiplicative and is given by
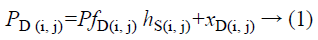
Where PD(i, j) refers to the noisy pixel and PfD(i, j) refers to the noisy free pixel, and hS(i, j) refers to the multiplicative noise and the additive noise individually i, j are lists of the spatial areas.
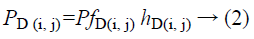
Since the impact of additive noise is smaller when compared to multiplicative noise, condition 1 might be composed as
The Logarithmic compression is utilized to recognize the envelope of echo signal in order to fit inside the presentation range. This Logarithmic compression is also influences the speckle noise statistics and it turns out to be near to white Gaussian noise. The logarithmic compression changes multiplicative structure in Equation 2 to additive noise structure as,
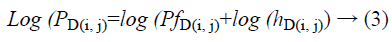
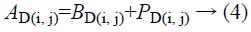
The term is the noisy image d1 in the medical ultrasound image after logarithmic compression is indicated as AD(i, j) and the term log (PfD(i, j)), log (hD(i, j)) these are the noise free pixel and noisy component after logarithmic compression, BD(i, j) as, PD(i, j) separately.
Despeckling or speckle reduction is a pre-preparing venture for some image processing issues. This despeckle algorithm is utilized to minimize the noise from d1 and update the nature of d1 to m1. For the process of removing noise it will deliver the despeckle US images m1. The m1 has some essential feature these features are removed utilizing DVW distance procedure and the feature extraction is clarified in the following stage.
Feature extraction using DVW distance technique
Features should contain data required to separate one image from another image, be insensitive to random variability in the input, furthermore be limited in number, to allow, effective figuring of discriminant capacities and to confine the measure of training data required. Feature extraction is the procedure to recover the most vital information from the raw information. Feature extraction is finding the set of parameter that express the state of a character precisely and uniquely. In feature extraction stage, every character in m1 is signified by a feature vector, which turns into its identity. The significant target of feature extraction is to remove a set of features, which exploits the recognition rate with minimal amount of components and to make a comparative list of capabilities for a variety of events of the same image. The Feature Extraction strategy is appeared in Figure 2.

Figure 2: Feature extraction method.
The features extracted from m1 serves as the correlation and closeness in m1, and then used to recognize and group limitation of anatomical structures. The feature extraction is utilized by using Dynamic Vector Warping (DVW) distance technique. In this strategy n1 features are extricated from the image m1. Dynamic Vector Warping (DVW) is an algorithm utilized for measuring similarity between two temporal arrangements which may fluctuate in time or speed to compute the distance. Based on the local distance the features are extracted. It holds both Local cost measure and Local distance measure for feature extraction. The Local cost measure utilizes various features, for example, Intensity vector, Standard up taken quality, Color histogram and LGXP. From the above features, the cost values are gathered and trailed by Local distance measure.
Local cost measure: (i) in intensity vector it takes the pixel intensity value estimations of m1 and diminish the variance of feature values. Subsequent to expelling some corner pixels that do not create the liver tissues the intensity value is stored in a feature vector. (ii) The standard uptaken quality is to discover the action of m1. It is utilized to process the cancer to treatment and is referred as a semi quantitative value as it is vulnerable against different resources of variables. It might be controlled by image noise.
Where at is the radio activity I is the injected dose and P is the patient weight
(iii) The histogram of an image is a scheme of the intensity values or the gray level estimations of a color channel versus the number of pixels at that value. The histogram features that we will consider are statistical based features, where the histogram is utilized as a perfect of the probability dissemination of the intensity levels. These statistical features convey us with data about the features of the intensity level distribution for the m1. We characterize the first order histogram probability, as
Where n is the number of pixels in the US images, L (g) is the number of pixels at gray level.
(iv) In Local Gabor XOR Pattern (LGXP) the stages are initially quantized into various despeckled US images and afterward LXP operator is connected to the quantize phases of the central pixel. After the quantization procedure each of the phase values is quantized into the quantized level values.

ϕμ, u (n) is the stage estimation of the pixel and ν (ϕμ, u (n)) is the quantized estimation of the stage and k is the quantity of stage reaches.
Local distance measure: The wrap path distance is a measure of the distinction between the two vectors after they have been distorted together, which is measured by the sum of the distances between every pair of points associated by the vertical lines. In this way, two vectors that are identical aside from localized stretching of the vector axis will have DVW distances of zero. The rule of DVW is to compare two element patterns and evaluate its similitude by calculating a minimum distance between them.
Where U, V two vectors with length n, m individually. At that point, the absolute distance between the estimations of the two features is ascertained utilizing the Euclidean distance calculation:
Every matrix component (i, j) compares to the arrangement between the points ui, and vj. Then, local distance is measured by:

In view of these local cost and local distance the Manhattan distance is computed.
(i) Manhattan distance-More formally, we can characterize the Manhattan distance, otherwise called the L1-distance, between two points in a Euclidean space with a constant Cartesian coordinate system is characterized as the sum of the lengths of the projections of the line segment between the points onto the coordinate axes.
Where M is represented as Manhattan distance, Xi refers to local cost values, X refers to local distance.
The DVW method holds the feature values as F1 removed from m1 which holds the values, such as he intensity values, the standard up taken value, the histogram, LGXP and the Manhattan distance values. Where F1 → Fi, Fi= {F1, F2… Fn}. From the F1 values the optimum feature value is stipulated for classifying reason which is explained in accompanying area.
Optimum value stipulation
Stipulating the optimum feature values is a crucial step during the process of classification issues, particularly in handwriting identification since: (1) it is expected to locate all likely feature subsets that can be composed from the initial set which result in tedious, (2) each feature is expressive for at least some of segregations, and (3) variations inside intra class and between inter-class is not too much higher. Past a guaranteed point, the incorporation of extra features prompts a more awful instead of enhanced execution. By stipulating optimum feature values the quantity of values in the computational procedure is decreased which should be possible utilizing PeSOA is clarified as a part of the accompanying segment.
Penguin search optimization algorithm (PeSOA): In this stage, the optimum hierarchical feature values are stipulated from Fi utilizing PeSOA. PeSOA is a technique for optimizing nonlinear frameworks; this is a rearranged model of social relations, which depends on chasing of the Penguins. The chasing system of the Penguins is a community oriented work of effort and timing, they benefit of their jumps by optimizing the general energy during the process of chasing and nutrition. In our proposed strategy every feature value is gathered and assesses the value. To assess the value effectively in the hierarchy report in this procedure, we should allocate the fitness in the value categories, in every fitness the position of the value with each new solution is balanced as in the accompanying condition:

Bid is the last best solution accord for this distance, rand () is a random number of the distribution, and has three solutions, the best local solution (Abest), the final solution (Aid) and the new solution Bnew). The computations in condition 12 of the solution updates are repeated for each area.
On the populace initialization stage, a populace of individuals is delivered arbitrarily. The number of inhabitants in the present generation is given, and then the accompanying generation can be delivered after three phases: evolution, selection and reproduction. In the evolution phase organize, the fitness of every single individual is computed by a fitness function. The individual with a more prominent fitness value will have a more possibility of survival and reproduction. In this paper, a fitness function is characterized as
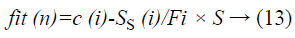
Where means the number of total samples utilized for feature determination and S is the cardinality of the feature vector, i.e., the total number of components in the feature vector. For every individual i in the populace, C (i) is the classification rate utilizing the leave one out algorithm and Ss (i) the cardinality of the selected feature subset.
The populace is improved regarding the relating fitness estimation of every person. Let C1>C2>...>Cn, where C1 is the highest classification rate accomplished in the present generation. Lj signifies the set of people with classification rate equivalent to Cj. The entire populace can be recorded in the accompanying way: [L1, L2...Ln]. In every set Lj, components are sorted by number of selected features. As a consequence of this PeSOA the feature value which has higher fitness than others are considered as the optimum feature for classification.
| Algorithm |
| • Generate feature values Fi for Di; |
| • Initialize fitness function fit; |
| • For fit=1 to number of generations; |
| • For each individual fit ? Fi |
| - Take a random step. |
| - Stipulate the optimum value (new solution) using the Equation 12 |
| - Update quantities of feature value for this position. |
| - Evaluate the fitness for each feature value by using the Equation 13. |
| - Update the feature value and update the best value. |
| - Redistributes the probabilities of value. |
| - Update best-solution. |
The optimum feature values O1 are stipulated in this stage. At that point the optimum feature estimation of liver tissues is characterized utilizing Probabilistic Neural Network and the classification is clarified in accompanying area
Probabilistic neural networks (PNN)
After the optimum quality stipulation that are put into a classifier to classify O1 into typical or cirrhosis or hepatoma. In this classification the Probabilistic Neural Network classifier is utilized to group the liver tissues. A probabilistic neural network (PNN) is a feed forward neural system, which was derived from the Bayesian system and a statistical algorithm called Kernel Fisher discriminant analysis. The PNN is utilized to group the O1 of liver tissues as hepatoma, cirrhosis and ordinary tissues. Hepatoma is an essential malignant tumor of the liver. Cirrhosis is the complication of liver sickness which includes loss of liver cells. Ordinary tissue demonstrates that the liver cells are not influenced by cancer.
In Figure 3 the first is the input layer. Second is the hidden layer. Hidden layer comprises of 10 neurons. The third is the summation layer which includes the neurons from the hidden layer. The fourth or output layer comprises of one neuron representing the output. The output layer has only one output and it refers to whether the input pixel has a place with liver area or not liver region. If the output is 1, the corresponding input pixel is said to have a place with liver region and output for non-liver pixels are represented by 0.

Figure 3: Architecture diagram of PNN.
The network structure of PNN is like back propagation; the essential contrast is that the transfer function is supplanted by exponential function and all training samples are stored as weight vectors. Give Aki, k=1…., Li, a chance to be inspected patterns having a place with a class ωi, the estimator of this class is
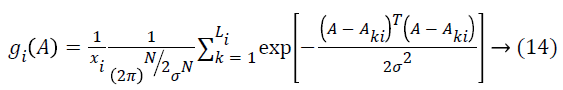
Where k=pattern number, Total number of preparing examples having a place with class ωi, kth training pattern from class ωi, σ=smoothing parameter. The smoothing parameter is utilized to portray the sharpness of every sample pattern dispersion. The system is prepared by setting the weight vectors in one of the pattern units’ equivalent to every pattern Aki in the training set, which is the key feature, and after that interfacing the output of the pattern units to the fitting summation unit. The subsequent output demonstrates that the input image d1 taken for examination is typical or hepatoma or cirrhosis. Compared with other method the Probabilistic Neural Network has high classification performance. The general procedure flow of the proposed technique is appeared in Figure 4.

Figure 4: The process flow of our proposed method.
From Figure 4 the general process flow of our proposed technique can be clarified. From the input US image a few feature in local cost measure and local distance measure is removed utilizing DVW procedure. At that point the optimal features are selected by PSOA and given as contribution to the classifier. Finally based on the training provided to the PNN classifier and the extracted features the PNN classifier characterizes the given US liver image as hepatoma, cirrhosis or typical.
Result and Discussion
The proposed technique is executed in the working stage of MATLAB with the following system specification
Processor: Intel i5 @ 3 GHz
RAM: 8 GB
Operating system: Windows 8
Matlab version: R2013a
In this segment we have clarified the test results in 3 areas our proposed strategy result is appeared in segment 4.1, parameter investigation is appeared in segment 4.2 comparison of our proposed technique with existing technique is appeared in segment 4.3 and the discussion is appeared in segment 4.4.
Hierarchical feature fusion
Dataset description: The ultrasonic liver images utilized as a part of this examination were captured from the number of patients with different kind of liver cancer. All images were standardized and confirmed by an expert doctor. The taking interest patients were given biopsies for pathological determination to provide the ground truth. In that database we have taken absolutely 40 ultrasound liver images represented by Di={d1… dn} where n=40 out of that 30 images are utilized for testing and 10 images are utilized for preparing. In those 40 images 29 are irregular images and 11 are typical images. The training images trained by decreasing noise, then the features are removed and stipulate the optimum feature value finally PNN classifier is utilized to produce the result as typical or hepatoma or cirrhosis. The testing images are trailed by the conditions apply to training image and obtain the outcome as ordinary or hepatoma or cirrhosis. For identification and classification process, we need to take the input image from the database (di) is d1 and this is utilized for further processing.
To demonstrate and evaluate the performance of the proposed method is applied to d1. The sample input image d1 is taken from di for tumor detection is shown in Figure 5.

Figure 5: Input US liver image.
The input US liver image (d1) is shown in Figure 5, which is further processed by using the despeckle algorithm to reduce the noise. The speckled and despeckle image is shown in Figure 6.

Figure 6: (a) Speckled and (b) Despeckled ultrasound liver images.
After noise removal the image is segmented to detect the abnormalities present in the image. The image (n1) resulting by segmentation is shown in Figure 7.

Figure 7: Segmented image.
From the n1 four types of features are extracted using the dynamic vector warping technique. The numerical values of extracting features from n1 are listed in Table 1.
| S. No | Features | Numerical values |
|---|---|---|
| 1 | Intensity vector | 6129.7 |
| 2 | Standard up taken value | 344.1542 |
| 3 | Color histogram | 0.4851 |
| 4 | LGXP | 12637 |
Table 1: Feature values.
From the f1 the optimum hierarchical feature value is stipulated utilizing the penguin optimization algorithm. The optimum feature value is 0.0018. Optimum features O1 are given to the probabilistic neural network for the characterization of liver of tumor and arrange the liver tumor as typical or hepatoma or cirrhosis.
Parameter analysis
The classification ability of the different features proposed in this work has been quantitatively evaluated utilizing different performance measures, for example, exactness, sensitivity, specificity, Positive predictive value, Negative predictive quality. The contingency table is given in Table 2.
| Actual class | Predicted class | |
|---|---|---|
| Normal | Abnormal | |
| Normal | TN | FP |
| Abnormal | FN | TP |
Table 2: Contingency table.
Where True Positive (TP) is the classification result is positive within the sight of the clinical abnormality. True Negative (TN) is the classification result is negative without the clinical abnormality. False Positive (FP) is the classification result is positive without the clinical abnormality. False Negative (FN) is the classification result is negative within the sight of the clinical abnormality.
Accuracy: The classification accuracy is a measure of usefulness of a strategy. It relies on the quantity of effectively characterized samples, and is computed utilizing the following condition.

Where N is the total number of colon biopsy images.
Sensitivity: Sensitivity is a measure of the capacity of a system to effectively distinguish positive samples. It can be computed utilizing the accompanying condition.
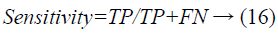
The estimation of sensitivity ranges between 0 and 1, where 0 and 1 mean most exceedingly terrible and best acknowledgment of positive samples, separately.
Specificity: Specificity is a measure of the capacity of a system to accurately recognize negative samples. It can be computed utilizing the accompanying condition.

The estimation of specificity ranges between 0 and 1, where 0 and 1 mean most exceedingly terrible and best acknowledgment of negative examples, individually.
Positive predictive value: Positive prescient quality is the probability that subjects with a positive screening test genuinely have the disease.
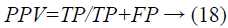
Where a “true positive” is the occasion that the test makes a positive forecast, and the subject has a positive result under the best quality level, and a “false positive” is the occasion that the test makes a positive expectation, and the subject has a negative result under the best quality level.
Negative predictive value: Negative prescient value is the probability that subjects with a negative screening test genuinely do not have the diseases.
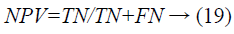
Where a ‘true negative” is the occasion that the test makes a negative prediction, and the subject has a negative result under the highest quality level, and a “false negative” is the occasion that the test makes a negative prediction, and the subject has a positive result under the best quality level.
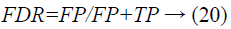
False discovery rate: The complement of positive prescient values the false discovery rate.
The performance of our proposed PNN classifier with PeSOA optimization in terms of different parameters is shown in Table 3.
| PNN+PeSOA | |||||
|---|---|---|---|---|---|
| Sensitivity | Specificity | PPV | NPV | FDR | Accuracy |
| 95.3125 | 96.875 | 98.3871 | 91.1765 | 1.6129 | 98.27 |
Table 3: Performance of our proposed method.
Comparison between the proposed methods with other existing methods
The performance of the proposed framework is contrasting its classification results with a traditional classifier system which utilizes the Support Vector Machine and K Nearest Neighbor based tumor classification method. Table 4 demonstrates the feature selection correlation results for various feature spaces.
| PSO | GA | PeSOA | ||||
|---|---|---|---|---|---|---|
| Original features | Selected features | Original features | Selected features | Original features | Selected features | |
| Wavelet-fd | 45 | 4 | 45 | 4 | 45 | 3 |
| Wavelet-eng | 45 | 4 | 45 | 4 | 45 | 3 |
| Gabor-fd | 31 | 4 | 31 | 4 | 31 | 3 |
| Gabor-eng | 62 | 7 | 62 | 7 | 62 | 5 |
| SGLDM | 52 | 8 | 52 | 10 | 52 | 4 |
| Fused | 235 | 10 | 235 | 8 | 235 | 6 |
Table 4: Comparison of feature selection results for different feature spaces.
Table 5 shows the comparison of different classifiers in terms of accuracy with various feature spaces.
| Feature spaces | KNN | FKNN | SVM | PNN | PNN+ PeSOA |
|---|---|---|---|---|---|
| Wavelet-fd | 90.83 | 89.03 | 90.14 | 88.75 | 91.13 |
| Wavelet-eng | 78.66 | 76.39 | 91.48 | 83.66 | 90.34 |
| Gabor-fd | 90.79 | 90.65 | 92.59 | 89.77 | 92.61 |
| Gabor-eng | 92.05 | 90.83 | 93.24 | 93.15 | 93.99 |
| SGLDM | 90.08 | 90.79 | 90.23 | 94.58 | 95.58 |
| Fused | 92.92 | 91.94 | 93.47 | 93.89 | 98.27 |
Table 5: Comparison of classifiers with various feature spaces.
Table 6 shows the comparison of various feature fusion methods with different classifiers in terms of the classification accuracy.
| Classifiers | HFF | Serial feature fusion | Serial feature combination | |
|---|---|---|---|---|
| PSO | KNN | 95.05 | 93.84 | 92.92 |
| FKNN | 95.05 | 94.03 | 91.94 | |
| SVM | 96.11 | 93.38 | 93.47 | |
| PNN | 95.32 | 93.35 | 93.39 | |
| GA | KNN | 94.68 | 92.96 | 92.92 |
| FKNN | 94.86 | 93.01 | 91.94 | |
| SVM | 96.25 | 94.26 | 93.47 | |
| PNN | 96.62 | 94.72 | 93.39 | |
| PeSOA | KNN | 96.54 | 94.85 | 92.47 |
| FKNN | 95.25 | 94.19 | 94.88 | |
| SVM | 94.39 | 95.83 | 95.73 | |
| PNN | 98.27 | 97.86 | 96.17 | |
Table 6: Comparison of various feature fusion methods.
Figure 8 shows the comparison of different types of classifiers based on different feature fusion methods with PSO optimization in terms of classification accuracy.

Figure 8: Comparison of different feature fusion methods with PSO optimization.
Figure 9 shows the comparison of different types of classifiers based on different feature fusion methods with GA optimization in terms of classification accuracy.

Figure 9: Comparison of different feature fusion methods with GA optimization.
Figure 10 shows the comparison of different types of classifiers based on different feature fusion methods with PeSOA optimization in terms of classification accuracy.

Figure 10: Comparison of different feature fusion methods with PeSOA optimization.
Exactness is the level of closeness of estimations of an amount to its actual (true) value. The performance of the proposed framework is assessed by comparing its classification results with the traditional classifier framework which utilizes the Support Vector Machine and KNN based tumor classification system. The accuracy esteem concludes that the subsequent value is higher than compared classification strategy. Also the graph concludes that the sensitivity, specificity, positive predictive esteem and negative predictive estimation of the proposed framework are not exactly the SVM based characterization system. In KNN based classification the sensitivity quality is higher than the proposed technique and the specificity, positive predictive esteem and negative predictive value is lower than the proposed strategy. To prove that the proposed technique is the best for liver tumor location we made a correlation with some research papers which is appeared in Table 7.
Figure 11 shows the graphical representation of the accuracy comparison between our proposed methods with some of the existing methods.

Figure 11: Accuracy comparison between our proposed method and existing methods.
From the comparative shown in Tables 4-7 the proposed method has achieved better results than the existing methods. From these experimental results and comparison we can say that the proposed method is well suitable for the liver tumor identification scheme.
| S. No | Technique | Accuracy |
|---|---|---|
| 1 | Fast kernel discriminant analysis [16] | 72.47 |
| 2 | Tumor burden analysis on computed tomography [17] | 74 |
| 3 | Optimal feature based neural network [21] | 87.64 |
| 4 | Hybrid classification techniques [22] | 96.5 |
| 5 | PNN classifier | 97.2 |
| 6 | Proposed Method (PNN Classifier + PeSOA) | 98.27 |
Table 7: Comparison analysis with previous works.
Discussion
We have seen there are a few techniques accessible for liver cancer location and classification, but due to the presence of image speckle the nature of the image corrupted. In classification, we have discussed the classifier, K Nearest Neighbor classifier and our proposed strategy Probabilistic Neural Network classifier. In Support Vector Machine classifier the sensitivity, specificity, positive predictive esteem and negative predictive values are higher than the Probabilistic Neural Network. Exactness Value is lower than the Probabilistic Neural Network. So that our proposed technique gives preferred performance over existing Support Vector Machine classifier. In K Nearest Neighbor classifier the sensitivity value is higher than the Probabilistic Neural Network and specificity, positive predictive esteem and negative predictive values are lower. The Probabilistic Neural Network creates the false discovery rate that is too low based on these our proposed strategy gives a superior and precise performance than the existing method.
Conclusion
In this paper, a novel strategy for detecting and classifying the US images has been discussed. The proposed work was completed in 4 phases. In the primary stage, pre-processing of liver images utilizing despeckle algorithm and the second stage identifies the feature extraction based on DVW method. A third stage is stipulating the optimum feature value by using a penguin optimization algorithm. At last, the extracted liver is classified, the PNN classifier is utilized to group the liver tissues as typical or hepatoma or cirrhosis. In this paper, we analyses the consequence of US images. So early location of Liver Cancer cells can be exceptionally conceivable and it diminishes the danger too. Test results demonstrate that the proposed technique has better results compared with existing strategies. It further recommends that the proposed technique is well appropriate for the liver cancer recognition and classification scheme.
References
- Mala K, Sadasivam V. Wavelet based texture analysis of liver tumor from computed tomography images for characterization using linear vector quantization neural network. Proc IEEE Int Conf Adv Comp Commun 2006; 267-270.
- Weimin H, Ning L, Ziping L, Guang BH, Weiwei Z, Jiayin Z, Yuping D. Liver tumor detection and segmentation using kernel-based extreme learning machine. Proc IEEE 35th Ann Int Conf Eng Med Biol Soc 2013; 3662-3665.
- Tarak BS, Olfa A, Faten C, Slim M, Faouzi G. Segmentation of liver tumor using HMRF-EM algorithm with Bootstrap resampling. Proc IEEE 5th Int Symp I/V Commun Mob Net, 2010.
- Fabiola P, Mu HK, Alex T, Julie B. Extracting association rules from liver cancer data using the FP-growth algorithm. Proc IEEE 3rd Int Conf Comp Adv Bio Med Sci 2013; 1.
- Selvathi D, Malini C, Shanmugavalli P. Automatic segmentation and classification of liver tumor in CT images using adaptive hybrid technique and contourlet based ELM classifier. Proc IEEE Int Conf Rec Trend Inform Technol 2013; 250-256.
- Dijia W, David L, Michael S, Christian T, Grzegorz S, Kevin SZ. Automatic detection of liver lesion from 3d computed tomography images. Proc IEEE Comp Soc Conf Comp Vis Patt Recogn Workshops 2012; 31-37.
- Weimin H, Yongzhong Y, Zhiping L, Guang BH, Jiayin Z, Yuping D, Wei X. Random feature subspace ensemble based extreme learning machine for liver tumor detection and segmentation. Proc 36th Ann Int Conf IEEE Eng Med Biol Soc 2014; 4675-4678.
- Megha PA, Ram MRG. A novel CBIR approach to differential diagnosis of liver tumor on computed tomography images. Procedia Engineering 38: 528-536.
- Cheng MC, Chien YH, Chyi HB. Building a patient oriented treatment decision system for liver cancer. Proc Third Glob Congr Intel Sys 2012; 413-418.
- Huiyan J, Fengzhen T, Xiyue Z. Liver cancer identification based on PSO-SVM model. Proc IEEE 11th Int Conf Control Autom RobotVis 2010; 2519-2523.
- Ali L, Amir H, Jie L, Aamer S, Sudhakr U, Mufti M, Zakir U, Xiaodong Y, Luo B, Rajak M. Intelligent image processing techniques for cancer progression detection, recognition and prediction in the human liver. Proc IEEE Symp Comp Intel Healthc e-health 2014; 25-31.
- Elmorsy SA, Abdou MA, Hassan YF, Elsayed AK. A region growing liver segmentation method with advanced morphological enhancement. Proc 32nd Nat Radio Sci Conf 2016; 418-425.
- Poonguzhali S, Deepalakshmi B, Ravindran G. Optimal feature selection and automatic classification of abnormal masses in ultrasound liver images. Proc IEEE Int Conf Sign Proc Commun Netw 2007; 503-506.
- Delia M, Sergiu N, Radu B. The role of the multi-resolution textural features in improving the characterization and recognition of the liver tumors, based on ultrasound images. Proc IEEE 14th Int Symp Symbol Num Algo Sci Comp 2012; 192-199.
- Nicolas GR, Laurent M, Peter F, Marcel A, Genevieve P, Anass A, JeanYM. Parametric imaging of dynamic vascular patterns of focal liver lesions in contrast-enhanced ultrasound. Proc IEEE Int Ultrasonics Symp 2009; 1282-1285.
- Oh JH, Gao J. Fast kernel discriminant analysis for classification of liver cancer mass spectra. IEEE/ACM Trans Comput Biol Bioinform 2011; 8: 1522-1534.
- Marius GL, William JR, Jianfei L, Jeremy MW, Vivek P, Shijun W, Ronald MS. Tumor burden analysis on computed tomography by automated liver and tumor segmentation. IEEE Trans Med Imag 2012; 31: 1965-1976.
- Carole L, Simon MF, Remy P. Automatic detection of lung and liver lesions in 3-D positron emission tomography images: a pilot study. IEEE Tran Nucl Sci 2012; 59: 102-112.
- Changyang L, Xiuying W, Stefan E, Michael F, Yong Y, Jinhu C, David DF. A likelihood and local constraint level set model for liver tumor segmentation from CT volumes. IEEE Trans Biomed Eng 2013; 60: 2967-2977.
- Amalia C, Laurent R, David C, Ewan MA, Julia S. Hybrid feature-based diffeomorphic registration for tumor tracking in 2-d liver ultrasound images. IEEE T