ISSN: 0970-938X (Print) | 0976-1683 (Electronic)
Biomedical Research
An International Journal of Medical Sciences
- Biomedical Research (2014) Volume 25, Issue 3
Electromyogram signal based hypovigilance detection.
1Department of CSE, Vels University, Pallavaram, Chennai 600 117, India
2AI-Rehab Research Group, Universiti Malaysia Perlis (UniMAP), Kampus Pauh Putra, 02600 Arau, Perlis, Malaysia
- *Corresponding Author:
- Arun Sahayadhas
Department of CSE
Vels University,Pallavaram
Chennai 600 117, India
Accepted February 19 2014
In recent years, driver drowsiness and driver inattention are the major causes for road accidents leading to severe traumas such as physical injuries, deaths, and economic losses. This necessitates the need for a system that can alert the driver on time, whenever he is drowsy or inattentive. Previous research works report the detection of either drowsiness or inattention only. In this work, we aim to develop a system that can detect hypovigilance, which includes both drowsiness and inattention, using Electromyogram (EMG) signals. Fifteen male volunteers participated in the data collection experiment where they were asked to drive for two hours at 3 different times of the day (00:00 – 02:00 hrs, 03:00 – 05:00 hrs and 15:00 – 17:00 hrs) when their circadian rhythm is low. The results indicate that the standard deviation feature of EMG is efficient to detect hypovigilance with a maximum classification accuracy of 89%.
Keywords
Hypovigilance, inattention, fatigue, sEMG, driver safety
Introduction
According to the statistics released by the World Health Organisation more than 1.2 million people die each year on the world’s roads, and between 20 and 50 million suffer non-fatal injuries due to road accidents [1]. The National Highway Traffic Safety Administration (NHTSA), USA conservatively estimated 100000 police reports on vehicle crashes each year which were the direct results of driver drowsiness. Such accidents also result in approximately 1550 deaths, 71000 injuries and $12.5 billion in monetary losses [2]. The National Sleep Foundation (NSF) reported that in 2009, 54% of adult drivers had driven a vehicle while feeling drowsy and 28% had actually fallen asleep [3]. Driver inattention includes concentrating on secondary tasks like using cell phone, music player, etc while driving. In the year 2008, NHTSA estimated 5870 deaths, 350,000 injuries and 745,000 property damages due to driver distraction (NHTSA’s National Centre for Statistics and Analysis, America, 2009 report). In US alone, damages of $43 billion per year has been estimated due to cell phone related crashes [4]. A naturalistic driving study found that 78% of crashes and 65% of near-crashes included inattention as a contributing factor [5]. According to the United Nations Economic and Social Commission for Asia and the Pacific (UNESCAP), around 1 million deaths, 23 million injuries and 10 million vehicles are exposed to the road accidents in their region every year. They also conclude that more than 85% of the causalities due to road accidents are from the developing countries [6]. All these statistics convey that driver hypovigilance, which includes both driver drowsiness and driver inattention is one of the main factors for road accidents throughout the world. Most of these accidents can be avoided, if the fatigue or distracted driver is alerted on time. This requires an efficient hypovigilance detection system that can detect both drowsiness and inattention to be developed.
The term ‘Hypovigilance’ is derived from two words ‘Hypo’ & ‘Vigilance’. ‘Hypo’ originates from a Greek word meaning ‘diminished’ and ‘vigilance’ means ‘alertness’. So, ‘hypovigilance’ together means ‘diminished alertness,’ and can be defined as anything that causes a decrease in paying a close and continuous attention. Impairment of alertness in a driver may be due to prolonged sleepiness or short term inattention. It may lead the driver to lose control of the vehicle which in turn can lead to accidents like crashing of the vehicle onto other vehicles or stationary surroundings. In order to prevent these devastating incidents, the state of the driver should be continuously monitored.
Driver fatigue is synonymously used with driver drowsiness. Driver drowsiness mainly depends on (i) the quality of the last sleep, (ii) the circadian rhythm (time of day) and (iii) the increase in the duration of the driving task [7-9]. Recent statistics from countries such as the United Kingdom, the United States, Israel, Finland, and France indicate that an increased number of vehicle accidents caused by driver drowsiness occurred during the peak drowsiness periods sleeping hours of 02:00 to 06:00 hours and 14:00 to 16:00 hours. During these time frames, the circadian rhythm shows higher chance of getting drowsy and drivers are 3 times more likely to fall asleep at these times than at 10:00 hours or at 19:00 hours [10]. So researchers have manipulated drowsiness by asking the driver to drive for longer duration in a monotonous environment during times of day when their circadian rhythm is low. The term inattention and distraction has been used synonymously. According to Hedlund et al. “Distraction involves a diversion of attention from driving, because the driver is temporarily focusing on an object, person, task, or event not related to driving, which in turn reduces the awareness, decision-making, and/or performance of the driver, leading to an increased risk of corrective actions, near-crashes, or crashes” [11]. Since distractions may not produce immediate consequences, it would be better if a driver who is distracted is alerted on time. Researchers have mainly dealt with two types of distraction namely: cognitive distraction (e.g., talking in the cell phone) and visual distraction (eg. Texting a sms) [12-15]
In general any one of the following measures has been used for measuring either drowsiness or distraction. They are 1) Behavioral measures 2) Vehicle based measures and 3) Physiological measures.
The behavior of the driver, including yawning, eye closure, eye blinking, head pose, etc., is monitored through a camera and the driver is alerted if any of the drowsiness or inattention symptoms are detected [16-18]. Visionbased measures are an efficient way to detect hypovigilance and some real-time products have been developed such as Seeing Machines [19] and Lexus [20]. However, when evaluating the available real-time detection systems, Lawrence et al. observed that different illumination conditions affect the reliability and accuracy of the measurements [21]. Vehicle based measures are useful to measure hypovigilance when the driver’s lack of vigilance has an effect on vehicle control or deviation. However, in some cases there was no impact on vehicle based parameters even if the driver was drowsy [7]. This makes vehicle based drowsiness detection system unreliable. Though intrusive, physiological signal based measures are reliable and accurate as they provide the true internal state of the driver. Electrooculogram (EoG) signal measures the electric potential difference between the cornea and the retina by generating an electrical field in context to the orientation of the eyes [22-25]. Researchers have used EoG to track the eye movement, which is then used to detect drowsiness or inattention. Electroencephalogram (EEG) signal has various frequency bands such as the delta band (0.5–4 Hz) corresponding to the sleep activity, the theta band (4–8 Hz) related to drowsiness, the alpha band (8–13 Hz) corresponding to relaxation and creativity, and the beta band (13–25 Hz) corresponding to activity and alertness [26,27]. Inattention is related to Beta band and drowsiness is related to theta band. Many researchers have extracted features from these bands and have classified drowsiness or inattention [26-29]. Heart rate and Heart Rate Variability (HRV) signals that are derived from Electrocardiogram (ECG) signals, is also found to vary significantly during the different states of the driver such as alertness, drowsiness and inattentiveness [8,14,30,31]. Researchers have worked on HRV signals that are derived from ECG and analyzed features such as RR Interval (RRI) to detect driver drowsiness or inattention [29,30,32-34]. Also by extracting and analysing the Low-Frequency (LF) (0.04Hz - 0.15Hz) and High- Frequency (HF) (0.15Hz - 0.45Hz) components, they have found the ratio of the LF to HF to decrease progressively as driver moves from alert to drowsy state [35-37]. Researchers have also observed the heart rate (HR) to vary significantly during the different states such as inattention and drowsiness [8,14,38,39].
The surface electromyography (sEMG) is a non-invasive index of the level of muscle activation [40]. In recent years, more attention is focused on the analysis of EMG signals during sleep because of known aberrations during REM. Researchers have also attempted to quantify muscle activity from sEMG during sleep [41,42]. However, very few works have been done in the context of driver fatigue [43]. The advantages and limitations of various measures are given in Table 1.

Table 1: Advantages and Limitations of various measures
Among the physiological parameters such as EEG, EOG, ECG and EMG, ECG and EMG can be measured in a less intrusive manner. The EEG signals require a large number of electrodes to be placed on the scalp of the driver and the electrodes for measuring EoG signal have to be placed near the eye which can hinder vision when driving. Researchers have used non-intrusive means to measure ECG by placing electrodes in the steering wheel [48] or on the driver’s seat [49] (Yu X, University of Minnesota, Duluth report 2009, Personal Communications). By considering the advantages of physiological measures over the other measures and the availability of non-intrusive measurement modalities, ECG and EMG signals are chosen to detect hypovigilance in this work. In this experiment, we tend to find if alert, fatigue and distraction states can been traced from sEMG signals.
Materials and Methods
Protocol
Driver fatigue mainly depends on the: (i) the quality of the last sleep, (ii) the circadian rhythm (time of day) and (iii) the increase in the duration of driving task [7-9].
Hence, the protocol was designed to take data during three different times of the day (00:00 – 02:00 hrs, 03:00 – 05:00 hrs and 15:00 – 17:00 hrs). The lighting conditions in laboratory were also simulated accordingly. A simulator game, TORCS, was used to enable driving and the maximum speed was set to 70 km/hr in order to create a monotonous environment [50].
The protocol used to obtain the data for normal, fatigue and distraction states in the driver is as shown in Figure 1. In the first 15 minutes, normal signals were obtained from the subjects, as they were only driving without any distraction. Then in order to stimulate visual distraction, the subjects were asked to reply back for four text messages that were sent during the next five minutes, with questions related to their hobbies and general interest such as food, sports, etc. Cognitive distraction was stimulated by making a phone call to the subject at the 25th minute; the subjects responded to the arithmetic questions that were asked. The level of difficulty was based on the speed of answering by the subject. This was done so that the subject could think for a while, rather than spontaneously answer. In order to stimulate drowsiness, the subjects drove for an hour and half without any disturbance.

Figure 1: Protocol of the experiment
Subjects and Experimental setup
The experimental set up is shown in Figure 2. A fixed table top driving simulator was used to enable driving. In the data collection experiment, two physiological signals (sEMG and ECG) were obtained simultaneously. The experimental results obtained from ECG signal has been published in [39]. The sEMG data was collected by placing corresponding electrodes in the trapezius muscle and PHYWE (Germany) was used for the sEMG data collection with a sampling frequency of 256 Hz. The video of the subject’s face while driving was also recorded for the entire 2 hour session using an IR camera (30 fps). Fifteen healthy university male students (mean age ± SD = 25.6 ± 2.5 years, range 23-32) with valid driving license participated in the experiment after providing written consent. All the experiments were conducted during the times of the day when fatigue is much prevalent (00:00 – 02:00 hrs, 03:00 – 05:00 hrs and 15:00 – 17:00 hrs). All the fifteen subjects returned on different days to finish the three sessions.

Table 2: Our experimental setup
Data Analysis
Preprocessing
The EMG signals obtained during driving are highly prone to movement artifacts and noise. Removing these artifacts is one of the biggest challenges in data analysis. In this experiment, the high frequency noises were removed using a 4th order Chebyshev low pass filter with a cutoff frequency of 30 Hz. In case of Chebyshev filter the total number of maxima and minima in the pass band region is equal to the filter order. This filter is specified by the maximum pass band gain, the cutoff frequency and the filter order. The raw signal and the filtered signal are shown in Figure 3.

Figure 3: Raw and filtered EMG signal during different states
Discrete Fourier Transform
DFT is an efficient algorithm that transforms the signal from time domain to frequency domain. For any signal X(t), the DFT is calculated as follows,
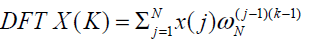
where is the input signal, X is the signal in
frequency domain and N is the total number of samples.
Discrete Fourier Transform provides information about
the frequency content available in the entire signal. After
applying DFT to the preprocessed signal, the various statistical
features were extracted.
is the input signal, X is the signal in
frequency domain and N is the total number of samples.
Discrete Fourier Transform provides information about
the frequency content available in the entire signal. After
applying DFT to the preprocessed signal, the various statistical
features were extracted.
Classification
The extracted features were trained and classified using the Linear Disciminant Analysis (LDA), Quadratic Discriminant Analysis (QDA) [51-53] and k-nearest neighbor (kNN) [51,54,55] classifiers.
Under LDA we assume that the density for X, given for every class k is following a Gaussian distribution. The density formula for a multivariate Gaussian distribution is:
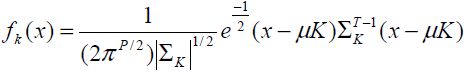
where p represents the dimension and Σk is the covariance matrix. This involves the square root of the determinant of this matrix. In this case matrix multiplication is done. The vector x and the mean vector μk are both column vectors.
For Linear discriminant analysis (LDA): Σk = Σ, ∀k.
In LDA, an assumption that the covariance matrix is identical for different k is made and thereby the classifier becomes linear. Linear Discriminant Analysis (LDA) determines parameters in such a way that, there is the best discrimination between the various classes. It does this by preserving most of the class discriminatory information.
The only difference of LDA from QDA is that in case of QDA no assumption that the covariance matrix is identical for different classes is made, but instead the decision boundary is determined by a quadratic function.
KNN is a simple data driven lazy learning algorithm, where an unlabelled point is attributed to the predominant class within the k nearest labeled points belonging to the training class. In all cases, 70% of data is used for training, while the remaining 30% for testing.
Results and Discussions
The distribution of various statistical features for normal, fatigue and cognitive distraction states is shown in Table 2. The statistically significant standard deviation feature, obtained during the various states of the driver were used to classify the fatigue and inattentiveness using LDA, QDA and KNN classifiers.

Table 2: Statistical features of different states
Table 3 shows the results obtained by classifying the inattentive, fatigue and normal state of the driver. The classification of fatigue is 80.45 % in case of LDA, wheareas in the case of knn it is 71.26 %. However, the classification accuracy is 100% for normal state in QDA and knn but very less in LDA classifier. In the case of inattention, QDA and KNN performed best giving an accuracy of 97.29 %. In general, QDA and KNN classifiers produced improved results. This indicates that a hypovigilance detection system can be developed by extracting the conventional standard deviation feature from EMG signal and this can be used with other reliable physiological signals for reliable results.

Table 3: Classification of Standard Deviation feature
Most of the published work on drowsiness or inattention has focused on either EEG or ECG. However, Balasubramanian et al. observed that the muscle activity during simulated driving showed significant difference between 1st minute and 15th minute of driving [43]. sEMG was captured from trapezius and deltoid muscles during monotonous car driving and muscle fatigue was analyzed by [56]. Researchers have investigated and proved that the sEMG variables of left biceps (LB), right biceps (RB), left forearm flexor (LW), right forearm flexor (RW) and frontal (L) muscles, are valid and reliable indicators of muscular fatigue [57]. They recommended that analysis has to be made on different groups of muscles (i.e. latissimus dorsi, gluteus maximus, deltoid, trapezius) to further verify whether the proposed metrics provide useful information about the fatigue level. Though sEMG has not been studied in the context of drowsiness, it would be significant to analyze the pattern of muscle fatigue during drowsiness. Akin et al. observed the success rate to be higher when using a combination of EEG and EMG signals compared to using either one of signal in detecting drowsiness [26]. This also indicates that sEMG can be used along with other physiological signals to enhance the performance of the system [22,25]. Researchers have also found that thinking or cognitive work activates sEMG[58,59]. However, so far no research work has been done to correlate inattention and driving in the context of sEMG signals. In our work, it was observed that sEMG can be a viable tool to detect fatigue and inattention.
Conclusion
Monitoring driver behavior is a much needed factor for safe driving as driver drowsiness and driver inattention are the major causes for road accidents. Though researchers have probed into either drowsiness or inattention, not one of them has worked on a universal system to detect both drowsiness and inattention. In this work, hypovigilance has been detected using EMG signals. The raw signals being prone to noise were preprocessed using efficient filtering methods. The standard deviation feature of the preprocessed EMG signal has been classified into the various hypovigilance states such as fatigue, normal and inattention successfully with accuracy of 89.52%. Based on the outcome of this research study, a system to detect the hypovigilance and alert the driver can be worked out. The EMG measure can also be combined with other nonintrusive physiological measures like ECG for reliable results. In the future, behavioral measures and vehicle based measures can also be fused with physiological measures for better and robust detection.
References
- Report W. Global status report on road safety time for action. World Health Organisation; 2007.
- Rau P. Drowsy Driver Detection and Warning System For Commercial Vehicle Drivers: Field Operational Test Design, Analysis, and Progress. Driver Interaction Division, SAE Government; 2005.
- NSF. Drivers beware getting enough sleep can save your life this memorial day. America: National Sleep Foundation press release; 2010.
- Cohen JT, Graham JD. A revised economic analysis of restrictions on the use of cell phones while driving. Risk Analysis 2003; 23(1).
- Klauer SG, Dingus TA, Neale VL, Sudweeks JD, Ramsey D. The Impact of Driver Inattention on Near- Crash/Crash Risk: An Analysis Using the 100-Car Naturalistic Driving Study Data; 2006.
- UNESCAP. ESCAP works towards reducing poverty and managing globalization. Transport And Communications Bulletin For Asia And The Pacific 2009; 79.
- Ingre M, ÅKerstedt T, Peters B, Anund A, Kecklund G. Subjective sleepiness, simulated driving performance and blink duration: examining individual differences. Journal of Sleep Research 2006; 15(1): 47-53.
- Kokonozi AK, Michail EM, Chouvarda IC, Maglaveras NM, editors. A study of heart rate and brain system complexity and their interaction in sleep-deprived subjects. Computers in Cardiology 2008; 14-17.
- Vitaterna MH, Takahashi JS, Turek FW. Overview of Circadian Rhythms. Alcohol Research & Health. 2001; 25.
- Horne J, Reyner L. Vehicle accidents related to sleep: a review. Occupational and Environmental Medicine 1999; 56(5): 289-294.
- Hedlund J, Simpson H, Mayhew D, editors. International Conference on Distracted Driving Summary of Proceedings and Recommendations. International Conference on Distracted Driving; 2006; Toronto, Ontario, Canada 2006.
- Harbluk JL, Noy YI, Trbovich PL, Eizenman M. An on-road assessment of cognitive distraction: Impacts on drivers' visual behavior and braking performance. Accident Analysis & Prevention 2007; 39(2): 372-379.
- Liang Y, Lee JD. Combining cognitive and visual distraction: Less than the sum of its parts. Accident Analysis & Prevention 2010; 42(3): 881-890.
- Miyaji M, Kawanaka H, Oguri K, editors. Driver's cognitive distraction detection using physiological features by the adaboost. 12th International IEEE Conference on Intelligent Transportation Systems; 2009.
- Benedetto S, Pedrotti M, Minin L, Baccino T, Re A, Montanari R. Driver workload and eye blink duration. Transportation Research Part F: Traffic Psychology and Behaviour 2011; 14(3): 199-208.
- Xiao F, Bao-Cai Y, Yan-Feng S, editors. Yawning Detection for Monitoring Driver Fatigue. International Conference on Machine Learning and Cybernetics; 19- 22 August 2007; Hong Kong.
- Smith P, Shah M, Vitoria LN. Determining driver visual attention with one camera. IEEE Transactions on Intelligent Transportation Systems 2003; 4(4): 205-218.
- Victor TW, Harbluk JL, Engström JA. Sensitivity of eye-movement measures to in-vehicle task difficulty. Transportation Research Part F: Traffic Psychology and Behaviour 2005; 8(2): 167-190.
- Seeingmachines. Driver State Sensor accessed on 2011 2011 [cited 2011]. Available from: http://www.seeingmachines.com/product/dss/.
- Lexus. LX Driver monitoring system 2006. Available from: http://www.lexus.eu/range/ls/key-features/safety/safety-driver-monitoring-system.aspx.
- Lawrence Barr, Stephen Popkin, Howarth H. An Evaluation of Emerging Driver Fatigue Detection Measures and Technologies. Cambridge: Volpe National Transportation Systems Center 2009 FMCSA-RRR-09-005.
- Kurt MB, Sezgin N, Akin M, Kirbas G, Bayram M. The ANN-based computing of drowsy level. Expert Systems with Applications 2009; 36(2, Part 1): 2534-2542.
- Thum Chia C, Mustafa MM, Hussain A, Hendi SF, Majlis BY, editors. Development of vehicle driver drowsiness detection system using electrooculogram (EOG). 1st International Conference on Computers, Communications, & Signal Processing with Special Track on Biomedical Engineering 2005; 14-16 Nov. 2005.
- Sloten J, Verdonck P, Nyssen M, Haueisen J, Sommer D, Golz M, et al. Assessing Driver’s Hypovigilance from Biosignals. In: Magjarevic R, editor. 4th European Conference of the International Federation for Medical and Biological Engineering. IFMBE Proceedings. 22: Springer Berlin Heidelberg 2009; p. 152-155.
- Hu S, Zheng G. Driver drowsiness detection with eyelid related parameters by Support Vector Machine. Expert Systems with Applications 2009; 36(4): 7651-7658.
- Akin M, Kurt M, Sezgin N, Bayram M. Estimating vigilance level by using EEG and EMG signals. Neural Computing & Applications 2008; 17(3): 227-236.
- Santana Diaz A, Jammes B, Esteve D, Gonzalez Mendoza M, editors. Driver hypovigilance diagnosis using wavelets and statistical analysis. 5th IEEE International Conference on Intelligent Transportation Systems; 2002.
- Eoh HJ, Chung MK, Kim S-H. Electroence- phalographic study of drowsiness in simulated driving with sleep deprivation. International Journal of Industrial Ergonomics 2005; 35(4): 307-320.
- Michail E, Kokonozi A, Chouvarda I, Maglaveras N, editors. EEG and HRV markers of sleepiness and loss of control during car driving. 30th Annual International Conference of the IEEE Engineering in Medicine and Biology Society; 2008.
- Moriguchi A, Otsuka A, Kohara K, Mikami H, Katahira K, Tsunetoshi T, et al. Spectral change in heart rate variability in response to mental arithmetic before and after the beta-adrenoceptor blocker, carteolol. Clinical Autonomic Research 1992; 2(4): 267-270.
- Sloten J, Verdonck P, Nyssen M, Haueisen J, Mizuno A, Okumura H, et al. Development of neckband mounted active bio-electrodes for non-restraint lead method of ECG R wave. In: Magjarevic R, editor. 4th European Conference of the International Federation for Medical and Biological Engineering. IFMBE Proceedings. 22: Springer Berlin Heidelberg; 2009 p. 1394-1397.
- De Rosario H, Solaz JS, Rodri x guez N, Bergasa LM. Controlled inducement and measurement of drowsiness in a driving simulator. Intelligent Transport Systems, IET. 2010; 4(4): 280-288.
- Fairclough SH, Graham R. Impairment of Driving Performance Caused by Sleep Deprivation or Alcohol: A Comparative Study. The Journal of the Human Factors and Ergonomics 1999; 41(1): 118-128.
- Kawakita E, Itoh M, Oguri K, editors. Estimation of driver's mental workload using visual information and heart rate variability. 13th International IEEE Conference on Intelligent Transportation Systems. 2010; 19-22 Sept. 2010.
- Guosheng Y, Yingzi L, Prabir B. A driver fatigue recognition model based on information fusion and dynamic Bayesian network. Information Sciences. 2010; 180(10): 1942-1954.
- Östlund J, Nilsson L, Carsten O, Merat N, Jamson H, Jamson S, et al. Deliverable 2—HMI and safety-related driver performance. 2004; GRD1/2000/25361 S12.319626.
- Sahayadhas A, Sundaraj K, Murugappan M. Drowsiness detection during different times of day using multiple features. Australasian Physical and Engineering Sciences in Medicine. 2013; 36(2): 243-250.
- Yu L, Sun X, Zhang K. Driving Distraction Analysis by ECG Signals: An Entropy Analysis Internationalization, Design and Global Development. In: Rau P, editor. Lecture Notes in Computer Science. 6775: Springer Berlin / Heidelberg; 2011. p. 258-264.
- Arun S, Sundaraj K, Murugappan M. Hypovigilance detection using energy of electrocardiogram signals. Journal of Scientific & Industrial Research. 2012; 71(12): 794-799.
- De Luca CJ. Myoelectrical manifestations of localized muscular fatigue in humans. Crit Rev Biomed Eng. 1984; 11(4): 251-279.
- Ferri R, Manconi M, Plazzi G, Bruni O, Vandi S, Montagna P, et al. A quantitative statistical analysis of the submentalis muscle EMG amplitude during sleep in normal controls and patients with REM sleep behavior disorder. Journal of sleep research. 2008; 17(1): 89-100.
- Fairley JA, Georgoulas G, Mehta NA, Gray AG, Bliwise DL. Computer detection approaches for the identification of phasic electromyographic (EMG) activity during human sleep. Biomedical Signal Processing and Control. 2012; 7(6): 606-615.
- Balasubramanian V, Adalarasu K. EMG-based analysis of change in muscle activity during simulated driving. Journal of Bodywork and Movement Therapies. 2007; 11(2): 151-158.
- Liu CC, Hosking SG, Lenné MG. Predicting driver drowsiness using vehicle measures: Recent insights and future challenges. Journal of Safety Research. 2009; 40(4): 239-245.
- Engström J, Johansson E, Östlund J. Effects of visual and cognitive load in real and simulated motorway driving. Transportation Research Part F: Traffic Psychology and Behaviour. 2005; 8(2): 97-120.
- Charlton SG. Driving while conversing: Cell phones that distract and passengers who react. Accident Analysis & Prevention. 2009; 41(1): 160-173.
- Healey JA, Picard RW. Detecting stress during real- world driving tasks using physiological sensors. IEEE Transactions on Intelligent Transportation Systems. 2005; 6(2): 156-166.
- Lin Y, Leng H, Yang G, Cai H. An Intelligent Noninvasive Sensor for Driver Pulse Wave Measurement. IEEE Sensors Journal 2007; 7(5): 790-799.
- Yong Gyu L, Ko Keun K, Suk P. ECG measurement on a chair without conductive contact. IEEE Transactions on Biomedical Engineering. 2006; 53(5):956-959.
- Thiffault P, Bergeron J. Monotony of road environment and driver fatigue: a simulator study. Accident Analysis & Prevention. 2003; 35(3): 381-391.
- Bhattacharyya S, Khasnobish A, Chatterjee S, Konar A, Tibarewala DN, editors. Performance analysis of LDA, QDA and KNN algorithms in left-right limb movement classification from EEG data. International Conference on Systems in Medicine and Biology 2010; 16-18 December 2010; Kharagpur
- Howden WE, Wieand B. QDA-a method for systematic informal program analysis. IEEE Transactions on Software Engineering 1994; 20(6): 445-462.
- Juszczak P, Tax DMJ, Verzakov S, Duin RPW, editors. Domain Based LDA and QDA. 18th International Conference on Pattern Recognition 2006; 20-24 August 2006; Baptist University, Hong Kong.
- Cheng F, Chen J, editors. Gabor wavelet based human fatigue pattern detection. International Conference on Mobile IT Convergence; 2011; 26-28 September 2011; Gyeongsangbuk-do
- Chun-Hsiang C, Pei-Chen L, Li-Wei K, Bor-Chen K, Chin-Teng L, editors. Driver's cognitive state classification toward brain computer interface via using a generalized and supervised technology. The 2010 International Joint Conference on Neural Networks 2010; 18-23 July 2010; Barcelona.
- Hostens I, Ramon H. Assessment of muscle fatigue in low level monotonous task performance during car driving. Journal of Electromyography and Kinesiology 2005; 15(3): 266-274.
- Katsis C, Ntouvas N, Bafas C, Fotiadis D, editors. Assessment of muscle fatigue during driving using surface EMG. Proceedings of the IASTED International Conference on Biomedical Engineering; 2004.
- Whitham EM, Lewis T, Pope KJ, Fitzgibbon SP, Clark CR, Loveless S, et al. Thinking activates EMG in scalp electrical recordings. Clinical Neurophysiology 2008; 119(5): 1166-1175.
- Malmo RB, Malmo HP. On electromyographic (EMG) gradients and movement-related brain activity: significance for motor control, cognitive functions, and certain psychopathologies. International Journal of Psychophysiology 2000; 38(2): 143-207.