ISSN: 0970-938X (Print) | 0976-1683 (Electronic)
Biomedical Research
An International Journal of Medical Sciences
Research Article - Biomedical Research (2017) Volume 28, Issue 7
ECG signal classification and parameter estimation using multiwavelet transform
Balambigai Subramanian*
Department of Electronics and Communication Engineering, Kongu Engineering College, Tamil Nadu, India
- *Corresponding Author:
- Balambigai Subramanian
Department of Electronics and Communication Engineering
Kongu Engineering College, India
Accepted on December 12, 2016
The electrocardiogram (ECG) shows the plot of the bio-potential generated by the activity of the heart and is used by physicians to predict and treat various cardio vascular diseases. The QRS detection is a very important step in ECG signal processing. The main parameters concerned with QRS detection are sensitivity, accuracy, positive prediction and detection error. The methods used to detect QRS complex in ECG signals are Pan Tompkins algorithm, derivative based QRS detection and wavelet transform based QRS detection. In this paper performance comparison of wavelet transform based QRS detection with Pan Tompkins algorithm and derivative based QRS detection is done based on the characteristics of sensitivity, positive prediction and detection error. The accuracy of the proposed methodology is 93.35% and the specificity is 90%.
Keywords
Baseline wander, Electrocardiogram, Feature extraction, Multiwavelet transform, QRS complex.
Introduction
Electrocardiography (ECG) is a graphical representation of the electrical activity of the heart over a period of time which is recorded by the electrodes connected to the body either using three leads or twelve leads attached to the surface of the skin. [1]. The human circulatory system consists of heart, lungs and arteries along with veins that are helpful for the oxygen, nutrients and waste through the body. One cardiac cycle of ECG signal consists of the P wave QRS complex along with T waves is shown in Figure 1. P wave represents depolarization and the QRS represents ventricular depolarization. T wave represents rapid repolarization of the ventricles. During the measurement of ECG, there is a chance of various artefacts being recorded along with the signal such as power-line interference, ECG baseline wander, etc. [2]. These artefacts may cause a wrong diagnosis or misinterpretation of the vital cardiac parameters. The QRS complex is the most significant part in the ECG because of its high amplitude compared to P and T waves and uses in R peak detection to find the heart rate of a person. The digital signal processing techniques to be needed to filter out unwanted signal noise such as baseline drift motion artifact and powerline noise to provide accurate information from the input signals received from the electrodes [3]. Meyer et al. [5] proposed combining Pan – Tompkins and wavelet algorithms algorithms in automatic detection of QRS complexes in ECG signals. QRS complex and specifically Rpeak detection is the crucial step in every automatic electrocardiogram analysis. The Pan Tompkins algorithm does not adapt to the variations in the QRS complex structure and does not accurately provide useful information for the timevarying morphology of the QRS complex.

Figure 1: Normal ECG waveform [4].
Wavelet transforms are efficient for non-stationary signals that can detect the QRS complex morphology and its properties which changes with time and also to the noise in the signal. Arzeno et al. [6] proposed analysis of first derivative based QRS detection algorithms. In this, the algorithms based on the differentiated ECG are computationally efficient and ideal for real-time analysis of large datasets. This algorithm analyze traditional first – derivative based square function and Hilbert transform based methods for QRS detection and their modifications with improved detection thresholds. On a standard dataset, the Hamilton – Tompkins algorithm had the highest detection accuracy and largest timing error. The modified Hamilton Tompkins algorithm as well as the Hilbert transform based algorithms had comparable and slightly lower accuracy. The derivative based algorithm may miss many QRS complexes and is not robust to noisy signals and also its flexible in analyzing the time varying structure of ECG data.
Bagde and Raikwar [7] proposed detection of QRS complexes of ECG waveform based on empirical mode decomposition using Matlab. Empirical Mode Decomposition (EMD) method relies on a fully data-driven mechanism that does not require any priori known basis. But, it is has considerable delay. Various classification methods for ECG have been quoted by Nazmy et al. [8].
Existing Methods for QRS Detection
QRS complex detection is helpful to find the R peaks associated to heartbeat. Many algorithms are used to detect the QRS morphologies to aid in diagnosis tasks that might arise based on the changes of values obtained during QRS detection [9]. The main parameters to be considered during QRS detection are accuracy, predictivity, consistency and hardware demands. The enhancement methods are techniques can be used for enhancing characteristics and vital information of ECG waveforms [10].
Pan Tompkins algorithm
The QRS detection algorithm introduced by Pan and Tompkins is the most widely used and often cited algorithm for the extraction of QRS complexes from electrocardiograms. Block diagram of Pan Tompkins algorithm steps shown in Figure 2.

Figure 2: Block diagram of Pan Tompkins algorithm.
The methodology followed is that the ECG is passed through a low-pass and a high-pass filter in order to remove noise from the signal. Then the filtered signal is passed through derivative, squaring and window integration phases. Finally, a thresholding technique is applied and the Q, R, S-peaks are detected. The main drawback of the Pan Tompkins algorithm is they do not adapt to the variations in the QRS complex structure and a disadvantage of a band pass filter technique is which prefixes the bandwidth is that it does not accurately provide useful information for the time-varying morphology of the QRS complex. Thus it is required to have a general adaptive method that fights the limitations of the mentioned problems which covers the spectral and temporal variations in the QRS morphology efficiently.
Derivative based QRS detector
An initial filter stage is generally used by all QRS detection algorithms since the typical frequency components of QRS complex ranges from around 5 Hz to 25 Hz. This is done before the actual QRS detection to suppress the remaining features in the ECG signal which are the P, T waves, noise and baseline drift. Noise and baseline drifts are suppressed by using a low pass filter while the other components like P and T waves are suppressed using a high pass filter. A block diagram of derivative based QRS detector is shown in Figure 3. Therefore, both the low and high pass filters combined together results into the application of a band pass filter with the cut off frequencies of 5 Hz and 25 Hz for QRS detection.

Figure 3: Block diagram of derivative based QRS detector.
The high and low pass filtering is carried out separately for many algorithms. Some algorithms used only high pass filters. Then the QRS complex is detected using the comparison with the threshold using the filtered signals. Thus the QRS complex feature of having a large slope was used for its detection. Its drawback is that the derivative based algorithm did miss many QRS complexes which was indicated by the number of false negatives values. The derivative based QRS detector detector is not robust to noisy signals and cannot be flexible in analyzing the time varying structure of ECG data. So, the performance capability of the derivative based QRS detector was reduced.
Feature Selection
The detection of R peak in the ECG wave is the first step of feature extraction. The R peak in the signal from the Modified Lead II (MLII) lead has the largest amplitude among all the waves compared to other leads. The second feature considered is the normal QRS complex that indicates that the electrical impulse has progressed normally from the bundle of this to the Purkinje network through the right and left bundle branches and that normal depolarization of the right and left ventricles has occurred. The significance of QRS complex is that the energy of the QRS complex lies between 3 Hz and 40 Hz. The amplitude and timing information for a normal ECG is given in Tables 1 and 2.
| Wave | Amplitude |
|---|---|
| P wave | 0.25 mV |
| R wave | 1.6 mV |
| Q wave | 25% of R wave |
| T wave | 0.1 to 0.5 mV |
Table 1. Amplitude values for normal ECG.
| Interval | Duration |
|---|---|
| PR wave | 0.12-0.2 sec |
| QT wave | 0.35-0.44 sec |
| ST wave | 0.05-0.15 sec |
| P wave interval | 0.11 sec |
Table 2. Timing information for normal ECG.
Signal classification system: The Adaptive Neuro Fuzzy Inference System is based on Sugeno type fuzzy inference system and consists of five layers of nodes, in which the first and the fourth layers consist of adaptive nodes while the second, third and fifth layers consist of fixed nodes. The adaptive nodes are associated with their respective parameters, get duly updated with each subsequent iterations [8]
Rule 1: If (x is A1) and (y is B1) then (f1 = p1x + q1y + r1)
Rule 2: If (x is A2) and (y is B2) then (f2 = p2x + q2y + r2)
where x and y are the inputs, Ai and Bi are the fuzzy sets, fi are the outputs within the fuzzy region specified by the fuzzy rule, pi, qi and ri are the design parameters that are determined during the training process. The ANFIS architecture used to implement these two rules was based on the work by Nazmy et al. [8] is shown in Figure 4.

Figure 4: ANFIS structure.
Layer 1 (L1): Each node generates the membership grades of a linguistic label.
Layer 2 (L2): Each node calculates the firing strength of each rule using the min or prod operator. In general, any other fuzzy AND operation can be used.
Layer 3 (L3): The nodes calculate the ratios of the rule’s firing strength to the sum of all the rules firing strength. The result is a normalised firing strength.
Layer 4 (L4): The nodes compute a parameter function on the layer 3 output. Parameters in this layer are called consequent parameters.
Layer 5 (L5): Normally a single node that aggregates the overall output as the summation of all incoming signals.
The ANFIS learning algorithm
When the premise parameters are fixed, the overall output is a linear combination of the consequent parameters. In symbols, the output f can be written as
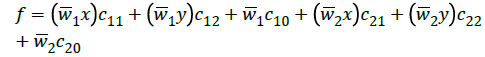
Which is linear in the consequent parameters cij (i=1,2¸ j=0,1,2). A hybrid algorithm adjusts the consequent parameters cij in a forward pass and the premise parameters {ai, bi, ci} in a backward pass. In the forward pass the network inputs propagate forward until layer 4, where the consequent parameters are identified by the least-squares method. In the backward pass, the error signals propagate backwards and the premise parameters are updated by gradient descent because the update rules for the premise and consequent parameters are decoupled in the hybrid learning rule, a computational speedup may be possible by using variants of the gradient method or other optimisation techniques on the premise parameters.
Proposed Method
A number of approaches, varying in complexity and precision, have been developed for R-peak detection. In this paper Rpeak detection for multiwavelet transform technique has been proposed as shown in Figure 5.

Figure 5: QRS Detection using Multiwavelet transform technique.
ECG signal source
The data considered for the simulations in this work have been taken from the benchmark database called the MIT-BIH Arrhythmia Database available online that has around about 4000 ECG recordings obtained from patients in the Beth Israel Hospital Arrhythmia Laboratory between 1975 and 1979 [11]. This arrhythmia database consists of 48-half-hour ECG recordings which were digitized at 360 Hz (samples per second per channel). These samples have 11-bit resolution. The source of the electrocardiogram included in the MIT-BIH Arrhythmia Database were obtained by the Beth Israel Hospital Arrhythmia Laboratory. These data sets have been used as an input signal [5].
Pre-processing
The baseline wandering and the power-line interference are the most substantial noises and can strongly affect the ECG signal analysis. Baseline wandering that arises due to respiration lies between 0.15 and 0.3 Hz. The power-line interference is a narrow-band noise centered at 60 Hz with a bandwidth of less than 1 Hz. The ECG signals were pre-processed by filtering it to remove the high frequency noise, the power line interferences and the baseline wander and hence enhancing the signal standard, and exclude the equipment and the environmental changes [12,13].
QRS detection
QRS detection is one of the fundamental issue in the analysis of Electrocardiographic signal. The QRS complex consists of three characteristic points within one cardiac cycle denoted as Q, R and S. In order to identify the peaks, precise details of the signal are selected. The identification of R peak is the first step of feature extraction. Most of the energy of the QRS complex lies between 3 Hz and 40 Hz. The detection of the QRS complex is based on Wavelet Transform. This is because modulus maxima and zero crossings of the Wavelet Transform correspond to the sharp edges in the signal [14,15].
Feature extraction
The Wavelet Transform is a very promising technique for time frequency analysis. By decomposing signal into elementary building blocks that are well localized both in time and frequency, the WT can describe the particular regularity of definite pattern [6]. This feature can be used to distinguish ECG waves from artifacts and baseline drift. Wavelets are used to extract the significant information from the ECG signal. The WT is a powerful tool of signal processing for its multi resolution possibilities. The WT is suitable for application of non-stationary signal, whose frequency response varies with time.
The discrete wavelet transform represents the digital signal with respect to time using various filtering techniques. Various cutoff frequencies at multiple scales are used to analyze the signal. When applied a data signal as an input to the discrete wavelet transform it gives back a same length data vector. It distinguishes the signal as a set of orthogonal wavelet functions. Hence, the signal is decomposed with the wavelet coefficients same or less as the number of data points. For the discrete wavelet transform, set of wavelet scales which are discrete in form are used. Its difference as compared to the continuous wavelet transform is that it breaks down the signal into orthogonal group of wavelets and when applied in the discrete time it is known as discrete time continuous wavelet transform. For the discrete transform redundancy is less [16]. Figure 6 shows the three level wavelet decomposition tree.

Figure 6: Three level wavelet decomposition tree.
The desired level is reached by continuous filtering and decimation process [17-19]. The largest number of level is obtained through signal length. All coefficients from the end stage of decomposition are connected obtaining the DWT of the original input signal [10]. Process of reconstruction is reverse in nature to the process of decomposition. The coefficients are up sampled by two, passed through filters and then added. The process of decomposition represented in Figure 7.

Figure 7: Three level wavelet reconstruction tree.
Signal classification
The information about the R Peak and QRS complex obtained is very useful for ECG diagnosis, analysis, classification and identification of performance. The QRS complex is also used for beat detection and the R-R interval estimation. Fuzzy logic system is a powerful pattern recognition tool. It is defined as system that can be trained to learn the relationships that exist between input and output data, including nonlinear relationships. Fuzziness concepts have enrolled the depiction of possibilities among “yes” and “no” decisions through membership functions and decision rules. Fuzzy logic (FL) includes fuzzy sets definitions, fuzzy rules, fuzzy interference engine design and defuzzification. The input variable is defined as R-R interval and the two output variables are defined as “heartbeat case”, namely, normal, abnormal as shown in Figure 8.

Figure 8: Signal classification block.
Parameters estimation
To fully evaluate the performance of detection algorithm, several values are introduced including false negative (FN) which means failing to detect a true beat, and false positive (FP) which represents a false beat detection and true positive (TP) is the total number of QRS correctly detected by the algorithm. By using FN and FP, the sensitivity (Se), positive prediction (+P) and detection error rate (DER) can be calculated using the Equations 1-3.
Sensitivity (Se): The percentage of heartbeats correctly identified by the algorithm.
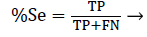 (1)
(1)
Positive Prediction (+P): The detection rate given by the algorithm corresponding to marks made by the specialist.
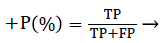 (2)
(2)
Detection Error Rate (DER): The percentage of false detections over the total number of detected heartbeats.
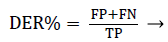 (3)
(3)
Simulation Results and Discussion
For record 100
Arrhythmia datasets were downloaded from the MIT-BIH database for QRS Detection using multiwavelet transform. Each of the electrocardiogram records has the following specifications: signal length is 3600 samples, sampling rate is 360 Hz. The above Figure 9 shows an input of 100 m electrocardiogram record

Figure 9: Input signal for record 100.
In pre-processing stage, signal filtration used to remove the noise and any existing artifact. In this process a raw ECG signal using four recursive calls of the Daubechies D4 wavelet transform is shown in Figure 10. The absolute values of the processed signal are then filtered using a threshold filtering.

Figure 10: Error signal for record 100.
After the removal of baseline wander and powerline interference noises, the signal has been reconstructed. The reconstructed signal is shown in Figure 11.

Figure 11: Denoised signal for record 100.
In QRS detection peak tracing and feature extraction is important process. It is used to detect abnormalities in the signals. Figure 12 shows peak tracing and feature extraction for ECG record 100.

Figure 12: Feature extraction of ECG Record 100.
R-peak detection algorithm uses a discrete wavelet transform, specifically the Daubechies D4. Figure 13 illustrates the Rpeak detection algorithm for one exemplary ECG signal from the MIT-BIH database.
The obtained results are summarized in Table 3. The 43 records were considered from the MIT BIH database from which 23 data records were considered for training data and 20 were considered as testing data. The results were given to Dr. S. Easwaramurthy of Revathy Medical Hospital, Tirupur for validation.

Figure 13: R peak detection.
| Record No. | According to doctor | According To the proposed methodology |
|---|---|---|
| 105 | Normal | Normal |
| 106 | Normal | Normal |
| 107 | Normal | Normal |
| 108 | Normal | Normal |
| 109 | Normal | Normal |
| 111 | Abnormal | Abnormal |
| 112 | Normal | Abnormal |
| 113 | Abnormal | Abnormal |
| 114 | Abnormal | Abnormal |
| 115 | Normal | Normal |
| 116 | Normal | Normal |
| 117 | Abnormal | Abnormal |
| 118 | Abnormal | Abnormal |
| 119 | Abnormal | Abnormal |
| 121 | Abnormal | Abnormal |
| 122 | Normal | Normal |
| 123 | Normal | Normal |
| 124 | Normal | Normal |
| 200 | Abnormal | Abnormal |
| 201 | Normal | Normal |
| 202 | Normal | Normal |
| 203 | Abnormal | Normal |
| 205 | Normal | Normal |
| 207 | Abnormal | Abnormal |
| 208 | Abnormal | Abnormal |
| 209 | Normal | Normal |
| 210 | Abnormal | Abnormal |
| 212 | Abnormal | Abnormal |
| 213 | Abnormal | Abnormal |
| 214 | Abnormal | Abnormal |
| 215 | Normal | Normal |
| 217 | Abnormal | Abnormal |
| 219 | Normal | Abnormal |
| 220 | Normal | Normal |
| 221 | Normal | Normal |
| 222 | Abnormal | Abnormal |
| 223 | Normal | Normal |
| 228 | Abnormal | Abnormal |
| 230 | Normal | Normal |
| 231 | Normal | Normal |
| 232 | Normal | Normal |
| 233 | Normal | Normal |
| 234 | Abnormal | Abnormal |
Table 3. Data use for training and validation.
Table 4 shows result of comparison of sensitivity, positive prediction and detection error of existing QRS detection methods and multiwavelet based QRS detection of ECG signals. The result of multiwavelet based QRS detection gives better results compared to all other existing methods. The proposed methodology performs better than the existing methods, namely, Pan Tompkins in terms of sensitivity by 1.50%, derivative based method by 1.42% and Wavelet based method by 0.5%. This is achieved due to the unique properties of multiwavelet transform which helps in better QRS detection namely such as orthogonality, symmetry and short support.
| Method used | Database used | % Sensitivity | % Positive prediction | % Detection error |
|---|---|---|---|---|
| Pan Tompkins | MIT BIH | 96.55 | 90.304 | 9.572 |
| Derivative based | MIT BIH | 97.124 | 92.368 | 7.486 |
| Wavelet based | MIT BIH | 98.01 | 95.72 | 5.486 |
| Multi wavelet based | MIT BIH | 98.5 | 97 | 4.428 |
Table 4. Parameter Comparison of QRS detection methods.
Conclusion
QRS detection technique for electrocardiogram signals using Pan Tompkins algorithm, derivative based peak detection and wavelet transform based techniques is proposed. The main characteristics concerned in QRS detection are sensitivity, accuracy, positive prediction and detection error. Pan Tompkins does not accurately provide useful information for the timevarying morphology of the QRS complex. The derivative based QRS detector is not robust to noisy signals and cannot be flexible in analyzing the time varying structure of ECG data. Wavelet transform helps in detection of small variations in the heart signal, characterization of ECG features in frequency and time domains and separation of ECG waves from noise, artifacts and baseline drifts. Multi wavelet transform technique achieves better performance results compared to Pan Tompkins and derivative based peak detection. Thus the accuracy of the proposed methodology is 93.35%, specificity is 90% and sensitivity of 98.50%.
Future Scope
In future, signal decomposition and feature extraction can be done by adaptive multiwavelet transform technique. Adaptive multiwavelet transform technique can be used in QRS detection of electrocardiogram signal to improve the performance characteristics. Also, advanced soft computing techniques may be included in the work to classify more varieties of arrhythmia automatically.
Acknowledgement
I would like profusely thank Dr. S. Easwaramurthy of Revathy Medical Hospital, Tirupur for his help and suggestions.
References
- Rezazadeh F, Seno SAH. A new heart arrhythmia’s detection algorithm. J Knowledge Manag Econom Informa Technol 2013; 3: 1-22.
- Harikumar R, Shivappriya SN. Analysis of QRS detection algorithm for cardiac abnormalities. Int J Soft Comput Eng 2011; 1: 80-88.
- Ilankumaran V, ThamaraiSelvi S. Ventricular arrhythmias detection using wavelet decomposition. Int J Comput Appl 2011; 20: 11-18.
- Chinchkhede KD, Yadav G, Hirekhan SR, Solanke D. On the implementation of FIR filter with various windows for enhancement of ECG signal. Int J Eng Sci 2011; 3: 2031-2040.
- Meyer C, Gavela JF, Harris M. Combining algorithms in automatic detection of QRS complexes in ECG signals. IEEE Transact Informa Technol Biomed 2006; 10: 468-475.
- Arzeno NM, Deng ZD, Poon CS. Analysis of first-derivative based QRS detection algorithms. IEEE Transact Biomed Eng 2008; 55: 478-484.
- Bagde S, Raikwar P. detection of QRS complexes of ECG waveform based on empirical mode decomposition using MATLAB. Int J Eng Innovat Technol 2012; 1: 14-17.
- Nazmy TM, El-Messiry H, Al-Bokhity B. Adaptive neuro-fuzzy inference system for classification of ECG signals. 7th International Conference on Informatics and Systems (INFOS), 2010.
- Biradar B, Patil G, Telgane S, Hiremath SG. Wavelet transform based on QRS detection using diodic algorithm. Int J Res Eng Technol 2014; 3: 909-915.
- Smital L, Vitek M, Kozumplik J, Provaznik Ivo. Adaptive wavelet wiener filtering of ECG signals. IEEE Transact Biomed Eng 2013; 60: 437-445.
- Moody GB, Mark R. MIT-BIH arrhythmia database directory, MITBIH Database Distribution, Harvard–MIT Division of Health Sciences and Technology. Massachusetts Institute of Technology, Cambridge, Massachusetts, USA, 1992.
- Ramakrishnan AG, Prathosh AP, Ananthapadmanabha TV. Threshold-independent QRS detection using the dynamic plosion index. IEEE Signal Process Lett 2014; 21: 554-558.
- Vullings R, de Vries B, Bergmans JWM. An adaptive Kalman filter for ECG signal Enhancement. IEEE Transact Biomed Eng 2011; 58: 1094-1104.
- Kohler BU, Hennig C, Orglmeister R. QRS detection using zero crossing counts. Progress Biomed Res 2003; 8: 138-145.
- Ravanshad N, Rezaee-Dehsorkh H, Lotfi R, Lian Y. A level-crossing based QRS-detection algorithm for wearable ECG sensors. IEEE J Biomed Health Informa 2014; 18: 183-192.
- Moazami-Goudarzi M, Taheri A, Pooyan M, Mahboobi R. Wavelet and biological signal processing. Int J Informa Technol 2006; 2: 264-272.
- Jaswal G, Parmar R, Kaul A. QRS detection using wavelet transform. Int J Eng Adv Technol 2012; 1: 1-5.
- Varshney M, Chandrakar C, Sharma M. A survey on feature extraction and classification of ECG signal. Int J Adv Res Elect Electron Instrument Eng 2014; 3: 6572-6576.
- Moazami-Goudarzi M, Moradi MH. Electrocardiogram signal compression using multiwavelet transform. World Acad Sci Eng Technol 2005; 12: 188- 192.