ISSN: 0970-938X (Print) | 0976-1683 (Electronic)
Biomedical Research
An International Journal of Medical Sciences
Research Article - Biomedical Research (2017) Volume 28, Issue 4
Diabetic retinopathy screening system: A validation analysis with multiple fundus image databases
1Department of Electronics and Communication Engineering, St. Joseph’s Institute of Technology, Chennai, India
2Department of Electronics and Communication Engineering, BS Abdur Rahman University, Chennai, Tamil Nadu, India
- *Corresponding Author:
- Annie Grace Vimala GS
Department of Electronics and Communication Engineering
St. Joseph’s Institute of Technology, India
Accepted on August 24, 2016
Diabetic Retinopathy (DR) is one of the most common health problems of long-standing diabetes. It is a progressive disease and finally results in blindness. Early detection of diabetic retinopathy can prevent the damage to the retina and vision loss or at least slow its progression. The aim of the present study was to develop a Computer Aided Diagnostic System (CAD) in order to diagnose diabetic retinopathy by extracting blood vessels, optic disc and exudates from retinal digital fundus images and to validate the system with multiple image databases. The digital color fundus images obtained from 60 Indian women, 40 images from Digital Retinal Images for Vessel Extraction (DRIVE) database, 40 images from Structured Analysis of Retina (STARE) database and 89 images from DIARETDB1 database were used for the present study. For each image the hand drawn ‘ground truth’ result was collected. Then the quantitative analysis of the proposed algorithm with Support Vector Machine (SVM) classifier has been carried out and the results are compared against the ‘ground truth’. The extracted features such as mean intensity, mean area of the segmented region, number of segmented regions and solidity were displayed significant (p<0.001) differences between normal and diabetic retinopathy group for all test image dataset. The developed Computer-Aided Drafting (CAD) for diabetic retinopathy screening is validated with publicly available fundus image databases containing the ‘ground truth’ collected from several experts and comparison with private database. The proposed Support Vector Machine (SVM) classifier gives the sensitivity, specificity and accuracy values of around 92%. Hence, the proposed Computer-Aided Drafting (CAD) system could be useful for diabetic retinopathy screening.
Keywords
Diabetic retinopathy, Fundus images, Computer-aided drafting system, Screening tool, Support vector machine classifier, Haemorrhages, Micro aneurysms.
Introduction
Diabetic retinopathy (DR) is one of the global health problems and it is an impediment of diabetes that is instigated by injury to the tiny blood vessels of the retinal region [1]. Loss of vision or blindness is a result of diabetic retinopathy and it ensues in around 75%-80% of the diabetic patient [2]. Diabetic retinopathy is the major cause of visual blindness in the people aged between 20 and 60 years. Nevertheless, detection at the premature stage and hasty treatment could avert the vision loss instigated by diabetic retinopathy. Primary detection of Diabetic retinopathy is a challenging process, since the patients with this kind of problem will have no symptoms until vision loss occurs. Henceforth, individuals with diabetes ought to have an extensive retina screening once in a year consistently. In order to detect diabetic retinopathy, a retinography is performed, which entails in capturing the structures within the eye (retina) by either dilating the pupil or without dilation. Typically, the ophthalmologists diagnose diabetic retinopathy based on features such as the blood vessels, exudates, haemorrhages, micro aneurysms and texture [2]. Colour fundus photography captures the retina of the eye with exclusively designed cameras, which is treated as a standard means of detecting premature signs of diabetic retinopathy. The fundus imaging has an essential starring role in diabetes monitoring since the events of retinal abnormalities are common and their consequences are severe. Since the eye fundus is sensitive to vascular abnormalities, the fundus imaging is additionally considered as a contender for non-invasive screening. The achievement of this kind of screening methodology relies upon the precise fundus image capture, and particularly on exact and consistent image processing algorithms for identifying the abnormalities. As indicated by the clinical discoveries done by Viswanath et al. [3], in most developing nations, there are limited numbers of specialists to examine diabetic retinopathy in screening programs. Hence, there is an immediate need for developing an automated screening system for diabetic retinopathy diagnosis.
Various image processing algorithms have been proposed for fundus image analysis by several research groups [4-20]. But, it is difficult to identify the reliability and accuracy of the methods in light of the fact that there exists no universally recognized fundus image database and assessment decorum. With an extensively recognized protocol, it would be feasible to validate the maturity and state-of-the-art of the recent methodologies. Many of the existing systems are not equipped to be transferred from research labs to medical practices because of the performance and accuracy in detection; also most of the systems have not been tested with the real dataset. Hence, the present study is focusing to develop a Computer Aided Diagnostic system (CAD) in order to diagnose diabetic retinopathy by extracting blood vessels, optic disc and exudates from retinal digital fundus images by considering above mentioned problems in the existing systems. This means, the system is developed in order to address performance related issues, detection accuracy and real patient image dataset vs. standard database images within a low cost background.
Materials and Methods
In this section, the description of the datasets used and the detailed methods that are used for diabetic retinopathy detection is discussed.
Data description
The present study was performed on 60 Indian female subjects aged 50-85 years. An eye screening camp for diagnosis of diabetic retinopathy was organized in an eye care center, Chennai, India, in the year 2012. Prior to the investigation, a detailed questionnaire was filled in by the patients and signed informed voluntary consent form. For each female subject, a digital fundus image of the affected eye was captured using a digital fundus camera in combination with Visupac image management software system. The acquired digital fundus images were of size 640 × 480 and stored on the local hard drive of a computer system for further analysis. Then the stored images were visually analysed and marked the abnormal regions (ground truth) by an experienced ophthalmologist and grouped into following:
Group I: Normal
Group II: Diabetic retinopathy
Other than the private dataset, the publicly available retinal fundus image databases named DRIVE i.e. Digital Retinal Images for Vessel Extraction [10] and STARE i.e. Structured Analysis of Retina [17] was utilized for comparative analysis; DIARETDB1 i.e. Standard Diabetic Retinopathy Database Calibration level-1 [18] database was utilized for testing the exudate detection method.
The following are the details of these databases:
(i) DRIVE database: This database was containing 40 colour fundus images with their corresponding ‘ground truth’ vessel segmented images. Each image was available in digital form of size 768 × 584 with 24 bits per pixel resolution.
(ii) STARE database: This database contains 40 retinal colour fundus images with their corresponding ground truth vessel segmented images. Each image was available in digital form of size 605 × 700 with 24 bits per pixel resolution.
(iii) DIARETDB1 database: This database consists of 89 colour retinal fundus images out of which 84 images contain mild signs of diabetic retinopathy, and 5 images were considered as normal, which did not contain any signs of debased on the mean visual observation score. Each image was available in digital form of size 1500 × 1152 with 24 bits per pixel resolution. The ground truth result provided with the database was based on expert selected findings related to diabetic retinopathy and normal fundus structures.
Automatic detection system
Pre-processing was the first in the image processing section which consists of 3 steps:
(a) Color normalization
(b) Edge enhancement
(c) Color space conversion
The detailed procedure prescribed in our earlier studies [21,22] arrived based on TEA (Trabecular Enrichment Approach) method detailed in [23,24] was applied to each image in the database of 229 fundus images (60 images available in the dataset-1, 169 images available in a dataset-2: 40 from DRIVE, 40 from STARE and 89 from DIARETDB1). Then intensity values were normalized to 0 to 1 scale for all the images. The next stage was to binarize all the pre-processed retinal fundus images using an empirically arrived threshold value (T=0.78). The output binary images contain many regions such as blood vessels, exudates, optic disc, haemorrhages along with some irrelevant noisy regions. In order to retain only exudates and similar regions and further classification process, the following steps were carried out [21]:
1. Removal of the blood vessel region, which does not contain much information about exudates.
2. Removal of optic disc, Optic disc, which is the entrance of blood vessels and optic nerve to the retina.
3. Removal of the retinal border.
The binary image now contains only exudates and noisy regions which are similar to exudates. This image is considered for further analysis. Finally, the morphological features such as area, number of objects present in the exudates only binary images, Eccentricity, extent, orientation, convex area of the polygon and solidity based on our earlier study [21,22]. The RBF-kernel based Support Vector Machine (SVM) classifier was used to diagnose diabetic retinopathy as detailed in our earlier study [21]. Sixty per cent of images in each database were used for training the classifier and remaining 40% of the images in each database were used for testing the results against ‘ground truth’ result provided.
Evaluation protocol
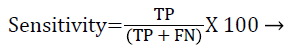
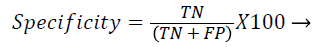
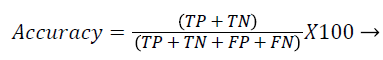
Each database image was independently evaluated because of the dimensional variations in the database images. The outcome of the proposed method was compared against the ophthalmologists ‘ground truth’ outcomes. The Support Vector Machine (SVM) classifier output was compared against the ground truth results. In the current literature, the sensitivity and specificity values are typically reported as they correspond to the modern medical practice and have direct interpretations in the medical terms. Sensitivity value depends on the diseased population and specificity on the healthy population (Equations 1 and 2). Hence, sensitivity, specificity and accuracy (Equation 3) values are evaluated to validate the proposed approach. Additionally, the computation time for ‘ground truth’ and proposed methods are evaluated.
 (1)
(1)
 (2)
(2)
 (3)
(3)
Where,
TP-True positive: actual diabetic retinopathy cases are predicted as diabetic retinopathy.
TN-True negative: the process in which image would be predicted as normal, when actually it is the condition.
FP-False positive: the condition of incorrect diabetic retinopathy prediction when the image would be normal in reality.
FN-False negative: the condition which is normal prediction, when the image is diabetic retinopathy in reality.
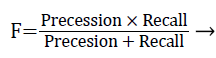
The performance of the proposed exudates extraction technique was evaluated with the ‘ground truth’ results. The overlapping binary region between the computed regions and the ‘hand drawn’ ground truth results are evaluated be computing F-score using pixel wise precision and recall measures shown in Equation 4.
 (4)
(4)
Where, precession is the fractions of segmented pixels are relevant and recall is the fraction of relevant pixels that are segmented.
For an accurate comparison, the sensitivity and specificity values must be joined into a form which can designate the behaviour over the different combinations of the values. A student’s t-test was performed to find the significance of the extracted image variables in the contribution of classification of normal and diabetic retinopathy group. The extracted morphological image features were analysed using the SPSS software package.
Results
The proposed system is developed in MATLAB platform and it uses 4 different image dataset (DRIVE, STARE, DIARETDB1 and private database). The private database includes 60 color fundus images. Out of 60 color fundus images, 34 images hold at least mild signs of diabetic retinopathy. The remaining 26 images are considered as normal images, which do not contain any signs of diabetic retinopathy.
The procedures detailed in the methodology section for 4 different image dataset were applied. The image processing framework involved in the extraction of the blood vessel with sample experimental results is shown in Figure 1. Then the morphological features were extracted and displayed in Table 1. The extracted features such as mean intensity, mean area of the segmented region, number of segmented regions and solidity were displayed significant (p<0.001) differences between normal and diabetic retinopathy group for all test image dataset.

Figure 1. Steps involved in the proposed Computer Aided Diagnostic system (CAD) system for diabetic retinopathy diagnosis.
| Variables/groups | Normal group | DR group | p-value |
|---|---|---|---|
| Retinal image parameters extracted from private camp data | |||
| Mean intensity≠ | 0.59 ± 0.18 | 0.79 ± 0.12 | <0.000 |
| Mean area (%) | 46.6 ± 11.4 | 14.2 ± 9.3 | <0.000 |
| No. of objects | 42.3 ± 12.2 | 15.6 ± 4.9 | <0.000 |
| Solidity | 0.21 ± 0.11 | 0.76 ± 0.03 | <0.000 |
| Retinal image parameters extracted from ‘DRIVE’ database | |||
| Mean intensity≠ | 0.62 ± 0.14 | 0.81 ± 0.12 | <0.000 |
| Mean area (%) | 48.1 ± 9.2 | 19.3 ± 11.1 | <0.000 |
| No. of objects | 43.3 ± 11.4 | 16.8 ± 5.6 | <0.000 |
| Solidity | 0.32 ± 0.14 | 0.64 ± 0.11 | <0.000 |
| Retinal image parameters extracted from ‘STARE’ database | |||
| Mean intensity≠ | 0.56 ± 0.15 | 0.77 ± 0.14 | <0.000 |
| Mean area (%) | 44.2 ± 10.6 | 17.2 ± 10.7 | <0.000 |
| No. of objects | 36.2 ± 11.4 | 17.6 ± 6.4 | <0.000 |
| Solidity | 0.22 ± 0.06 | 0.67 ± 0.09 | <0.000 |
| Retinal image parameters extracted from ‘DIARETDB1’ database | |||
| Mean intensity≠ | 0.61 ± 0.21 | 0.78 ± 0.08 | <0.000 |
| Mean area (%) | 45.9 ± 10.7 | 17.7 ± 10.4 | <0.000 |
| No. of objects | 40.2 ± 12.2 | 15.8 ± 6.4 | <0.000 |
| Solidity | 0.20 ± 0.06 | 0.62 ± 0.03 | <0.000 |
| ≠Normalized the intensity values between 0 and 1. DR: Diabetic Retinopathy; DRIVE: Digital Retinal Images for Vessel Extraction; STARE: Structured Analysis of Retina; DIARETDB1: Standard Diabetic Retinopathy Database Calibration level-1. |
|||
Table 1. The morphological features extracted from the retinal images.
The performance of the proposed framework was assessed quantitatively by comparing the outcome of extractions with ophthalmologists’ ‘hand-drawn’ ground-truth images. The performance of the diabetic retinopathy identification systems was evaluated with sensitivity, specificity and accuracy values for all the 4 test image dataset and the outcomes are reported in Table 2. The performance parameter shows more or less similar values for all the test image dataset (standard databases as well as private dataset). The performance of computation time of the proposed method with ‘ground-truth’ and few other existing methods are demonstrated in Table 3. The outcome indicates that the proposed framework for diabetic retinopathy detection performs much faster than the other image processing based system as well as ‘ground-truth’ system.
| Image database/classifier result | Sensitivity (%) | Specificity (%) | Accuracy (%) | F-score |
|---|---|---|---|---|
| DRIVE | 91.6 | 90.3 | 92.4 | 0.82 |
| STARE | 90.7 | 91.5 | 91.1 | 0.81 |
| DIARETDB1 | 91.8 | 89.9 | 92.1 | 0.71 |
| Proposed camp | 92.0 | 91.2 | 92.2 | 0.89 |
| DRIVE: Digital Retinal Images for Vessel Extraction; STARE: Structured Analysis of Retina; DIARETDB1: Standard Diabetic Retinopathy Database Calibration level-1. | ||||
Table 2. Comparison of the Support Vector Machine (SVM) classifier results for 4 different image databases.
| Algorithms | Computation time (seconds) |
|---|---|
| Ground truth | 900.6 |
| OAMO [19] | 120.7 |
| DFIR [20] | 101.8 |
| Proposed | 78.3 |
| DFIR: Diabetic Fundus Image Recuperation Approach; OAMO: Optimally Adjusted Morphological Operator. | |
Table 3. Performance time comparison of the proposed and few other methods vs. ‘ground truth’.
Discussion
The development of Computer Aided Detection (CAD) system based on medical image processing algorithms to a mature level where they are equipped to be transferred from research labs to medical practices requires well designed algorithm and benchmarking databases. The proposed Computer Aided Detection (CAD) system stepped towards the standardized evaluation of diabetic retinopathy by introducing our own dataset as well as publicly available databases such as DRIVE, STARE, and DIARETDB1 and the assessment framework. The framework incorporated the image processing algorithm which extracts the exudates objects by subtracting the independently segmented blood vessels, optical disc and outer border of retina from the segmented morphology.
The proposed Computer Aided Detection (CAD) system is expedient on account of its utilization of widely available fundus images with more accurate and faster computation. The extracted morphological parameters demonstrated significance (p<0.001) the differences between normal and diabetic retinopathy group. In the normal fundus images, the mean intensity values in the segmented region were comparatively lower than the diabetic retinopathy class; the mean intensity value was much higher in diabetic retinopathy images because of the presence of hard exudates as shown in Table 1. The similar kind of variations was observed when the energy values were extracted using wavelet based approach [25]. But, the very minor level of variations was noticed when the standard database images were used shown in Table 2. When the computation performance time was considered, the developed Computer Aided Detection (CAD) system with the proposed image processing framework outperformed the existing image processing based systems (Diabetic Fundus Image Recuperation Approach (DFIR), Optimally Adjusted Morphological Operator (OAMO)) as well as the radiologists’ ‘hand-drawn’ ground truth methods as shown in Table 3. That is, the proposed system performs 1.3 times, 1.5 times and 11.5 times faster than Diabetic Fundus Image Recuperation Approach (DFIR) [20], Optimally Adjusted Morphological Operator (OAMO) [19] and ‘ground truth’ methods respectively. The performance of the proposed Computer Aided Detection (CAD) system with Support Vector Machine (SVM) classifier demonstrated higher rates of sensitivity (92%), specificity (91%) and accuracy (92%) for classification of diabetic retinopathy. The comparison results of various Computer Aided Detection (CAD) system reported in the literature are displayed in Table 4.
| Author (year) | Dataset | Method | Key results |
|---|---|---|---|
| Figueiredo et al. [26] | MESSIDOR, DIARETB0, DIARETB1, HEI-MED. | Hessian Multi-scale analysis (HEM) with binary classifier. | Performance per frame of multi-scale analysis detector produced 93% sensitivity and 89% specificity. HEM detector produced 86% sensitivity, 90% specificity. |
| Somasundaram et al. [27] | DIARETDB1 | DFIR and sliding window technique with SVM classifier. | DFIR method achieved up to 35 per cent improvement in sensitivity compared to the state of the art methods. |
| Pedre et al. [28] | Real time | Introduced a pre-processing filter. | The automated grading system shows high sensitivity. |
| Harangi et al. [29] | DIARETDB1 | Grayscale morphological operators with SVM Classifier. | Achieved higher F-score with image level and pixel level. |
| Karthikeyan et al. [30] | MESSIDOR, Real time | Trace transform vision modelling, an SVM classifier with PNN-GA. | Classification accuracy was obtained for SVM and PNN-GA as 99% and 99% respectively. |
| Mishra et al. [31] | Real time | KNN classifier. | This algorithm is used to extract features like blood vessels, exudates, and optic disc and to find level of severity. This algorithm is independent of camera used because the calculation does not depend on size of pixels, or dimension or format of the image. |
| Pradeep et al. [32] | Real time | Ensemble classifier. | Classification accuracy produced was 96%. |
| Balint et al. [33] | MESSIDOR | Ensemble detector. | MA detector serves as the main component in DR System. The proposed system achieves AUC value of 0.90. The accuracy achieved was very high. |
| MESSIDOR: Methods to Evaluate Segmentation and Indexing Techniques in the Field of Retinal Ophthalmology; SVM: Support Vector Machine; KNN: K Nearest Neighbours; HEM: Hessian Multi-scale analysis; PNN: Probabilistic Neural Network; DFIR: Diabetic Fundus Image Recuperation Approach; DIARETDB1: Standard Diabetic Retinopathy Database Calibration level-1; DIARETB0: Standard Diabetic Retinopathy Database Calibration level-0. | |||
Table 4. The result of recently developed computer aided diabetic retinopathy detection system.
In conclusion, the developed Computer Aided Detection (CAD) for diabetic retinopathy screening is validated with publicly available fundus image databases such as DIARETDB1, DRIVE and STARE, containing the ‘ground truth’ collected from several experts and comparison with private database. The proposed system performs 1.3 times, 1.5 times and 11.5 times faster than Diabetic Fundus Image Recuperation Approach (DFIR), Optimally Adjusted Morphological Operator (OAMO) and ‘ground truth’ methods respectively. The proposed Support Vector Machine (SVM) classifier gives best result for sensitivity and specificity as compared with other methods. So, this could be useful for diabetic retinopathy screening.
References
- Frank R. Diabetic retinopathy. Prog Retin Eye Res 1995; 14: 361-392.
- National Institute of Health-Facts about diabetic retinopathy disease. Nat Eye Inst Health Info 2009.
- Viswanath K, Murray, McGavin DD. Diabetic retinopathy-clinical findings and management. Community Eye Health 2003; 16: 21-24.
- Karnowski TP, Govindasamy VP, Tobin KW, Chaum E, Abramoff MD. Retina lesion and micro aneurysm segmentation using morphological reconstruction methods with ground-truth data. Conf Proc IEEE Eng Med BioI Soc 2008; 1: 5433-5436.
- Langroudi MN, Sadjedi H. A new method for automatic detection and diagnosis of retinopathy diseases in colour fundus images based on morphology. Bioinform biomed Technol 2010; 134 -138.
- Acharya UR, Lim CM, Ng EY, Chee C, Tamura T. Computer-based detection of diabetes retinopathy stages using digital fundus images. Proc Inst Mech Eng H 2009; 223: 545-553.
- Singh N, Tripathi R. Automated early detection of diabetic retinopathy using image analysis techniques. Int J Comput App 2010; 8: 18-23.
- Niemeijer M, van Ginneken B, Staal J, Suttorp-Schulten MS, Abramoff MD. Automatic detection of red lesions in digital color fundus photographs. IEEE Trans Med Imaging 2005; 24: 584-592.
- Garcia M, Sanchez CI, Lopez Ml, Diez A, Hornero R. Automatic detection of red lesions in retinal images using a multilayer perceptron neural network. Conf Proc IEEE Eng Med BioI Soc 2008; 2008: 5425-5428.
- Staal JJ, Abramoff MD, Niemeijer M, Viergever MA, van Ginneken B. Ridge based vessel segmentation in color images of the retina. IEEE Trans Med Imaging 2004; 23: 501-509.
- Hatanaka Y, Nakagawa T, Hayashi Y, Hara T, Fujita H. Improvement of automated detection method of haemorrhages in fundus images. IEEE Eng Med Biol Soc 2008; 5429-5432.
- Bae JP, Kim KG, Kang HC, Jeong CB, Park KH, Hwang J. A study on haemorrhage detection using hybrid method in fundus images. J Digital Imaging 2011; 394-404.
- Alan D, Fleming SP, Keith AG, John AO, Peter FS. Automated micro aneurysm detection using local contrast normalization and local vessel detection. IEEE Trans Med Imaging 2006; 25: 1223-1232.
- Alireza O, Majid M, Barry T, Richard M. Classification and localization of diabetic-related eye disease. Comp Vision 2002; 502-516.
- Anchez CIS, Hornero R, Opez MIL, Poza J. Retinal image analysis to detect and quantify lesions associated with diabetic retinopathy. IEEE Eng Med Biol Soc 2004; 1624-1627.
- Xiaohoui Z, Opas C. A SVM approach for detection of haemorrhages in background diabetic retinopathy. Int Neural Networks 2005; 2435-2440.
- Hoover A, Kouznetsova V, Goldbaum M. Locating blood vessels in retinal images by piece-wise threshold probing of a matched filter response. IEEE Trans Med Imaging 2000; 19: 203-210.
- Kauppi T, Kalesnykiene V, Kamarainen JK, Lensu L, Sorri I, Raninen A, Voutilainen R, Uusitalo H, Kalviainen H, Pietila J. DIARETDB1 diabetic retinopathy database and evaluation protocol. Med Image Anal Aberystwyth Wales 2007.
- Sopharak A, Uyyanonvara B, Barman S, Williamson TH. Automatic detection of diabetic retinopathy exudates from non-dilated retinal images using mathematical morphology methods. Comput Med Imaging Graph 2008; 32: 720-727.
- Somasundaram K, Rajendran PA. Diagnosing and ranking retinopathy disease level using diabetic fundus image recuperation approach. Sci World J 2015; 2015: 1-8.
- Annie GVGS, Kajamohideen S. Diagnosis of diabetic retinopathy by extracting blood vessels and exudates using retinal color fundus images. WSEAS trans Biol Biomed 2014; 11: 20-28.
- Annie GVGS, Kajamohideen S. An economic system for screening of diabetic retinopathy using fundus images. J Biol Sci 2014; 14: 254-260.
- Sapthagirivasan V, Anburajan M. Diagnosis of osteoporosis by extraction of trabecular features from hip radiographs using support vector machine: An investigation panorama with DXA. Comput Biol Med 2013; 43: 1910-1919.
- Sapthagirivasan V, Anburajan M, Janarthanam S. Extraction of 3d femur neck trabecular bone architecture from clinical ct images in osteoporotic evaluation: A novel framework. J Med Syst 2015; 39: 81.
- Noronha K, Acharya UR, Nayak KP, Kamath S, Bhandary SV. Decision support system for diabetic retinopathy using discrete wavelet transform. Proc Inst Mech Eng H 2013; 227: 251-261.
- Figueiredo IN, Kumar S, Oliveira CM, Ramos JD, Engquist B. Automated lesion detectors in retinal fundus images. Comp Biol Biomed 2015; 66: 47-65,.
- Somasundaram K, Rajendran PA. Diagnosing and ranking retinopathy disease level using diabetic fundus image recuperation approach. Sci World J 2015; 2015: 1-8.
- Pedre ES, Navea A, Millan SC, Hernaez O, Morales J, Desco MC, Perez P. Evaluation of automated image analysis software for the detection of diabetic retinopathy to reduce the ophthalmologist’s workload. Acta Opthalmologica 2015; 93: e52-e56.
- Harangi B, Hajdu A. Detection of exudates in fundus images using a Markovian segmentation model. Conf Proc IEEE Eng Med Biol Soc 2014; 2014: 130-133.
- Karthikyan G, Martis RJ, Acharya UR, Kuang C, Min LC, Ng EYK, Laude A. Computer aided diabetic retinopathy detection using trace transforms on digital fundus images. Int Feder Med Biol Eng 2014; 52: 663-672.
- Mishra PKS, Abhijit R, Kaveti T, Bhojwani N, Sagar S, Kumar A. A computational modeling for the detection of diabetic retinopathy severity. Biomed inform 2014; 10: 556-561.
- Pradeep C, Sumeet D, Acharya UR, Krishnan MMR. Ensemble selection for feature based classification of diabetic maculopathy images. J Comp biol med 2013; 43: 2156-2162.
- Balint AH. An ensemble based system for micro aneurysm detection and diabetic retinopathy grading. IEEE trans biomed Eng 2012; 59: 1720-1726.