ISSN: 0970-938X (Print) | 0976-1683 (Electronic)
Biomedical Research
An International Journal of Medical Sciences
Research Article - Biomedical Research (2019) Volume 30, Issue 6
Comparison of several digital techniques for electroencephalography processing
1Department of Biomedical Engineering, Al-Andalus University for Medical Sciences, Tartous, Syria
2Department of Technical Engineering, University of Tartous, Tartous, Syria
3Department of Mechanical Engineering, Czech Technical University, Prague, Czech Republic
- *Corresponding Author:
- Ayham Darwich
Department of Biomedical Engineering
Al-Andalus University for Medical Sciences
Tartous Syria
Accepted Date: October 23, 2019
Most biological signals, whether they are muscle signals, brain signals or voice commands, are
random and unending in their initial form. They are processed and filtered from the noise in the
first stage and then classified, analyzed and extracted the required features of it in the second stage.
In this study, the brain signals of a healthy person were captured according to a clinical protocol
prepared for the purpose of the study, which is two consecutive blinks separated by 5 seconds rest
and then a set of digital filters were used to analyze and classify these signals in order to obtain
control from them.
As a result, it was found that the use of Fourier transform is not feasible with biological signals
because it is not cyclical signals. The use of short time Fourier transform can be a solution to this,
but it is flawed by the loss of some frequency samples due to the adoption of fixed window technology
and then the use of wavelet transform which depends on the variable window, but it has a large
number of out-of-band frequencies. Ultimately, the intermittent discrete wavelet transform was
used which provided the most accurate results and we were able to issue the appropriate control
command.
Keywords
Brain computer interfaces, EEG (electroencephalographic), Fourier transform, STFT, Wavelet transform, Discrete wavelet transform.
Introduction
The human body consists of a range of organs, such as the musculoskeletal system and the nervous system. Most of these devices emit biological signals during their function. These signals are called by this name because they originate from the body of multicellular organisms such as humans. In order to measure and describe these signals, they are converted in their final form into a voltage signal.
Biological signals are all signals from the human body (EMG muscle signal, EEG brain signals, voice commands, ECG heart signals, etc). Reading and processing biological signals can help in diagnosing certain pathological conditions. Analyzing and categorizing these signals can lead to a control command that in turn leads to drive a machine with a specific function to help people with disabilities in their daily lives [1].
Materials and Methods
In the beginning, the process of Electroencephalogram was limited to studying cases of epilepsy and mental illnesses associated with them. However, with the introduction of BCI technology to the research centers, it became necessary to find new algorithms that help in the analysis and understanding of brain waves in order to be able to obtain a control command. we can note that the brain signal is not cyclic and is not finished so it is difficult to analyze by Fourier transforms and traditional methods, so the problem of research was raised, which was manifested by a comparison of several digital filters in order to determine the best in the analyses of biological signals, which is useful in obtaining information can be utilized in the control process [2].Research in this area began in the 1970s at the University of California, Los Angeles, as part of a grant from the National Science Foundation, where researchers Arnaud Delorme and Scott Makeig developed a toolbox and graphical interface called (EEGLAB), built in a matlab environment for the purpose of reading and processing brain signals. The program has many digital filters that can be used to build processing algorithms [2].
In 2011, Arnaud et al. developed a set of tools (NFT, SIFT, BCILAB, ERICA) which facilitated the acquisition and processing of EEG signals [3].
Anupama et al. designed a brain-computer interface to control a wheelchair of a disabled person. Brain waves were captured and sent to a Labview program, which was processing them using short-Fourier transform to classify the signals during patient concentration and eye blinking. The command was sent to controller that used PWM technology to drive the moving motors [4].
Shi used the electroencephalographic (EEG) using wet Ag/ Agcl electrodes positioned at six locations on the scalp (Fp1, Fp2, C3, C4, O1, O2). This study adopted a specific timing scenario to record EEG signals. Then it was exported to Matlab in ASCII format and processed using digital filters and wavelet transform to obtain waves (Delta–Theta–Alpha– Beta–Gamma) and plotted in the time domain. As a result, the researcher found that the signal patterns obtained by using digital filters are clearer than in wavelet transform and he noted the increase in alpha wave activity during eye closure [5].
Bhusan et al. studied the change of brain wave activity during the opening and closing of the eye. EEG test was conducted on 14 people, and then uploaded this data into MATLAB, and the waves were separated according to frequency and then processed using Fast Fourier Transform. The results showed a clear change in the complexity of the brain signal during eye closure [6].
Suresh and Shanmugaraju designed a wireless control system to trigger wheelchair via brainwave mobile sensors. Electrical signals were read and sent as Bluetooth packets. The signal was processed in Matlab using a short time Fourier transform to remove noise and send commands to an ARM7 microcontroller driving DC motors of the wheelchair [7].
Gao et al. designed an EEG-EMG-BCI hybrid system, which consisted of three sections (Emotiv EPOC-host computerrobotic arm). The goal of the system was to acquire signals in real time to reduce the delay and enhance patient’s interaction. Brain and muscle signals were recorded to produce a control command upon patient’s intention and teeth occlusion. Signals were processed and decrypted using web-based controllers based on Discrete Wavelet Transform. The control command was sent wirelessly to the arm to draw the word imagined by the patient [8].
In this research, brain signals were captured by Neurosky device and connected with Labview software via Bluetooth and then the signal processing algorithm was constructed. Experiments were conducted on different people to form statistical data, observe brain signals change according to blink, and analyze brain signal according to frequency using wavelet transform and discrete wavelet transform, and then a control command is formed according to a specific change in the shape of the brain signal and sent to an external electronic circuit.
Signal analysis by digital filters
Signals read from the brain consist of brain signals as well as noise signals (signals from sources other than the brain) and are produced either from biological sources such as eye and muscles movement or from sources outside the human body such as electrodes, Jamming is determined by filtering electrical signals with a frequency higher or lower than the frequency of normal brain signals [5].
The following are the main transforms used to transfer the signal from the time domain to the frequency domain.
Fourier transform
In 1822 Joseph Fourier produced the so-called Fourier transform, which is a method of representing periodic signals using a series of sines and cosines, and then it is developed them for any signal by ending their role to infinity. The transform transfers the signal from the time domain to the frequency domain and vice versa [9].
Fourier transform X (f) decomposes the time signal x (t) using sine waves, which are long waves with different frequencies.
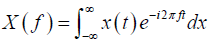 (1)
(1)
A reverse Fourier transform can be found from the relationship:
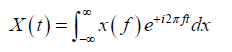 (2)
(2)
As result time-related information will disappear but not lose due to its integration, so the Fourier transform will be a function of frequency only and cannot show us what time period which frequency has occurred and the Fourier transform becomes ineffective for non-fixed signals (variable frequency) because it does not provide us with information about the Frequency over time, which is why a short time Fourier transform (STFT) was developed.
Short time Fourier transform (STFT):
This transform provides a solution to the previous problem by using what is known as the width fixed window as shown in Figures 1 and 2. This transform represents the time and frequency of the signal at the expense of its accuracy, which relates to the window used [10].

Figure 1: Fourier transform at different frequencies.

Figure 2: Short time Fourier transform (STFT).
The window is moved along the signal with the analysis is occur by multiplying the signal by the window function at several points in time. The exponential function transmits the signal from the time domain to the frequency domain.
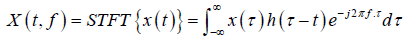 (3)
(3)
 (4)
(4)
The time window achieves the following:
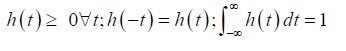 (5)
(5)
Short time Fourier transform divides the plane (timefrequency) with uniform accuracy for all frequencies, but in some applications high frequencies must be treated differently from low frequencies. Thus, the problem with this transform is time and frequency losses, because when a small window is used, high accuracy is obtained for rapidly changing elements, while this accuracy is not high for slowly changing elements and the reverse occurs when a large window is used.
Wavelet transform
The wavelet transform is a development of the previous method. it uses a variable width window instead of a fixed width window. The width of the window is changed to obtain information of different frequency along the wave. We get what are known as wavelets whose frequency varies according to the width of the window used as in Figure 3.

Figure 3: Wavelet transform.
In a comparison of wavelets with sine waves, which are the basis of Fourier analysis, sine waves have no finite duration as they extend from ∞- to ∞+, and where sine wave are smooth and predictable, wavelets tend to be irregular and uneven. Figure 4 shows wavelet transform at different scales.

Figure 4: Wavelet transform at different scales.
A small window produces a compressed wavelet that contains high-frequency elements, also known as detailed factors, the large window produces an extended wavelet that includes low-frequency elements, also known as approximate factors, A wavelet can be defined as a time-limited signal with an average value of zero, and the wavelet conversion is given by:
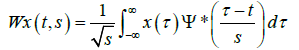 (6)
(6)
Where: τ is the time constant in seconds.
ψ * Nodal facilities for wavelet ψ
s ∈R+ −{0} A gradient that is inversely proportional to frequency.
The function ψ (t) is called the mother wavelet
The inverse of the wavelet is given by the following relationship:
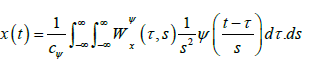 (7)
(7)
Where:
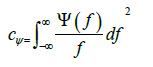 (8)
(8)
Provided cψ<∞ (limited), this in turn leads to:
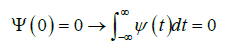 (9)
(9)
The analysis is carried out in a similar way to STFT, where the window is shifted along the signal for a specific gradient (specific window width), then the process is repeated for different gradients (windows), but the problem is the sheer number of wavelets produced due to the use of all gradients in the analysis process and the sheer quantity of the information is also produced for the same reason, so the processing process takes a long time, so the problem was solved using Discrete Wavelet Transform (DWT) [11].
Discrete wavelet transform
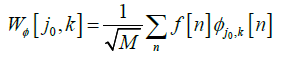
The main difference between this transform and the continuous wavelet transform is that this transform uses a specified number of gradients instead of making the transform for all gradients. The transform produces enough information so that the calculation time is low and Maintain the basic information described for the signal (i.e without loss of important information), and the discrete wavelet conversion is given by: [11].
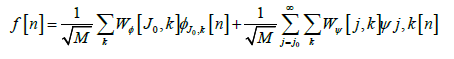 (10)
(10)
Where,  , are separate functions
defined within the domain [0,M-1].
, are separate functions
defined within the domain [0,M-1].
 (11)
(11)
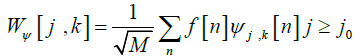 (12)
(12)
But the problem we may have is how we can get all the wavelets to zero, because when we extend the signal, the part we get is only half of the signal, but what about the second half, to solve this problem we do not resort to use all spectra until zero but, a lock is used. This lock terminates the analysis when a predetermined value is reached so that the value is small enough to obtain a sufficient number of wavelets and thus obtain the information specified for the signal. It is a low frequency pass spectrum which is a shear The smaller the value of the lock, the smaller the spectrum of the staging function, the more wavelets produced and the greater the staging information. However, it should be borne in mind that the lock does not produce a small number of wavelets so that the analysis is ineffective [11].
The signal is then divided into approximate and detailed factors that were previously defined. These factors (approximate and detailed) form the wavelet produced by multiplying the signal studied with the mother wavelet. Since wavelets are spectra with a different frequency of the original signal, they are achieved by inserting the signal into filters, so successive groups of low-pass filters and high-pass filters are used. This is called a malate tree. A high-pass filter produces detailed factors, while a low-pass filter with a staging function produces approximate factors.
At each analysis stage, a half-beam pass filter (high and low) produces signals with a frequency field equal to half the frequency of the original signal. This doubles the frequency accuracy of the signal, which means that more details of the signal can be obtained at each analysis stage, and the original signal is obtained by sequential aggregation of all previously produced factors (approximate and detailed factors) from the last analysis stage [11].
Capturing and processing brain signals
The brain signals were captured by the Neurosky device and then sent via Bluetooth to the computer to be processed using Labview software and then the brain signal is shown on the Show screen.
Some experiments were carried out and we monitored brain signal changes over time depending on specific activities. We observed the frequency change and amplitude at the blink of the eye as shown in the Figure 5.

Figure 5: Brain signal shape during eye closing.
To evaluate the reliability of the results, the experiment was repeated ten times on 10 different subjects, and signal changes were noted during eye blinking according to a predetermined timing protocol (eye blinking-5 seconds rest with eye opening then eye blinking).
Signal analysis experiment using Wavelet transform
The Continuous Wavelet Transform was used and connected to the signal flow path as shown in Figure 6.

Figure 6: Continuous wavelet transform program.
The signal was then displayed on the signal plotter using the Waveform Charts tool and we used a specific protocol, which are two consecutive blinks as shown in Figure 7.

Figure 7: Continuous wavelet transform.
We notice from the figure that there is a wide spectrum of frequencies and this is due to the use of the variable window we get a large number of frequency samples and we can verify this by exporting the previous drawing to an Excel file, and this makes it difficult to the measure process for this transform, so we must use another type of transforms, which is discrete wavelet transform.
Signal analysis experiment using discrete wavelet transform
Discrete Wavelet Transform was used and connected to the signal flow path as shown in Figure 8.

Figure 8: Discrete wavelet transform program.
The signal was then displayed on the signal plotter using the Waveform Charts tool and we used a specific protocol, which are two consecutive blinks as shown in Figure 9.

Figure 9: Discrete wavelet transform.
We note from the figure that frequency samples are becoming clearer and can be linked to metrics and utilize the information they provide to obtain frequency changes over time.
Extracting single tone information was used to measure the frequency and compare it with the number (100) which is an experimental number as shown in Figure 9, We noticed that the state of the Boolean tool changed according to the blink of the eye clearly and in real time Figure 10.

Figure 10: Program get control command.
Control of the machine
In this step, a control signal was sent from the computer to the machine to be controlled based on the generated controlling signal generated from the previous step.
The control program was built and linked to the data collection program that was previously built. Consequently, a case structure loop was developed to send the 'b' character to the Arduino circuit when signal value exceeds the determined threshold.
The Arduino chip was programed to receive the control command that was built in the previous stage. A specific chip program was written to activate an electrical relay when receiving the 'b' character Figure 11.

Figure 11: Control program.
Results and Discussion
In this research:
1. Recording of brain signals by Neurosky device and linking it with Labview.
2. Build an algorithm to read the brain signal.
3. Conducting experiments on different persons to observe the signals changes during eye blinking.
4. Brain signal analysis according of frequency using wavelet transform and discrete wavelet transform.
5. The generation of a control command according to a specific change in the frequency of the brain signal.
6. Send the control command to the Arduino slide to move an arm according to the blink of the eye.
A control command was reached according to the blink of the eye in real time with an error rate not exceeding 10%. This was done based on brain wave analysis according to frequency based on the discrete wavelet transform technique, Whereas the previous studies examined only the spectrum of the signal using wavelet transform and did not address the control command construction program [12-25].
Conclusion and Recommendation
1. Brain signals were analysed according to frequency using wavelet transform and discrete wavelet transform.
• Wavelet transform cannot be linked to metrics because of existence of large samples of frequency outside the band.
• The use of discrete wavelet transform gives clear information about frequency change over time and can be linked to metrics.
2. The brain signal has been distinguished under certain conditions and converted into control signals.
3. Extracted signals can be used for multiple purposes (automatic arm movement, wheelchair control) and other applications.
In order to optimize the biological signal use to produce control commands, it is preferable to combine several technologies and obtain biological signals from different sources to ensure higher reliability in the control command.
References
- Salvekar D, Nair A, Bright D, Bhisikar SA. Mind controlled robotic arm. IOSR J Elect Comm Eng 2015; 36-44.
- Delorme A, Makeig S. EEGLAB: An open source toolbox for analysis of single-trial EEG dynamics including independent component analysis. J Neurosci Methods 2004; 134: 9-21.
- Delorme A, Mullen T, Kothe C, Acar ZA, Bigdely-Shamlo N. EEGLAB, SIFT, NFT, BCILAB, and ERICA: New tools for advanced EEG processing. Comp Intel Neurosci 2011; 2011: 10.
- Anupama HS, Cauvery NK, Lingaraju GM. Brain controlled wheelchair for disabled. Int J Eng Res Appl 2014; 4: 156-166.
- Harmony TS. EEG Signal Processing 2015; 22.
- Bhusan UK, Yadav M, Bharagava S. EEG analysis for brainwaves under closed eye and open eye. Interna J Eng 2015; 3: 1-3.
- Suresh G, Shanmugaraju S. E-Sense Algorithm Based Wireless Wheelchair Control Using Brain Waves 2016; 7; 8.
- Gao Q, Dou L, Belkacem AN, Chen C. Noninvasive electroencephalogram based control of a robotic arm for writing task using hybrid BCI system. BioMed Res Int 2017; 2017.
- Bauckhage C. Notes on Fourier Transforms 2013.
- Liu C. A Tutorial of the Wavelet Transform 2010.
- Skodras AN. Discrete Wavelet Transform: An Introduction. 2003; 1: 26.
- Bularka S, Gontean A. Brain-Computer Interface review: In: 2016 12th International Symposium on Electronics and Telecommunications 2016; pp: 219-222.
- Baldi KA. The Generation of Brain Waves. Am J EEG Technol 2018; 21: 187-190.
- Sanei S, Chambers JA. EEG Signal Processing 2013; 1-312.
- Ramantani G, Maillard L, Koessler L. Correlation of invasive EEG and scalp EEG. Seizure 2016; 41: 196-200.
- Bright D, Nair A, Salvekar D, Bhisikar S. EEG-based brain controlled prosthetic arm. In: 2016 Conference on Advances in Signal Processing (CASP) 2016; pp: 479-483.
- Thunuguntla L, Mohan RN, Mounika P. EEG brain controlled robot. Int J Eng Res Appl 2014; 4: 195-198.
- Nafea M, Abdul-Kadir NA, Harun FK. Brainwave-Controlled System for Smart Home Applications. In: 2018 2nd International Conference on BioSignal Analysis, Processing and Systems (ICBAPS) 2018; pp: 75-80.
- Nakirekanti M, Prasad DR, Mahammad E, Reddy KN, Basha DK. Brain Wave Controlled Robot Using Matlab. Int J Mech Eng Technol 2017; 8: 750-759.
- Tharani K, Tharanitharan B, Vinnarasu KN, Vinothkumar G. Brain-Based Computerinterfaces In Virtual Reality. 2019; 8.
- Kambli P, Lingaraju GM. Robot Control using Brain Waves 2015; 4.
- Ramadan RA, Refat S, Elshahed MA, Ali RA. Basics of Brain Computer Interface. 2015; 21.
- Bazanova OM, Vernon D. Interpreting EEG alpha activity. Neurosci Biobehav Rev 2014; 44: 94-110.
- Onton J, Delorme A, Makeig S. Frontal midline EEG dynamics during working memory. Neuroimage 2005; 27: 341-356.
- He B, Ding L. Electrophysiological mapping and neuroimaging. In: Neural Engineering 2013; pp: 499-543.