ISSN: 0970-938X (Print) | 0976-1683 (Electronic)
Biomedical Research
An International Journal of Medical Sciences
Research Article - Biomedical Research (2017) Volume 28, Issue 22
Breast cancer diagnosis in mammogram images using coordinate logic filters
Hasan Moslemi, Iman Abaspur Kazerouni* and Fatemeh Hourali
Esfarayen University of Technology, Esfarayen, North Khorasan, Iran
- *Corresponding Author:
- Iman Abaspur Kazerouni
Esfarayen University of Technology
Esfarayen, North Khorasan, Iran
Accepted on May 09, 2017
Introduction: Breast cancer is the most common cancer among women. Early and timely detection can increase the effectiveness of more treatment options and lead to more efficient treatment. Mammography is the most standard method for detecting breast cancer, but due to some constraints such as low light intensity, especially in dense breasts, some techniques by means of image processing and artificial intelligence have been developed to detect cancer. These techniques consist of three stages: pre-processing, segmentation and extraction of the tumor areas.
Method: In this paper, using a combination of fuzzy inference and coordinate logic filter, mass candidate regions specified. Then, using thresholding, exact location of masses specified and can be detected in the mammogram.
Results: Because intelligent systems without human errors in diagnosis are common, accuracy and speed of detection proposed method is very high and has a significant coefficient p=0.01 for accurate diagnosis compared with a human detection method.
Conclusion: The experimental results on MIAS database emphasis on the superiority of the proposed method compared with validate existing methods. Diagnosis results achieved high accuracy and precision and margin of less than 8% error for the correct diagnosis.
Keywords
Breast cancer, Fuzzy inference, Mass, Coordinate logic operators, Coordinates logic filter, Edge detection.
Introduction
Cancer refers to producing an uncontrolled number of cells in a specific part of the body. Breast cancer is a type of malignant tumor of the breast that is produced by breast cells [1]. One of the major methods for the detection of breast cancer is mammogram images. Given that, according to recent statistics, breast cancer has the most mortality rate among cancers, early detection of breast cancer is essential [2]. Early detection of breast cancer through mammography screening, increases breast cancer treatment options and survival rate. Unfortunately, due to human factors involved in the screening process, the diagnosis of suspected tumors is exposing to high degree of errors. Screening studies have shown that between 10%-30% error rates to detect cancer caused by radiologist [3] and 43% of the errors due to scanning error [4]. Generally masses are divided into two benign and malignant categories. In benign mass intensity difference of edges in compared to other parts of image is very gentle and uniform. While there are sharp edges and highlight areas on the edge of malignant masses and intensity of tumor’s edge is very high compared with other parts of the image.
In most cases, the radiologist investigates mammography image to determine existing of the mass. If a malignant lump is detected based on the opinion and experience of the radiologist, the patient should be referred for biopsy. In these circumstances, regard to the costs and complications of biopsy, using a computer-assisted method that can automatically classify the existing tumors to benign and malignant, will be very important and helpful [5]. Each computer-aided detection system is based on artificial intelligence techniques and image processing. The main characteristic of a breast tumor usually is the presence of a dense body or changes in breast texture on mammogram images [6]. Several methods for computer aided breast cancer diagnosis have been proposed by researchers. Some of researches which are done in this field are as follows:
Rangayyan et al. [7] proposed two morphological features (fractional concavity and secular’s index) based on the hand-drawn mass border. Then these two features with a feature which is related to compressibility, combined for classifying masses to benign or malignant. This method is appropriate for classification of limited benign masses and malignant masses with sharp edges. Then Rangayyan and Nguyenused fractal dimension to mass classification. The combination of the calculated fractal dimension by measuring the characteristics of pre-developed image, improved the classification performance [8]. Another presented method is using of wavelet transform, Lin et al. [9] produced more mammography features using multi scale wavelet orientation and choices, by increasing local contrast. In [10], a method was provided for mass detection in mammography that used the Gaussian smoothing and sub-sampling for pre-processing. Then using the links to the intensity of the backlight from the mass center to its surrounding area, mass segmentation is performed. In [11], a method is provided for segmentation of the interested areas. This algorithm describes borders of the breast, chest muscles and dense areas that are candidates for the masses.
In [12] have tried to automatically recognize mass zones. In this method, canny edge detection is used to determine the boundaries of the body as well as specify areas where the border is more like to breast. Then, curved and bent edges detected using the Hough transform. In [13] a compact and effective method based on the law has given, which by adding a fuzzy genetic algorithm optimizes the parameters and characteristics. The rest of the paper is organized as follows: the proposed algorithm included noise removal, improving fuzzy edge detection and diagnosis the exact boundary of mass is provided in Section 2. Experimental results and conclusion are proposed in section 3 and 4 respectively.
Proposed Method
In this paper, diagram of the proposed algorithm to extract the boundary of tumor in the mammogram images is shown in Figure 1.

Figure 1. Block diagram of the proposed method.
Noise removal
For better performance to eliminating noise and smoothing the mammography photos before edge detection, median noise reduction operator is used. Noise removal operation is doing well by this filter which uses the average of the neighboring pixels around each pixel. In this paper, a 3*3 mask is used for filtering operation.
Edge enhancement using fuzzy rules
Using fuzzy inference system, pixels of image are divided into three groups: black, white and edges. The input image is a grayscale mammography image and its intensity is scaled between 0-255. With regard to the designed membership functions for three groups of black, white and gray, each pixel will be assigned to one of these three groups with fuzzy inference and 16 written rules. Operation of the designed fuzzy system in this paper is as follows:
By a 4*4 mask, the hole of image is scanned. Then according to the fuzzy system rules, pixels with large intensity difference in comparison to neighboring pixels will belong to edge group.
Finally, membership function generates a number between 130 and 140 as the final amount of edge pixels. Also if the desired pixel has small intensity difference compared with adjacent pixels, it belongs to one of two black or white categories. Figure 2 shows the mask which is used for image scanning.

Figure 2. Image scanning mask.
Four inputs and one output for the fuzzy system are intended. For inputs two membership functions: black and white and for outputs three membership functions: black, white and the edge are designed. All membership functions are triangular fuzzy functions. Figure 3 is an example of the membership function used for input.

Figure 3. Example of the membership function used for input.
The fuzzy rules used for classification of pixels are as follows.
• If at least, 3 pixels from P1 to P4 pixels are white, output pixels assigned to the white class.
• If at least, 3 pixels from P1 to P4 pixels are black, output pixel is assigned to the black class.
• If two pixels among four P1 to P4 pixels are black and two are white pixels, output pixel will be considered as edge pixel. Mamdany inference algorithm used for fuzzy inference. This algorithm due to the high power of expression is used widely in the decision systems. The algorithm uses in the state of one input-multiple output and multiple input-multiple output and composed of fuzzy sets and rules which are used to determine the results of rules and output of rules is as fuzzy. For defuzzification, BOA, MOM, SOM…methods are used. The general diagram of inference system is shown in Figure 4.

Figure 4. Diagram of Fuzzy inference system.
After the results of rules are determined, finally defuzzification is done and the results are provided as crisp values (numerical).
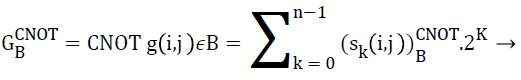
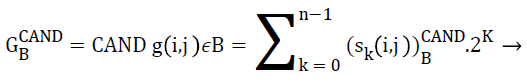
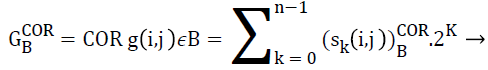
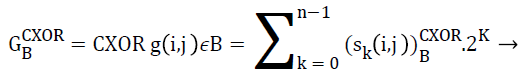
Edge detection using coordinate logic filter (CLF)
Coordinate logic filters, are filters that use main logical operators. These operators are: AND, NOT, OR, XOR, or a combination of these operators. These operators are applied on the image or signal. CNOT, COR, CAND, CXOR are corresponding coordinates of the above operators which are applied on multi-bit digital data. The input image G is defined as follows:
G={g(i,j);i=1,2,…,M,j=1,2,…,N} → (1)
For example, if using the structural component B, which is defined in Eq. 2, we apply COR operation on the input image (g), the resulted output image will be just as Eq.3.
f(i,j)=g(i-1,j)COR g(i,j-1)COR g(i,j)COR g(i+1,j)COR g(i,j+1) → (3)
Coordinate logical operators (CLO) have a very important role in operations related to pattern recognition and image processing such as image noise reduction, required pre-processing on the images, etc.
Assessment of CLF filters associated with four main operators CLO on an image are as below relationships.
 (4)
(4)
 (5)
(5)
 (6)
(6)
 (7)
(7)
Edge detection using the CLF
In [15] several methods for edge detection using CLF is provided. In the proposed algorithm for edge detection, the following relation is used.
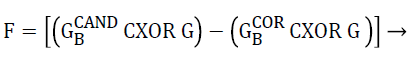 (8)
(8)
After determining boundary of tumor, thresholding is used for extracting the exact location of the mass and finally, by adding the initial image and binary image in which the edges of the masses exactly has been found, the location of mass will be displayed on the initial image.
Experimental Results
In this section, results of applying the proposed algorithm on images of breast cancer research center’s database in the United Kingdom (MIAS) are examined. This database includes 322 images (161 pairs) with50 micron resolution as gray level images with PGM format which are very close to the images that are used in fact. Results of applying the proposed algorithm on two images of MIAS database is shown in Figure 5a. As is shown the resulted images (Figure 5b), the proposed algorithm can exactly determine boundary of masses in the mammogram images.

Figure 5. a) The original images, b) Resulted images in which the exact boundary of tumor is detected.
In Table 1 a comparison among valid reported literature has been given for a general comparison with other techniques.
| Author | Rosenberg [16] | I.A.Kazerouni [17] | This Work |
|---|---|---|---|
| Features | Experimental | Texture | Morphology Texture |
| Method | Benchmark | (2D)2PCA(features extraction) SVM with RBF kernel (classification) |
Fuzzy CLF |
| Method Result | 80% | 88% | 91% |
| Year | 2006 | 2013 | 2017 |
Table 1. A comparison among valid reported literature.
Conclusion
In this paper, a method is provided to determine the exact boundary of the masses in mammograms. First, the median filter is used for smoothing and noise removal. Then using fuzzy inference system, fuzzy edge enhancement is done and with applying coordinate logic filter, candidate regions of tumor will be determined and finally using thresholding, exact boundary of masses can be detected in a mammogram images.
The proposed algorithm is tested on MIAS breast database. The results indicated that the proposed method can perform well in determining the exact location of masses in mammography in comparison with other methods. Accuracy and speed of detection proposed method is very high and has a significant coefficient p=0.01 for accurate diagnosis compared with a human detection method.
References
- Ohsumi S, Takashima S, Aogi K, Usuki H. Prognostic value of thermographical findings in patients with primary breast cancer. Breast Cancer Res Treat 2002; 74: 13-20.
- Head JF, Wang F, Elliott RL. Breast thermography is a noninvasive prognostic procedure that predicts tumor growth rate in breast cancer patients. Ann N Y AcadSci 1993; 698: 153-158.
- Zore Z, Boras I, Stanec M, Oresić T, Zore IF. Influence of hormonal status on thermography findings in breast cancer. Acta Clin Croat 2013; 52: 35-42.
- Yang SN, Li FJ, Liao YH, Chen YS, Shen WC, Huang TC. Identification of Breast Cancer Using Integrated Information from MRI and Mammography. PLoS ONE 2015; 10: 1-11.
- Nanni L, Brahnam S, Lumini A. A very high performing system to discriminate tissues in mammograms as benign and malignant. Expert Syst Appl 2012; 39: 1968-1971.
- Verma B, McLeod P, Klevansky A. A novel soft cluster neural network for the classification of suspicious areas in digital mammograms. Pattern Recognition 2009; 42: 1845-1852.
- Rangayyan RM, Mudigonda NR, Desautels JE. Boundary modeling and shape analysis methods for classification of mammographic masses, Med Biol Eng Comput 2000; 38: 487-496.
- Rangayyan RM, Nguyen T. Fractal analysis of contours of breast masses in mammograms. J Digit Imaging 2007; 20: 223-237.
- Li Y, Chen H, Rohde GK, Yao C, Lin C. Texton Analysis for Mass Classification in Mammograms. Pattern Recogn Letteres 2015; 52: 87-93.
- Ireaneus Y and ThamaraiSelvi S. Early detection of breast cancer using SVM classifier technique. IJCSE 2009; 1: 127-130.
- Tortajada M, Oliver A, Martí R, Ganau S, Tortajada L, Sentís M, Freixenet J, Zwiggelaar R. Breast peripheral area correction in digital mammograms. Comput Biol Med 2014; 50: 32-40.
- Dinsha D, Manikandaprabu N. Breast tumor segmentation and classification using SVM and Bayesian from thermogram images. UJEAS 2014; 02: 147-151.
- GhayoumiZadeh H, Pakdelazar O, Haddadnia J, Rezai-Rad Gh, Mohammad ZadehM. Diagnosing breast cancer with the aid of fuzzy logic based on data mining of a genetic algorithm in infrared images. Middle East J Cancer 2012; 3: 119-129.
- Meenakshi K, Sasikala D, Aarthi Rani P. A Study On Preprocessing A Mammogram Image Using Adaptive Median Filter. IJIRSET 2014; 3: 112-120.
- Swapna Devi, Vikrant Bhateja. A novel framework for edge detection of microcalcifications using a non-linear enhancement operator and morphological filter. 3rd International Conference on Electronics Computer Technology 201.
- Rosenberg RD, Yankaskas BC, Abraham LA. Performance Benchmarks for Screening Mammography, Radiology 2006; 241: 55-66.
- Kazerouni IA, Haddadnia J. A mass classification and image retrieval model for mammograms. Imaging Sci J 2013; 62: 353-357.