ISSN: 0970-938X (Print) | 0976-1683 (Electronic)
Biomedical Research
An International Journal of Medical Sciences
Research Article - Biomedical Research (2017) Volume 28, Issue 8
Analysis of the abutment-implant platform gap in internal hex dental implants
1Division of Oral Rehabilitation, Universidad San Sebastián, Chile
2Division of Oral and Maxillofacial Surgery, Universidad de La Frontera, Chile
3Center for Biomedical Research, Universidad Autónoma de Chile, Chile
- *Corresponding Author:
- Sergio Olate
Division of Oral and maxilofacial Surgery
Claro Solar 115, 414-A Office,
Universidad de La Frontera, Temuco, Chile
Accepted date: May 12, 2016
The aim of this research was to identify the abutment-implant gap using 20 N or 30 N torques for the abutment. A descriptive study was designed using 3 internal hex implant systems from four different companies; the implants were manipulated in a usual way, installing the respective prosthetic abutment in each platform using 20 N/cm2 and 30 N/cm2 torque. Then, observations were made and photos taken a LEO 1420 VP scanning electron microscope; the data were analyzed with the Shapiro-Wilk test of normality and t-test for related samples, considering a value of p<0.05 for significant differences to compare the group with 20N and the group with 30N torque. Significant differences were identified between the gap in abutments installed with either 20 N/cm2 or 30 N/cm2, with fewer differences being observed in the latter group. There were wide variations between the study units, with reductions from 49% to 23% from the interface with the lower (20 N/cm2) to the higher torque (30 N/cm2). It can be concluded that the installation torque of prosthetic abutments influences the interface between prosthetic connector and implant surface.
Keywords
Implant gap, Abutment, Dental implant
Introduction
The gap between the abutment and the platform is relevant to the short and long-term results in different types of implant restoration. Bacterial colonization of the implant surface leads to inflammatory changes that can be reversible in soft tissues; when the phenomenon reaches bone level a well-known disease like peri-implantitis occurs [1,2]. It has been shown that in the connection between abutment and implant the bacteria can find a place that allows their mobility until them reaching the implant bed [3], which could cause significant complications. Adjustment defects between abutment and implant added to the lack of passive adaptation between the prosthesis and the implant can promote the fracture of the prosthetic screw [4] and produce other types of complications.
Discrepancies in fit and spaces between components are inevitable when two different parts are positioned [5]; therefore, efforts have been made to maximize the fit of the connections between implant and abutment. Some studies have determined the measurement of these interface spaces using electron microscopy [6], and a standard marginal space measurement of 45 μm has been proposed. Other studies have measured spaces smaller than 12 μm, whereas others have reported average values of microspaces from 2.3 to 5.6 μm [2].
The aim of this study is to identify the space between the prosthetic abutment and implant platform in four different brands (with internal hex connection) frequently found on the international market.
Materials and Methods
A descriptive study was designed to analyze the gap between abutment and platform of implant using two different installation torques. To do this, 3 implant units from 4 brands were used (Table 1) that fulfilled the study conditions of an internal hex and standardization. For the analyses, the implants and their components were acquired in the formal market through their conventional form of sale. All the implants were removed from their packages with specific tweezers and implant mount, limiting any contact at platform level and the places to be used in the measurements.
| Company | Implant | Measurements |
|---|---|---|
| Medigma | Fix tite | 3.75 × 13 |
| Biohorizons | Tapered internal | 3.8 × 12 |
| Alpha Bio | Atid | 3.75 × 13 |
| B & W | Cónico CIH | 4.0 × 13 |
Table 1: Distribution of the 4 types of implants and commercial brands used to applied the 20N and 30N torque in the abutment.
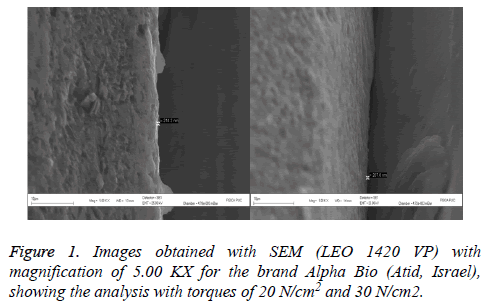
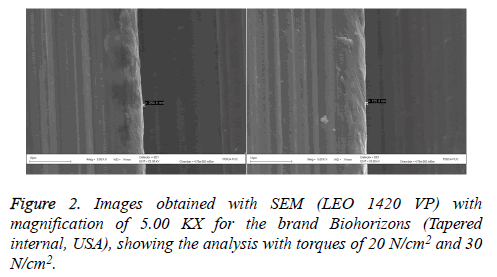
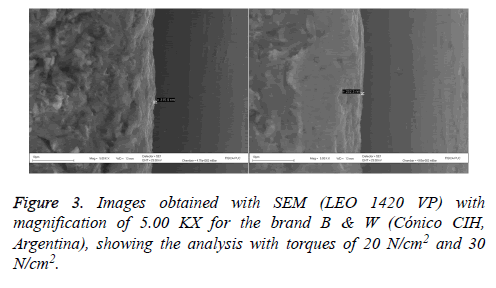
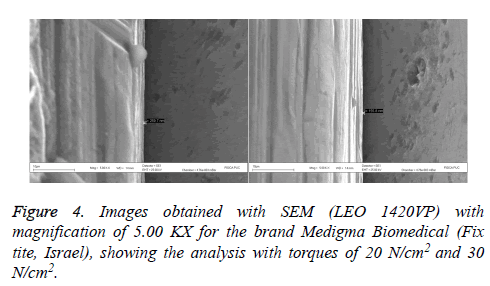
For the implants, the abutments installed were used with progressive torques in 9 different configurations, reaching two final installation torques: 20 N/cm2 (group 1 with 12 implants) and 30 N/cm2 (group 2 with 12 implants). For this phase, each implant was held firm in a pressure system that rendered the implants immobile. Once torque was applied to the abutments, the implants were installed in a wax-based cubical system that kept the system stable and subjected to observation and photography using a scanning electron microscope (SEM, LEO 1420 VP), using acceleration values and focal length according to the magnification used in the image (50X, 500X, 1000X).
Given the variability observed on the surfaces of metallic structures, a specific point was determined to take the measurement (the selected point had to be repeatable and easily identifiable, determining from 1 mm inwards from the outer edge of the platform), making it possible to standardize the comparison.
The measurements were taken by qualified personnel with experience in the use of this SEM system; each unit was measured individually, recording its values in a table designed specifically for the study. The data were analyzed with measures of central tendency and a statistical analysis with the Shapiro-Wilk test of normality and t-test for related samples, making a comparison between 12 units with 20 N torque (group 1) vs. 12 units with 30N torque (group 2). The data were analyzed with the SPSS/PC + v. 20.0 software (SPSS, Chicago, USA), considering a value of p<0.05 for significant differences.
Results
The tests were applied without complications. The results showed a significant relation between the torque applied to the abutment and the gap in the abutment-implant interface (p<0.05) when the group 1 and group 2 were analyzed (Table 2). The gaps were variable. The surface of each implant also presented different variations and morphologies (Figures 1-4).
| Company | Gap between abutment and implant platform (nm) | Difference between averages | |||
|---|---|---|---|---|---|
| 20 N/cm2 | 30 N/cm2 | ||||
| X (nm) | SD | X (nm) | DE | ||
| A | 317.6 | 95.1 | 209 | 54.51 | 108.6 |
| B | 404.5 | 243.8 | 231.1 | 29.21 | 173.4 |
| C | 244.5 | 26.3 | 125.3 | 27.1 | 119.2 |
| D | 280.1 | 31.1 | 215.9 | 14.14 | 64.2 |
| Average | 311.7 | 99.1 | 195.3 | 31.2 | 116.4 |
Table 2: Gaps obtained for each implant system according to their brand, doing a comparative analysis using 12 implants in each group.
For each implant system analyzed clear differences were observed in the gap when 20 N/cm2 and 30 N/cm2 were compared. Brand D had the fewest differences in the existing spaces, whereas brand B had the greatest variation. It was not possible to obtain statistical relations between the brands due to the small number of samples used.
From a percentage point of view, the gap reduction in the interface was observed in group A with 35%, group B with 43%, group C with 49% and group D with 23%, showing the impact of 10-Ncm torque on the abutment installation.
Discussion
Scanning electron microscopy enables a microstructural analysis to identify the actual condition of different metal systems. This technology has been applied previously to identify implant surfaces as well as variations in systems, both in design and connection, which involves studies of fit and irregularities in the manufacture [7].
King [8] used periapical x-rays to study the bone response of implants installed in terms of load, finding different interface sizes, which apparently had no influence on bone crest migration. Vidigal [9] reported results with interface variations between 20 and 150 μm, which show a broad variation and chances for bacterial contamination. Rodriguez and Baena [10] also indicated that surface type might be related to the migration and presence of microorganisms through the interface.
Nakazato [11] and Koha [12], independently, conducted studies where they confirmed that 14 days after the insertion of the prosthetic abutment on the implant, the interface was already being colonized by common bacteria in the mouth, demonstrating the importance of recognizing and reducing this interface in implant systems. The normal conditions of the oral environment allow these microbial migrations to develop more frequently; however, Jansen [2] found no significant relations between the interface size and bacterial contamination.
The corrosion related to a poor fit is another condition that must be assessed. De Oliveira [13] performed these in vitro analyses, observing that the increase in corrosion could lead to a fracture of metal systems, causing major complications in a clinical environment. The size of the space between abutment and platform could be a variable in the presence of corrosion.
In our results, it is worthy of note that only two of the four brands evaluated indicate an installation torque for the prosthetic abutment as formal manufacturer’s instructions, whereas the other two do not mention it. Our results confirm previous studies where the highest torque to insert the abutment affects the reduction of the abutment- implant platform interface. Another interesting observation from our results lies in the wide variability among the brands; however, given the small sample number, statistical comparisons are not possible. Nevertheless, it does allow speculation regarding the guarantee that these systems offer in medium and long-term implant restoration.
The size of the bacteria is smaller than the implant-connector interface [14], so that larger spaces allow large bacterial invasions. There are several factors, however, that influence the presence of these interfaces; therefore, the abutment insertion torque could be highly relevant to reducing the space in the connection. May be more important than the connection itself given that de Oliveira [15] did not any observe significant differences when they compared the interface spaces in internal hex and external hex implants, even though the internal connection had smaller interfaces. Jaworski [16] also found that Morse taper systems had fewer interface spaces than other implant systems. In the present study, internal connection systems were selected exclusively as they are more frequently used in the market and there is a variety of internal connections.
Conclusion
It may be concluded that the amount of torque to insert the abutment on the implant platform significantly influences the size of the interface, decreasing when the torque is greater.
References
- Passos SP, Gressler May L, Faria R, Özcan M, Bottino MA. Implant-abutment gap versus microbial colonization: Clinical significance based on a literature review. J Biomed Mater Res B Appl Biomater 2013; 101: 1321-1328.
- Jansen VK, Conrads G, Richter EJ. Microbial contamination and marginal fit of the implant- abuttment interface. Int J Oral Maxillofac Im- plants 1997; 12: 527-540.
- do Nascimento C, Barbosa RES, Issa JPM, Watanabe E, Ito IY, Albuquerque RF. Bacterial leakage along the implant–abutment interface of premachined or cast components. Int J Oral Maxillofac Surg 2008; 37: 177-180.
- Guimarães MP, Nishioka RS & Bottino MA. Analysis of implant/abutment marginal fitting. Pós-Grad Rev Fac Odontol Sao José dos Campos 2001; 4: 12-19.
- Tsuge T, Hagiwara Y, Matsumura H. Marginal fit and microgaps of implant-abutment interface with internal anti-rotation configuration. Dent Mater J 2008; 27: 29-34.
- Binon PP. Evaluation of machining accuracy and consistency of selected implants, standard abutments, and laboratory analogs. Int J Prosthodont 1995; 6: 49-53.
- Olate S, Duque de Miranda Chaves Netto H, de Albergaria-Barbosa JR. Análisis microestructural de cinco sistemas de implantes de titanio comercialmente puro. Av Periodon Implantol 2010; 22: 37-43.
- King GN, Hermann JS, Schoolfield JD, Buser D, Cochran DL. Influence of the size of the micro- gap on crestal bone levels in submerged den- tal implants: a radiographic study in the canine mandible. J Periodontol 2002; 73: 1111-1117.
- Vidigal GM Jr, Novaes AB Jr, Chevitarese O, De Avillez RR, Groisman M. Evaluation of the implant-connection interface using scanning electron microscopy. Braz Dent J 1995; 6: 17- 23.
- Baena R, Arciola CR, Selan L, Battaglia R, Imbriani M, Rizzo S, Visal L. Evaluation of bacterial adhesión on machined titanium, osseotite® and nanotite® discs. Int J Artif Organs 2012; 35: 754-761.
- Nakazato G, Tsuchiya H, Sato M, Yamauchi M. In vivo plaque formation on implant materials. Int J Oral Maxillofac Implants 1989; 4: 321- 326.
- Koba S, Razzoog ME, Bloem TJ, Syed S. Microbbial colonization of dental implants in partially edentulous subjects. J Prosthet Dent 1993; 70: 114-144.
- De Oliveira G, Pozzer L, Cavalieri-Pereira L, de Moraes PH, Olate S, Albergaria-barbosa JR. Bacterial adhesion and colonization differences between zirconia and titanium implant abutments: an in vivo human study. J Periodontal Implant Sci 2012; 42: 217-223.
- Zjinge V, Ammann T, Thurnheer T, Gmür R. Subgingival biofilm structure. Front Oral Biol 2012; 15: 1-16.
- de Oliveira G, Olate S, Pozzer L, Cavalieri-Pereira L, Rodriguez-Chessa J, Albergaría-barbosa JR. Bacterial contamination along implant-abutment interface in external and internal-hex dental implants. Int J Clin Exp Med 2014; 7: 580-585.
- Jaworski ME, Melo AC, Picheth CM, Sartori IA. Analysis of the bacterial seal at the implant- abutment interface in external-hex and morse tapered-connection implants: an in vitro study using a new methodology. Int J Oral Maxillofac Implants 2012; 27: 1091-1095.


