ISSN: 0970-938X (Print) | 0976-1683 (Electronic)
Biomedical Research
An International Journal of Medical Sciences
Research Article - Biomedical Research (2017) Volume 28, Issue 11
The effects of lovastatin on the morphology, cell viability and differentiation of stem cells derived from gingiva
Bo-Bae Kim#, Minji Kim# and Jun-Beom Park*
Department of Periodontics, College of Medicine, the Catholic University of Korea, Seoul, Republic of Korea
#These authors contributed equally to this work
- *Corresponding Author:
- Jun-Beom Park
Department of Periodontics, College of Medicine
The Catholic University of Korea, Republic of Korea
Accepted date: March 27, 2017
The aim of this study is to evaluate the effects of lovastatin on the cell viability and osteogenic differentiation of human gingiva-derived stem cells. Stem cells were cultured in the presence of lovastatin at concentrations ranging from 2 μM to 6 μM. The morphology and cell viability were evaluated on days 2, 7, and 14. The alkaline phosphatase activity test and alizarin red-S staining were used to assess the osteogenic differentiation and mineralization. Quantitative real-time polymerase chain reaction was used to evaluate the mRNA levels of Runt-related transcription factor 2 (Runx2) and collagen I. Immunofluorescent assays were performed for Runx2 and collagen I, and protein expressions were measured, including those of Runx2 and collagen I, using Western blot analysis. The shapes of the cells in 2 μM lovastatin were similar to those of the untreated control group, showing revealed a spindleshaped, fibroblast-like morphology. However, the shapes of the cells in the 6 μM groups were rounder, and fewer cells were present. The CCK-8 values of 0 μM, 2 μM, and 6 μM at day 14 were 207.4 ± 15.5, 188.1 ± 13.3, and 166.0 ± 32.3, respectively (P<0.05). Decreased mineralization was noted in the 2 μM and 6 μM groups, when compared the 0 μM control. The relative alkaline phosphatase activity values of the 0 μM, 2 μM, and 6 μM groups were 100.0 ± 6.8, 70.5 ± 6.8, and 57.5 ± 5.8 on day 14, respectively. The expressions of Runx2 and collagen I by immunofluorescence decreased as the dose of lovastatin increased. The application of lovastatin produced decreased cell viability and decreased osteogenic differentiation in this experimental setting. It should be considered that the use of higher doses of statin may yield a negative effect on cell viability and differentiation of stem cells.
Keywords
Cell differentiation, Cell proliferation, Cell survival, Gingiva, Lovastatin, Stem cells.
Introduction
Statin is a specific inhibitor of 3-hydroxy-3-methyl-glutaryl coenzyme A reductase [1]. It is known to be a rate-limiting enzyme involved in the cholesterol synthesis pathway. Statins are shown to have immunomodulatory and anti-inflammatory activities and may prove invaluable in treating immunological and inflammatory disorders [2]. Statins have been reported to have anabolic effects on bone and may produce positive effects on both the differentiation and mineralization of osteoprecursor cells [3,4].
Stem cells are known to possess the capacity for self-renewal and the potential for differentiation into chondrogenic, adipogenic and osteogenic cells [5]. These cells have been applied for the engineering of various tissues, including for bone, cartilage, fat, and other connective tissue [6]. These cells can be obtained from bone marrow, adipose tissue and turbinate tissues [7,8]. Our groups have isolated mesenchymal stem cells and characterized from the human gingiva; these cells can be under local anesthesia during the daily practices [9].
Lovastatin is a cholesterol lowering agent, along with its family member’s simvastatin, atorvastatin and pravastatin [10]. It has been reported as being representative of therapeutic regimens. Lovastatin is shown to inhibit the cell proliferation, cell migration, and cell adhesion of cancer cells [11]. Moreover, statin has been demonstrated to promote osteoblastic activity [1,12]. However, the effects of lovastatin on mesenchymal stem cells are not well revealed. Thus, the aim of this study is to evaluate the effects of lovastatin on the cell viability and osteogenic differentiation of human gingivaderived stem cells. The alkaline phosphatase activity test and alizarin red-S staining were used to assess the differentiation and mineralization of the treated cells. Quantitative real-time polymerase chain reaction was used to evaluate the mRNA levels of Runt-related transcription factor 2 (Runx2) and collagen I, and protein expressions of Runx2 and collagen I were measured using Western blot analysis. To our knowledge, this investigation is the first to elucidate the effects of lovastatin on the expressions of Runx2 and collagen I in mesenchymal stem cells derived from gingiva.
Materials and Methods
Isolation and culture of human gingiva-derived stem cells
Isolation and culture of human gingiva-derived stem cells were performed following a previously reported method [7]. The Institutional Review Board has approved this study and the informed consent was obtained from the participants.
The obtained gingival tissues were de-epithelialized, minced into 1-2 mm2 fragments, and digested in an alpha-modified, minimal essential medium (α-MEM, Gibco, Grand Island, NY, USA) containing dispase (1 mg/ml; Sigma-Aldrich Co., St. Louis, MO, USA) and collagenase IV (2 mg/ml; Sigma- Aldrich Co.). Cells were incubated at 37°C in a humidified incubator with 5% CO2 and 95% O2 and replaced with a fresh medium; the media were changed every 2-3 days.
Evaluation of stem cell morphology
The stem cells were incubated in α-MEM, fetal bovine serum, ascorbic acid 2-phosphate, glutamine, penicillin, and streptomycin in the presence of the lovastatin at final concentrations of 0 μM (untreated control), 2 μM, and 6 μM. On days 2, 7, and 14, an inverted microscope (Leica DM IRM, Leica Microsystems, Wetzlar, Germany) was used to evaluated the cell morphology.
Determination of cell viability
Cell viability was analysed on days 2, 7, and 14. Viable cells were identified using a Cell Counting Kit-8 (CCK-8, Dojindo, Tokyo, Japan) assay. The spectrophotometric absorbance of the samples was measured using a plate reader (BioTek, Winooski, VT, USA) at 450 nm (n=3).
Alizarin red S staining
On day 14, alizarin red S assays were performed. Cells were washed with phosphate-buffered saline (PBS; Welgene, Daegu, South Korea), fixed with ethanol. These cells were stained with alizarin red S at room temperature, and the cells were viewed under a microscope.
Alkaline phosphatase activity assays
On day 14, alkaline phosphatase activity assays were done. Trypsin (Gibco) was used to detach the cells and a commercially available kit (K412-500, BioVision, Inc., Milpitas, CA, USA) was used to perform alkaline phosphatase activity assays. Microplate reader (BioTek) was used to measure the spectrophotometric absorbance of the samples.
Total RNA extraction and quantification by real-time polymerase chain reaction (RT-PCR)
The human gingiva-derived stem cells were harvested on day 14. Total RNA was isolated using a GeneJET RNA Purification kit (Thermo Fisher Scientific, Inc., Waltham, MA, USA), and quantities were determined by spectrophotometer (ND-2000, Thermo Fisher Scientific, Inc., Wilmington, DE, USA) with ratios of absorbance at 260 and 280 nm.
The sense and antisense primers were designed based on GenBank. The primer sequences were as follows: Runx-2 Forward 5’: AAT GAT GGT GTT GAC GCT GA-3’; Reverse 5’: TTG ATA CGT GTG GGA TGT GG-3’; Collagen I Forward 5’: TCA TGG CCC TCC AGC CCC CAT3’; and Reverse 5’: ATG CCT CTT GTC CTT GGG GTT C-3’. β- actin served as a housekeeping gene for normalization. mRNA expression was detected by RT-PCR using SYBR Green Real- Time PCR Master Mixes (Enzynomics, Daejeon, South Korea) according to the manufacturer’s protocol. The quantitative RTPCR experiments were repeated three times.
Immunofluorescence
An immunofluorescent assay was performed for Runx2 and collagen I on day 14. The cells were fixed, permeabilized, blocked, and incubated with primary antibodies. The cultures were incubated with fluorescein isothiocyanate-conjugated secondary antibody, and then the washed cells were stained with 4’, 6-Diamidino-2-Phenylindole (DAPI). Analyses were performed using a fluorescence microscope (Axiovert 200, Zeiss, Jena, Germany).
Western blot analysis
The cells were washed twice with ice-cold phosphate-buffered saline and solubilized in lysis buffer (Thermo Fisher Scientific, Inc., Waltham, MA, USA) with protease and phosphatase inhibitor cocktail (Thermo Fisher Scientific, Inc.) and phenylmethylsulfonyl fluoride (Sigma-Aldrich Co.) according to the manufacturers’ protocols. Whole cell lysates were quantified using the BCA assay (Thermo Fisher Scientific, Inc.). Protein samples were separated using sodium dodecyl sulfate polyacrylamide gel electrophoresis and then transferred for immunoblotting. The membranes were incubated with the primary antibodies overnight at 4°C, and membranes were incubated with secondary antibody for 1 hour at room temperature. Antibodies against Runx2 antibody, collagen I, and GAPDH as well as secondary antibodies linked with horseradish peroxidase were purchased from Abcam (Cambridge, UK) and BD Bioscience (San Jose, CA, USA).
Statistical analysis
The data are represented as means ± standard deviations of the experiments. Commercially available program (SPSS 12 for Windows, SPSS Inc., Chicago, IL, USA) was used to evaluate the differences between the groups by either Student’s t-test or a two-way Analysis of Variance (ANOVA) with post hoc test. The level of statistical significance was considered as 0.05.
Results
Evaluation of cell morphology and cell viability
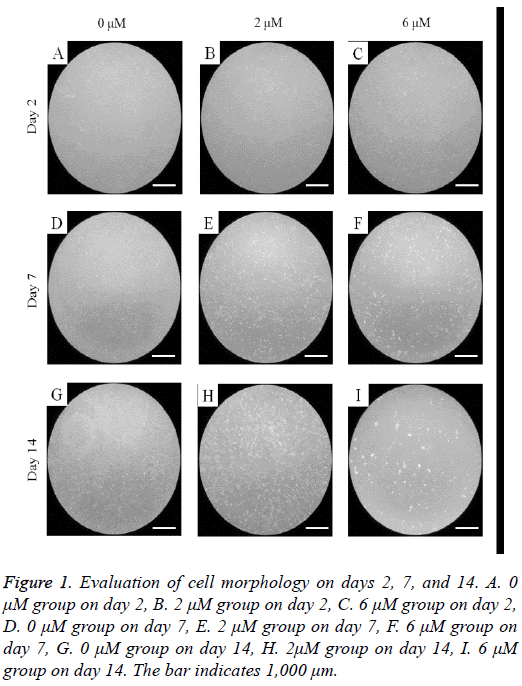
The untreated control group showed fibroblast-like morphology on day 2 (Figure 1). The shapes of the cells in 2 μM group were similar to the control group. However, the shapes of the cells in the 6 μM group were rounder with fewer cells. The morphologies of the cells on days 7 and 14 are shown in Figure 1. The shapes of the cells in the 2 μM groups were similar to those of the control group but not the 6 μM group.
Figure 1: Evaluation of cell morphology on days 2, 7, and 14. A. 0 μM group on day 2, B. 2 μM group on day 2, C. 6 μM group on day 2, D. 0 μM group on day 7, E. 2 μM group on day 7, F. 6 μM group on day 7, G. 0 μM group on day 14, H. 2μM group on day 14, I. 6 μM group on day 14. The bar indicates 1,000 μm.
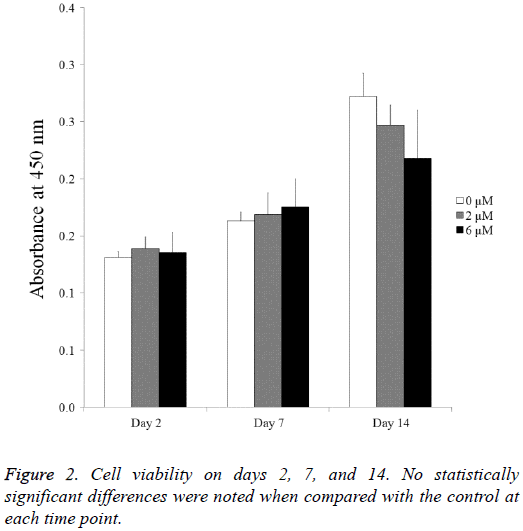
The cell viability results obtained at days 2, 7, and 14 are shown in Figure 2. The CCK-8 assay values seemed to increase as culturing time increased. The Cell Counting Kit-8 assay values of the 0 μM, 2 μM, and 6 μM group at day 2 were 100.0 ± 3.9, 105.8 ± 7.7, and 103.0 ± 13.7, respectively (P>0.05). The Cell Counting Kit-8 assay values of the 0 μM, 2 μM, and 6 μM group at day 7 were 124.4 ± 5.8, 128.7 ± 14.3, and 133.5 ± 18.7, respectively. The values of the 0 μM, 2 μM, and 6 μM groups at day 14 were 207.4 ± 15.5, 188.1 ± 13.3, and 166.0 ± 32.3, respectively (P<0.05).
Mineralization assay
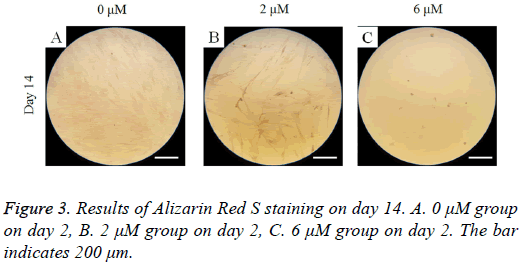
On day 14, Alizarin Red S staining revealed mineralized deposits was minimal (Figure 3). Decreased mineralization was noted in the 2 μM and 6 μM groups when compared the 0 μM control.
Alkaline phosphatase activity assays
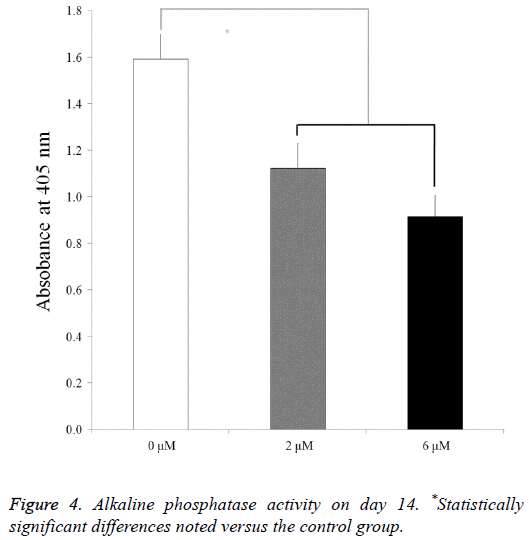
For the mesenchymal stem cells treated with lovastatin, the alkaline phosphatase activity decreased from the 0 μM to 6 μM groups (P<0.05) (Figure 4). The relative values of the 0 μM, 2 μM, and 6 μM groups on day 14 were 100.0 ± 6.8, 70.5 ± 6.8, and 57.5 ± 5.8, respectively.
Validation of mRNA expression by real-time polymerase chain reaction
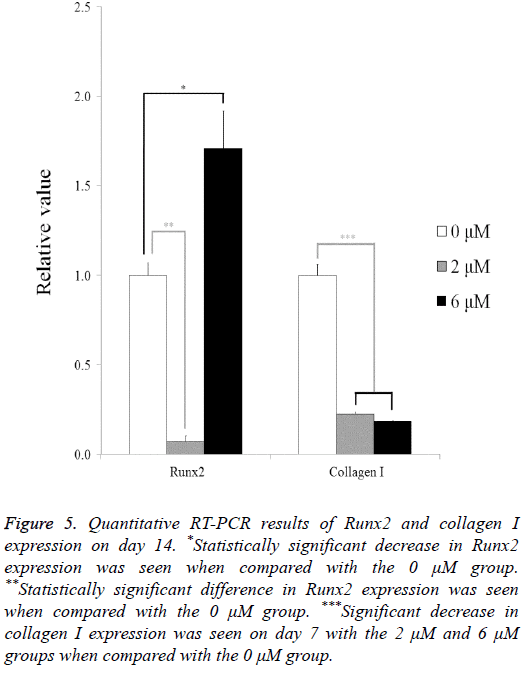
The quantitative RT-PCR results for the mRNA levels of Runx2 and collagen I are shown in Figure 5. The relative expressions of Runx2 among the 0 μM, 2 μM, and 6 μM groups at day 14 were 100.0 ± 7.0, 7.1 ± 3.3, and 171.0 ± 20.7, respectively. The relative expressions of collagen I among the 0 μM, 2 μM, and 6 μM groups at day 7 were 100.0 ± 6.0, 22.7 ± 0.8, and 18.6 ± 0.2, respectively.
Figure 5: Quantitative RT-PCR results of Runx2 and collagen I expression on day 14. *Statistically significant decrease in Runx2 expression was seen when compared with the 0 μM group. **Statistically significant difference in Runx2 expression was seen when compared with the 0 μM group. ***Significant decrease in collagen I expression was seen on day 7 with the 2 μM and 6 μM groups when compared with the 0 μM group.
Immunofluorescence
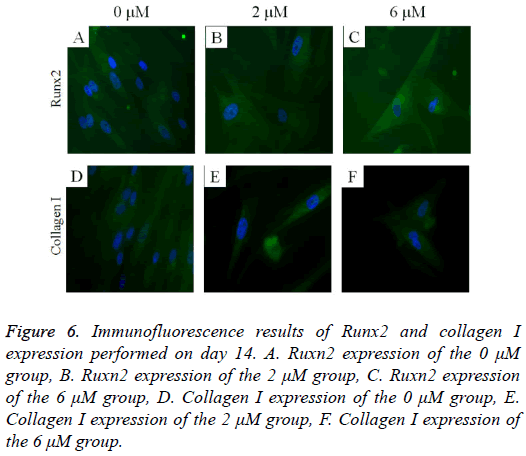
The immunofluorescent assays for Runx2 and collagen I are shown in Figure 6. Runx2 expression was shown to decrease as the dose of lovastatin increased. The expression of collagen I seemed to show similar trends: it decreased as the dose of lovastatin increased.
Figure 6: Immunofluorescence results of Runx2 and collagen I expression performed on day 14. A. Ruxn2 expression of the 0 μM group, B. Ruxn2 expression of the 2 μM group, C. Ruxn2 expression of the 6 μM group, D. Collagen I expression of the 0 μM group, E. Collagen I expression of the 2 μM group, F. Collagen I expression of the 6 μM group.
Western blot
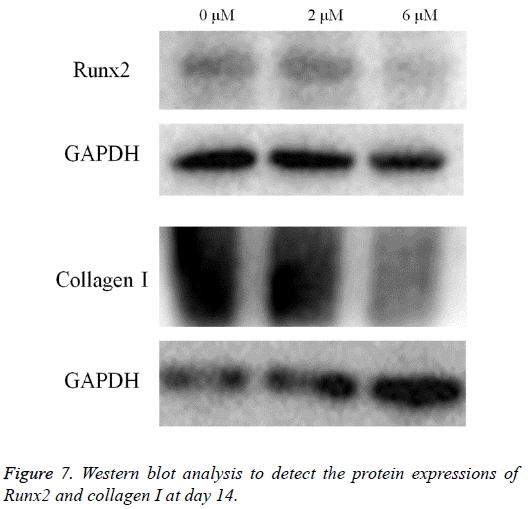
Western blot analysis was performed to detect the protein expression of Runx2, collagen I and GAPDH (Figure 7). The expression of Runx2 and collagen I seemed to decrease in the 2 μM and 6 μM groups when compared with the untreated control.
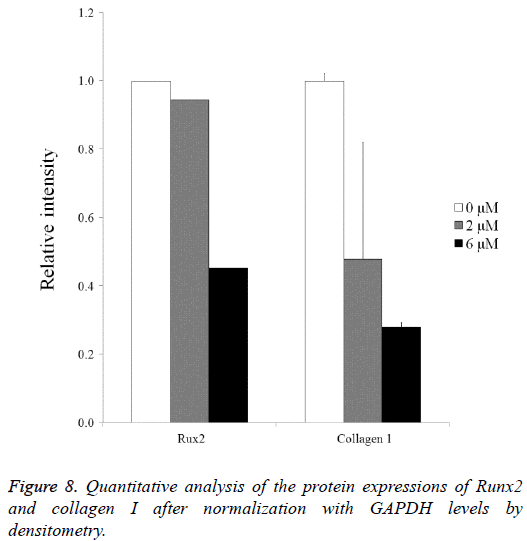
Normalization of the protein expressions of Runx2 on day 14 showed that the 0 μM, 2 μM, and 6 μM groups yielded 100.0, 94.4 and 45.2, respectively. Normalization of the protein expressions of collagen I on day 14 revealed that 0 μM, 2 μM, and 6 μM groups yielded 100.0 ± 2.2, 47.9 ± 34.1, and 28.0 ± 1.4, respectively (Figure 8).
Discussion
This study clearly shows that lovastatin in the tested concentrations decreased the viability of stem cells derived from gingiva and decreased the osteogenic differentiation of the stem cells via the Runx2 and collagen I pathway.
This report discusses the effects of lovastatin on the morphology of cells under predetermined concentrations (2 μM to 6 μM). In a previous study, lovastatin inhibited the proliferation of carcinoma cells: after 24 hours of exposure at 5 μM and 10 μM concentrations, cell growth decreased by 20 to 50%, respectively [11]. It was also shown that 10 μM of lovastatin inhibited the cell proliferation of cholangiocarcinoma cells [11]. Additionally, the stimulatory effects were shown at 1 μM of statin in human bone marrow stromal cells [2]. The lovastatin may have inhibited cell proliferation through transforming growth factor-β1 to block cyclooxygenase-2 and intercellular adhesion molecule-1 mRNA expression through serine/threonine kinase 11. Similarly, this study clearly showed decreased proliferation of stem cells at the tested concentrations. Although cytotoxicity evaluation of the lovastatin itself did not affect the morphology of the mesenchymal stem cells at 2 μM, higher doses of lovastatin (6 μM) produced rounder shapes with fewer cells. In this study, cell viability was evaluated using a Cell Counting Kit-8 assay, which is based on mitochondrial enzyme activity and the quantification of generated formazan [13]. Other methods may be applied to test cell proliferation [14-17]. Trypan blue is based on the principle that live cells have intact cell membranes which prevent penetration of the trypan blue dye [14]. A protein assay measures the protein content of the tested cells and this may be considered as an indirect measurement [15]. The MTT assay measures viability by analyzing the mitochondrial dehydrogenase activity of live cells; however, it requires the solubilization of formazan crystals [16]. A thymidine incorporation assay can be applied to evaluate cell proliferation [17].
Osteogenic differentiation can be evaluated through alkaline phosphatase activity, which is an early marker of ostegenesis [18]. Following the period of matrix maturation, nodule cells begin to mineralize the extracellular matrix and Alizarin Red S staining is used to evaluate the amount of calcium deposits [19]. In this study, decreased mineralization and alkaline phosphatase activity were noted in a dose-dependent manner. However, in a previous study, the transdermal application of lovastatin onto rats caused profound increases in bone formation [20]. Similarly, the application of lovastatin is reported to enhance fracture healing [21,22]. The differences in the type cells, stages of the cells, the duration of the culturing time, and the system can explain the differences in the responses [1].
Qualitative RT-PCR and Western blot analysis were performed to detect the mRNA and protein expression of Runx2 and collagen I to provide information on possible mechanisms. Runx2 is reported to regulate a complex gene-regulatory network [23]. Runx2 is shown to be the transcription factor required for the osteoblast lineage [24]. Runx2 protein can be detected in preosteoblasts, and its expression is upregulated in immature osteoblasts [24]. However, it is downregulated in mature osteoblasts [24]. Type I collagen is also involved in regulating the osteoblast phenotype and is shown to possess the ability to stimulate alkaline phosphatase activity [25]. The decrease of Runx2 and collagen I expression was also seen with immunofluorescent assay.
The effects of lovastatin on the cell viability and osteogenic differentiation of stem cells derived from human gingiva were evaluated. Applying lovastatin produced decreased cell viability and decreased osteogenic differentiation in this experimental setting. It should be considered that the use of higher doses of statin may yield a negative effect on cell viability and differentiation of stem cells.
Acknowledgments
This research was partly supported by Research Fund of Seoul St. Mary’s Hospital, The Catholic University of Korea and partly supported by Basic Science Research Program through the National Research Foundation of Korea (NRF) funded by the Ministry of Science, Information and Communication Technology and Future Planning (NRF-2014R1A1A1003106 and NRF-2016K1A1A8A01939075).
Conflict of Interest
The authors report no conflicts of interest related to this study. The author does not have any financial interest in the companies whose materials are included in the article.
References
- Park JB, Zhang H, Lin CY, Chung CP, Byun Y, Park YS. Simvastatin maintains osteoblastic viability while promoting differentiation by partially regulating the expressions of estrogen receptors alpha. J Surg Res 2012; 174: 278-283.
- Folli C, Descalzi D, Bertolini S, Riccio AM, Scordamaglia F. Effect of statins on fibroblasts from human nasal polyps and turbinates. Eur Ann Allergy ClinImmunol 2008; 40: 84-89.
- Park JB. Combined effects of simvastatin and fibroblast growth factor-2 on the proliferation and differentiation of preosteoblasts. Biomedical Rep 2013; 1: 812-814.
- Park YS, David AE, Park KM, Lin CY, Than KD. Controlled release of simvastatin from in situ forming hydrogel triggers bone formation in MC3T3-E1 cells. AAPS J 2013; 15: 367-376.
- Ha DH, Yong CS, Kim JO, Jeong JH, Park JB. Effects of tacrolimus on morphology, proliferation and differentiation of mesenchymal stem cells derived from gingiva tissue. Mol Med Rep 2016; 14: 69-76.
- Jeong SH, Lee JE, Kim BB, Ko Y, Park JB. Evaluation of the effects of CimicifugaeRhizoma on the morphology and viability of mesenchymal stem cells. ExpTher Med 2015; 10: 629-634.
- Jin SH, Lee JE, Yun JH, Kim I, Ko Y, Park JB. Isolation and characterization of human mesenchymal stem cells from gingival connective tissue. J Periodont Res 2015; 50: 461-467.
- Kwon JS, Park SH, Baek JH, Dung TM, Kim SW, Min BH. Gene transfection of human turbinate mesenchymal stromal cells derived from human inferior turbinate tissues. Stem Cells Int 2016; 2016: 4735264.
- Kim BB, Ko Y, Park JB. Effects of risedronate on the morphology and viability of gingiva-derived mesenchymal stem cells. Biomed Rep 2015; 3: 845-848.
- Wajid N, Anwar SS, Ali F, Zahoor M, Hamid N, Aslam MM. Medicinal significance of lovastatin. Int J Pharm Sci Res 2015; 6: 971.
- Yang SH, Lin HY, Changou CA, Chen CH, Liu YR, Wang J. Integrin beta3 and LKB1 are independently involved in the inhibition of proliferation by lovastatin in human intrahepatic cholangiocarcinoma. Oncotarget 2016; 7: 362-373.
- Park JB. The use of simvastatin in bone regeneration. Med Oral Patol Oral Cir Bucal 2009; 14: 485-488.
- Jeong SH, Kim BB, Lee JE, Ko Y, Park JB. Evaluation of the effects of Angelicaedahuricae radix on the morphology and viability of mesenchymal stem cells. Mol Med Rep 2015; 12: 1556-1560.
- Lee SI, Yeo SI, Kim BB, Ko Y, Park JB. Formation of size-controllable spheroids using gingiva-derived stem cells and concave microwells: Morphology and viability tests. Biomed Rep 2016; 4: 97-101.
- Park JB. Effects of 17-alpha ethynylestradiol on proliferation, differentiation & mineralization of osteoprecursor cells. Ind J Med Res 2012; 136: 466-470.
- Park JB. Effects of low doses of estrone on the proliferation, differentiation and mineralization of osteoprecursor cells. ExpTherap Med 2012; 4: 681-684.
- Ahmed SA, Gogal RM, Walsh JE. A new rapid and simple non-radioactive assay to monitor and determine the proliferation of lymphocytes: an alternative to [3H] thymidine incorporation assay. J Immunol Methods 1994; 170: 211-224.
- Park JB. Low dose of doxycyline promotes early differentiation of preosteoblasts by partially regulating the expression of estrogen receptors. J Surg Res 2012; 178: 737-742.
- Park JB. The effects of dexamethasone, ascorbic acid, and beta-glycerophosphate on osteoblastic differentiation by regulating estrogen receptor and osteopontin expression. J Surg Res 2012; 173: 99-104.
- Gutierrez GE, Lalka D, Garrett IR, Rossini G, Mundy GR. Transdermal application of lovastatin to rats causes profound increases in bone formation and plasma concentrations. Osteoporosis Int J Eur Foundation Osteoporosis Nat Osteoporosis Foundation USA 2006; 17: 1033-1042.
- Garrett IR, Gutierrez GE, Rossini G, Nyman J, McCluskey B, Flores A. Locally delivered lovastatin nanoparticles enhance fracture healing in rats. JOrthop Res Off PublOrthop Res Soc 2007; 25: 1351-1357.
- Gutierrez GE, Edwards JR, Garrett IR, Nyman JS, McCluskey B, Rossini G. Transdermal lovastatin enhances fracture repair in rats. J Bone Mineral Res 2008; 23: 1722-1730.
- Wu H, Whitfield TW, Gordon JA, Dobson JR, Tai PW, van Wijnen AJ. Genomic occupancy of Runx2 with global expression profiling identifies a novel dimension to control of osteoblastogenesis. Genome Biol2014; 15: 1.
- Komori T. Regulation of osteoblast differentiation by Runx2. AdvExp Med Biol 2010; 658: 43-49.
- Shi S, Kirk M, Kahn AJ. The role of type I collagen in the regulation of the osteoblast phenotype. J Bone Mineral Res 1996; 11: 1139-1145.
