ISSN: 0970-938X (Print) | 0976-1683 (Electronic)
Biomedical Research
An International Journal of Medical Sciences
Research Article - Biomedical Research (2018) Volume 29, Issue 18
Robust denoising technique for ultrasound images by splicing of low rank filter and principal component analysis
Sumit Kushwaha* and Rabindra Kumar Singh
Kamla Nehru Institute of Technology, Sultanpur, Uttar Pradesh, India
Accepted on August 14, 2018
DOI: 10.4066/biomedicalresearch.29-18-853
Visit for more related articles at Biomedical ResearchRobust image denoising techniques are still a significant challenge for medical ultrasound images. Though the difficulty of the recently proposed strategies, most techniques have not yet achieved desired level of applicability. The principle focus of this paper is a thresholding strategy together with a splicing of Low Rank Filtering (LRF) and Principal Component Analysis (PCA) techniques. By means of the proposed robust denoising technique, the denoised medical ultrasound image is assessed until the point that it reaches desired level. The input noisy medical ultrasound image is given to the hybridization technique of LRF mechanism and PCA transformation which is used for removing the noise in medical ultrasound image. For effective image denoising, the segmentation process is done with the guide of sparse decomposition framework. Consequently, denoised image threshold is compared with the threshold value of training images in the database and this is repeated until we get a better denoised image. For analysis purpose, the set of five medical ultrasound images of artery have been considered. These medical ultrasound images are used for quantitative analysis. Performance of these recent filters as two phase matrix decomposition denoised filter, new adaptive denoised filter, and fast fourier bessel steerable PCA (FFBsPCA) denoised filter have been compared with our proposed splicing denoised method in terms of peak signal to noise ratio (PSNR) value and mean square error (MSE) value performance index under various noise density selection. Analytical results for set of five medical ultrasound images have shown that this proposed splice filtering method is more robust for noise reduction. So, it has shown that proposed splice filtering method is robust for medical ultrasound image denoising which preserves the clinical details and minimizing the noise level in medical ultrasound images.
Keywords
PCA, Segmentation process, Sparse decomposition framework, PSNR.
Introduction
Evolving from the advances in related imaging technologies over the past decades, medical imaging plays an important role in real time diagnostic [1]. Due to the rapid development of the imaging devices, noise is attached with it which can degrade the quality of the image. To enhance the quality of the image the preprocessing steps are utilized among them [2,3]. Robust denoising algorithm is meant to reduce the noise, errors which are identified in a medical ultrasound image [4]. The estimation of a medical ultrasound image in denoising is done from the noisy observations [5]. Noise in medical images is an undesirable issue, and hence it is significant to characterize reasonable image priors for regularization [6]. Also it is found as a traditional medical ultrasound image recovery issue and the objective is to reestablish a clean image from its clarifications [7]. During denoising it is necessary to hold important features, such as edges, corners and other sharp structures [8]. In medical image denoising the curiosity in utilizing a fractional mask window operator based on fractional calculus has developed [9]. To achieve reconstructed images, most techniques utilize a filter based strategy [10]. The image denoising filters for the removal of noise are the Gaussian filters which is meant to provide detailed information about the loss of the image. Algorithms such as mean filter, median filter and wavelet transform are some used to denoised images [11,12].
The rest of the paper is organized as follows. Section 2 reviews related researches on denoising of medical images. Section 3 describes the proposed system for minimization of the noise in medical ultrasound image by splicing of LRF and PCA. Section 4 presents the experimental results and comparative analysis of the proposed robust denoising technique. Finally, section 5 shows conclusion.
Related Research
Some of the recent related researches on medical ultrasound image noise minimization, segmentation, transformations, and speckle depression are described in this section.
An improved weighted non-local means algorithm for image denoised was described by Lingli [13]. In this strategy, each pixel was replaced by the weighted mean of the pixels with the adjacent pixels. He has tried their technique with different images by including different levels of noise density. The spatial domain smoothing was effective to remove the additive Gaussian noise in the noisy image. This strategy was to replace the power estimation of each pixel by a weighted normal of all force estimations of its neighborhood. The weight was computed by means of the Gaussian filter or box filter. The basic technique for the Gaussian filter was that the estimation of the pixels of its neighborhood was given different weighting which was described by a spatial Gaussian distribution.
Yong-Qiang et al. [14] discussed a crucial pre-process step to improve the performance of subsequent applications called Hyper Spectral Image (HSI) denoising jointly with the global and local Rank Analysis of Clean and Noisy (RAC) in spatial/ spectral domains. Additionally, denoising performance was enhanced highly since used with RAC. HSI contains multiple images acquired from a continuous spectrum with narrow bandwidth, and there was great difference in different band subsets. As a statistical image modeling technique, sparse representations have been used successfully in image denoising.
He et al. [15] described about the technique iterative Low- Rank Matrix Approximation (LRMA) for HSI denoising due to the low-dimensional property of clean existing HSI. LRMA was introduced based on the low-rank property of HSI by which the patch wise LRMA was established. An iterative regularization framework was given to separate the noise from the signal subspaces. The adaptive factor selection was done based on the noise variance of each HSI band that considers the different noise intensity in different bands. LRMA optimization problem occurred was solved by the utilization of a Randomized Singular Value Decomposition (RSVD) method.
Paras et al. [16] described edge preserving image denoised technique based on wavelet transforms. To transform the image into the wavelet area the multilevel decomposition of the noisy image was carried out. A locally adaptive patch-based (LAPB) thresholding scheme was utilized to reduce noise while conserved relevant features of the original image. The wavelets were valuable in edge-saving image denoised issues. Wavelet transforms demonstrate localization in both time and frequency. The localized idea of the wavelet transforms in both time and frequency results in denoised in coordination with edge protection. Wavelet based denoised techniques ordinarily transform the image into different sub bands of wavelet coefficients at different introductions and resolution scales.
Zhang et. al. [17] described discriminative model learning for image. In that work residual learning and batch standardization were utilized to speed up the training process and furthermore boost the denoised performance. Here a specific model was prepared for Additive White Gaussian Noise (AWGN) at a certain noise level and hence the Denoising Convolutional Neural Networks (DnCNN) model could deal with Gaussian denoising with obscure noise level. DnCNN was effortlessly stretched out to deal with general image denoising tasks. Prepare a solitary DnCNN model for blind Gaussian denoising, and achieve preferable performance over the competing strategies prepared for a specific noise level.
Alin et al. [18] have discussed the speckle suppression method for medical ultrasound image. The logarithmic transfer of the original image is analysed into the multiscale wavelet domain. Also shown that the subband decomposition of ultrasound images have significantly non-Gaussian statics are described such as alpha-stable. It also designs a Bayesian estimator that exploits the statistics. Hard thresholding methods applied on actual ultrasound medical images and we quantify the achieved performance improvement.
Young et al. [19] described a novel non-linear multiscale wavelet diffusion method for ultrasound speckle suppression and edge enhancement. Denoising properties are analysed by sparsity and multi resolution properties of wavelet with a tuning diffusion threshold strategy. Both the envelope detected speckle image and log compressed ultrasonic image can be directly proposed by the algorithm without need for additional pre-processing. This can improve the image quality for both visualization and auto-segmentation applications.
Medical Ultrasound Image Denoising Through Splicing of LRF and PCA
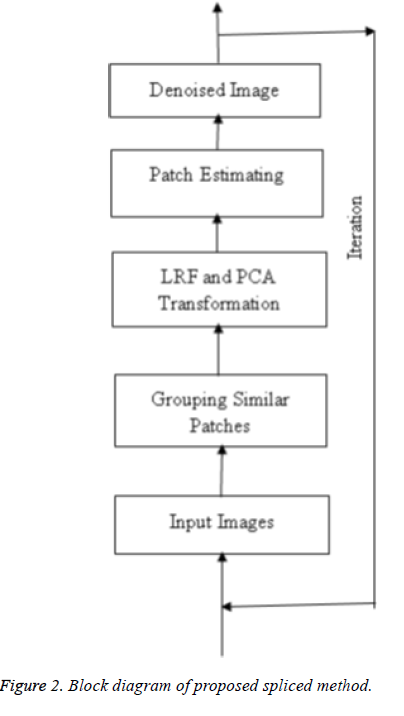
This section explains the system design and methodology which concern with ultimate design and the features of proposed technique. The overall process of the proposed technique is illustrated in Figure 1. Initially an evaluation process is done using the input medical ultrasound image. In the evaluation phase, a threshold value (Thr) is determined for each image. The threshold value of the image is initially estimated. Then the image utilizes the splicing of LRF method with PCA transformation in ultrasound image denoising. The resultant image is segmented to retrieve the sensitive features in a medical ultrasound image including shape and size of the image. The segmentation is done with the aid of sparse decomposition framework meant to check foreground and background pixels of the image in order to reduce the unwanted pixels existing in the image. If the obtained image threshold value is less than the threshold value (0 ≤ x ≤ Thr, Thr is the noise of database images) obtained from the training set of 23 human artery test images, then the image is identified noiseless otherwise the process is repeated until the desired threshold value is in attained resulting a denoised image.
Threshold value evaluation phase
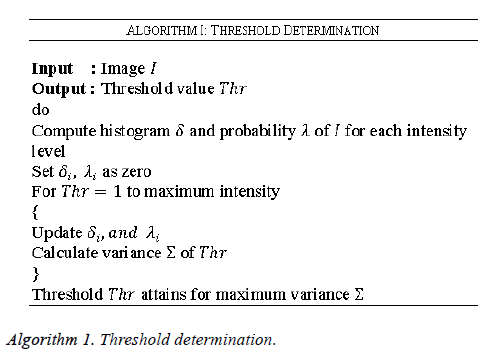
In the evaluation phase, the threshold value for each image is determined in order to rectify the noise recognized by the medical ultrasound images. In this work the medical ultrasound images are taken as the input since any deviation occurring in this image may lead to the death of the individual. The threshold determination for the medical ultrasound images are determined by the steps given as given in Algorithm 1. As given in algorithm initially the histogram is computed followed by the probability calculation for every intensity level along with estimation of variance.
The noisy images can be determined by analyzing the pixel value. Based on Algorithm 1 the threshold values are initially determined for denoised ultrasound images and are stored in the database. This threshold value is utilized for final classification of noisy and noiseless ultrasound images. In this work a special case of noise called the AWGN is considered, in which the values at any pair of times are identically distributed and statistically independent.
Let D be the database of ultrasound medical images and let the dimension of each image be M × N and Pij be the number of pixels of the image (I). Initially, the image regions of the medical ultrasound images are selected from the collection of images that exists in the database D and is given as input. The images in the database D is given as in Equation 1.
D=I0, I1,......., Ik 0 ≤ k ≤ Num → (1)
where k indicates the kth image and Num indicates number of images in the database.
Since the ultrasound image I include AWGN and multiplicative noise [20],
IG=I × N (Z)+G (Z) → (2)
where, IG-Noise added image,
G (z)-Additive white Gaussian noise and z represents the gray level.
N(Z)-Multiplicative noise as speckle noise and z represents the gray level.
and the probability distribution function for additive white Gaussian noise is given as in Equation 3.

Where σ represents the standard deviation of noise, μ represents the mean or average of the Gaussian function. This AWGN and speckle noise are identified in the ultrasound images, then removed in the next stage where the LRF and PCA is spliced in order to yield a better result in terms of low MSE and high PSNR value.
Splicing of LRF and PCA for noise minimization
Noisy medical ultrasound image is given to this spliced block in order to minimization of the noise and other discontinuities. Formally, the PCA are used uniquely for image denoising which involved its own advantages and disadvantages. The PCA includes some advantages such as lack of redundancy of data, reduced complexity in images, only a small database representation is needed since only the trainee images are stored in the form of their projections on a reduced basis. A notable property obsessed by PCA is that the energy concentrates on a small subset of PCA transformed image data set while the noise spreads over the whole image dataset. Therefore, signal and noise can be distinguished in the PCA transform domain. The disadvantages in PCA occurs due to the covariance matrix which is difficult to be evaluated in an accurate manner also, even the simplest invariance is not efficiently captured by the PCA until the training data explicitly provides information. Hence in order to rectify the problems in medical ultrasound image denoising the PCA is hybridized or spliced with the LRF Mechanism and improves the performance in terms of MSE and PSNR.
LRF technique is used to filter the both AWGN and speckle noise from the medical ultrasound image which efficiently improves the PSNR of medical image data corrupted by noise. In LRF, image patches are grouped by block matching, so that the patches in each group are fragmented similar to basic image constructions. Thus, similar patches are grouped into a matrix, with vectorized image patches at its columns, make a noisy version of an approximately low-rank matrix. Depending on this reflection, recovery of original image patches is grouped as the problem of low-rank matrix recovery. The LRF is used to remove noise from patch matrices created from similar patches. After doing so for all patch matrices, the denoised patches are combined to obtain the whole image estimates. As the LRF includes some advantages such as the approximation of the pixel values in order to reduce noise. In this filtering mechanism PCA is spliced with the LRF. Thus, reducing the disadvantages occurred in a noisy image with the combination of the low rank approximation image pixels with the covariance matrix in PCA.
Let  be a low rank matrix (tensor). Low rank matrix
recovery aims to estimate the latent low matrix X from noisy
observation Y,
Y=X+σIG → (4)
We consider the following methodology at the start of each iteration to update the noisy image that the estimator develops as an input.

where, i-iteration number,
IG-Input noisy image,
IF-Estimation of the original image,
y, -small positive real numbers that controls the amount of noise fed back to the next iteration.
Take, X=x1, x2, x3,......,xm to be an m component vector variable. X the m × n sample matrix of X is given below condition as in Equation 6,

For i=1, 2, 3....... m and j=1, 2, 3, .......n, xi j is the discrete sample of variable Xi. The ith row of sample matrix given by  is the sample vector of Xi. The mean
value of xi is estimated as

Thus the mean value vector of y is given below as in Equation 7

Centralized vector  and the element of
 is
is
 The sample vector of
  is
is  where, xi-j=xij=yi.
Accordingly the centralized matrix X̅ of X is given as in
Equation 8.

The co-variance matrix of Y is considered as in Equation 9,
Y=PT X
In PCA transformation, an orthonormal transformation matrix
PT is calculated to decorrelated  such that the
covariance matrix of
  is diagonal.
Where,  is the m × m orthonormal
eigenvector matrix
  is the diagonal
eigenvalue matrix with
  The terms φ1,
φ2,....... φn and λ1, λ2....... λm are the eigenvectors and
eigenvalues as in Equation 10.

X̅, can be decorrelated as in Equation 11,

PCA transformation though it is a denoising technique it includes inverse PCA transformation to improve the image quality and also results in time complexity. Hence in order to reduce these disadvantages the PCA transformation denoising technique is hybridized with another efficient denoising technique LRF, thus achieving a better image quality. Apart from that the PCA also includes some other limitations such that it relies on orthogonal transformation of original variables, also it is based on mean vector and covariance matrix, not all distributions are not characterized and is also not scale invariant. Hence the PCA transformation is hybridized or spliced with the LRF and without including the inverse PCA and finally the hybridized or spliced equation is given as in Equation 12,

The denoising approach using splicing of LRF and PCA is presented in Figure 2.
Segmentation with sparse decomposition framework
The spliced output is moved to the segmentation process by which the perfect area is segmented by evaluating the foreground pixels which are the individual unit of foreground section of an image, background pixels, edge based and region based segmentation. The issue of image denoising and segmentation can be modeled in a sparse decomposition system. The segmentation process is basically used to identify objects or other relevant data in images such as detection of area limits foreground, background or edges. In this background layer is modeled with a smooth component, though the foreground layer is modeled with a sparse component which are threshold values by which the difference between the noisy the components used for sparsity with wide range of position, orientation, scales. The fundamental objective of segmentation in our research is to decompose the image into components and this decomposition under an arrangement of sensible priors which advances the sparsity and the connectivity of pixels in foreground layers, and furthermore anticipates utilizing excessively numerous bases for background layer. The segmented image can be resolved utilizing the equation expressed below.

Where,
Ysgm-segmented image
Yb-smooth background image,
Yf-foreground image.
After this the detection of the threshold values obtained during the training stage is checked with the currently occurred threshold values by which the difference between the noisy image and noiseless image can be classified. A threshold value is set and the value beyond this level is identified as the noise image and lower this level is identified as the noiseless image. If the image is identified as noisy then the process is iterated continuously until a denoised image is obtained.
Results
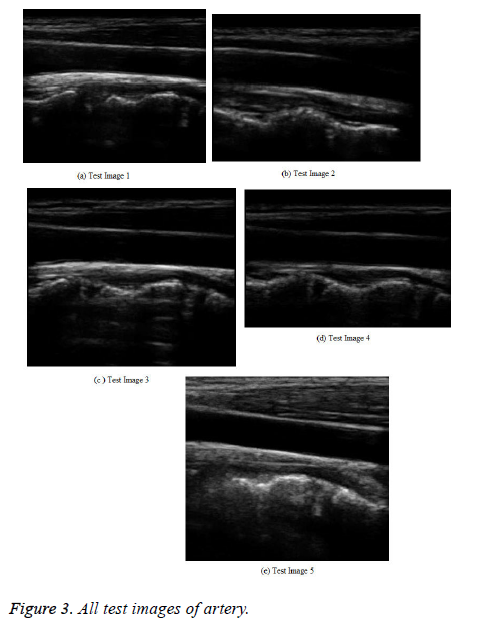
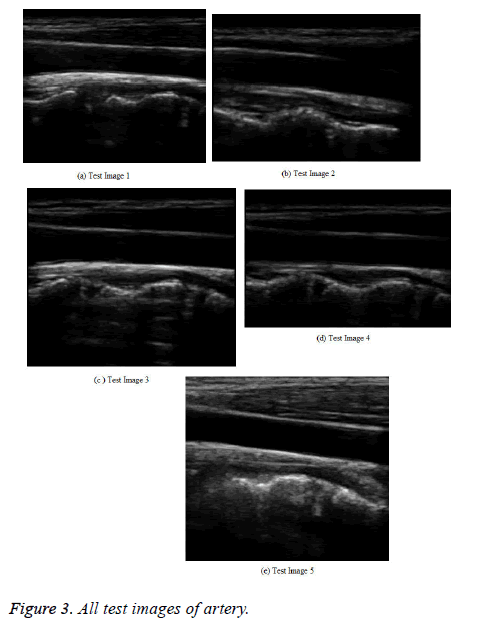
The proposed splice filtering method is implemented in the MATLAB working platform and the performance is evaluated with different images. In the simulation result, the medical ultrasound noisy image is utilized where we use 23 human artery images [21] for training phase I0, I1,......, Ik. These images are trained and the corresponding threshold values are calculated for every input human artery image. These values are utilized in the testing phase.
In the testing phase, a medical ultrasound image with AWGN is given to the splicing process. In this, each grouped patch collaborates for the filtering with all others in its own group, and vice versa. The result for hybridization or splicing analysis, which has an image with a better PSNR shows a broad multiple structures (Figure 3).
| Hardware platform | Processor name | Clock cycle (GHz) | RAM (GB) | Graphics card | Operating system name |
|---|---|---|---|---|---|
| Computer system | Intel (R) Core (TM) i5-6198DU CPU | 2.40 GHz | 4 GB | 2 GB (NVIDIA GEFORCE 920MX) | Window 10 Pro, x64-based processor, 64-bit operating system |
Table 1. Details of hardware platform used for simulation along with their operating system.
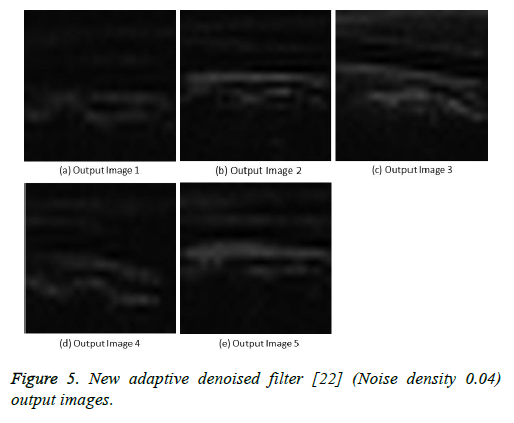
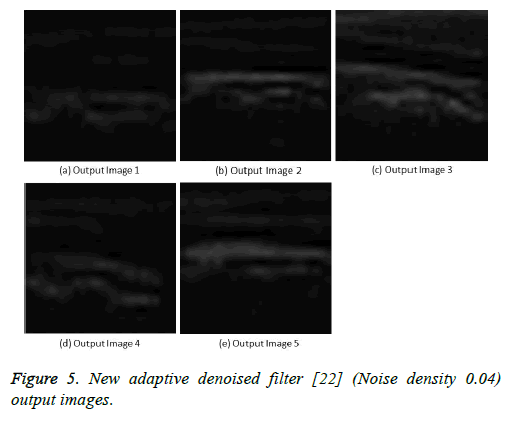
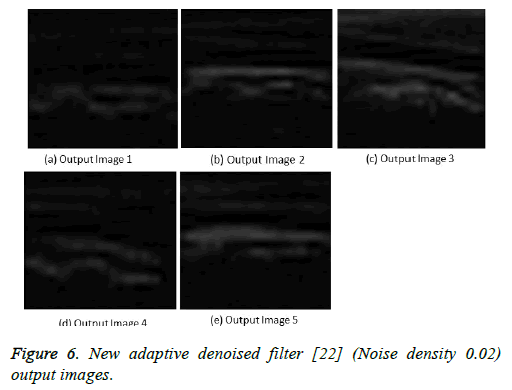
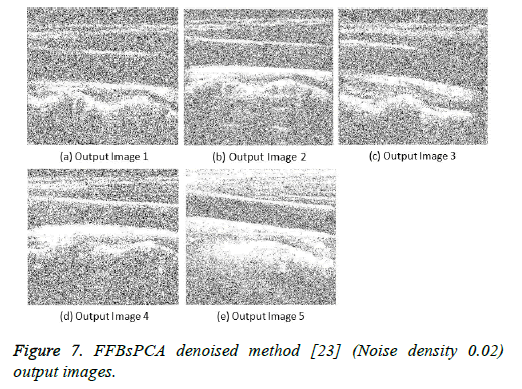
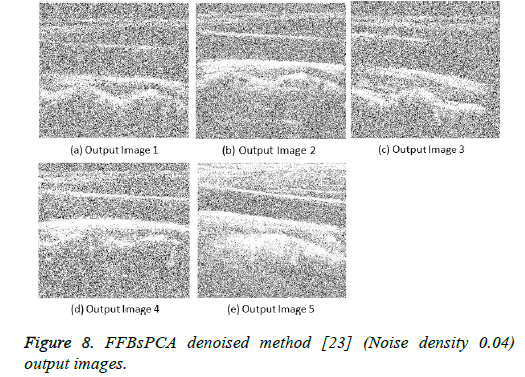
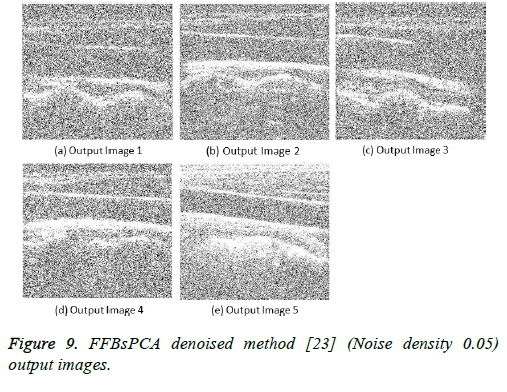
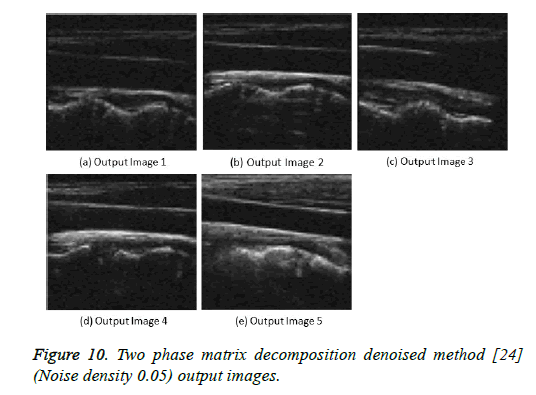
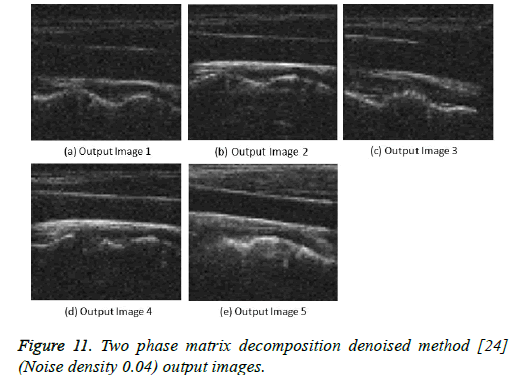
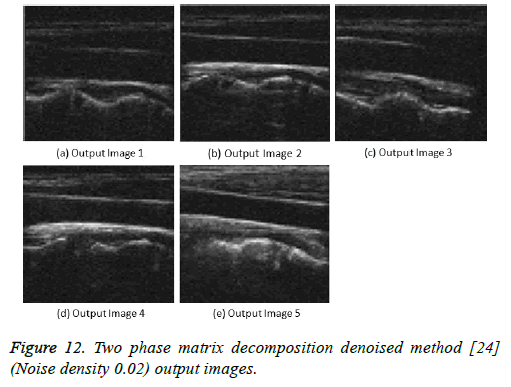
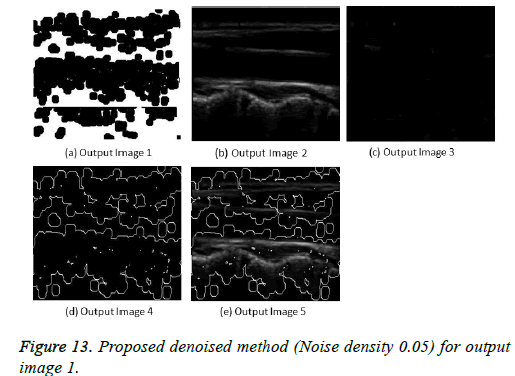
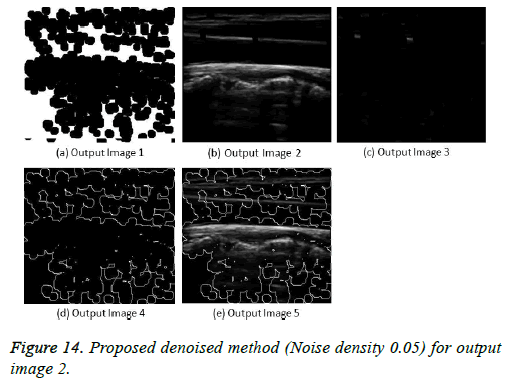
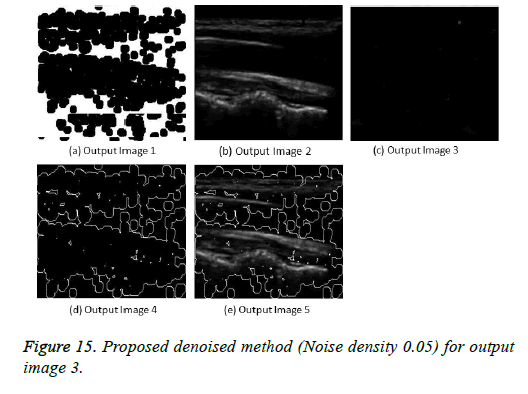
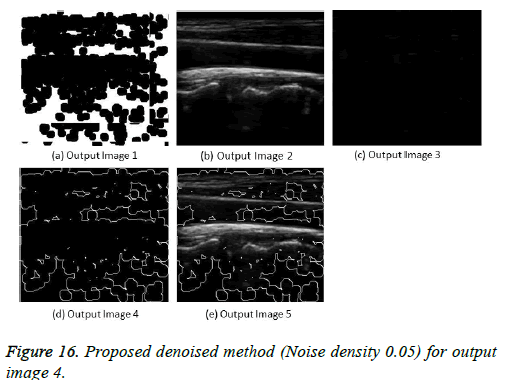
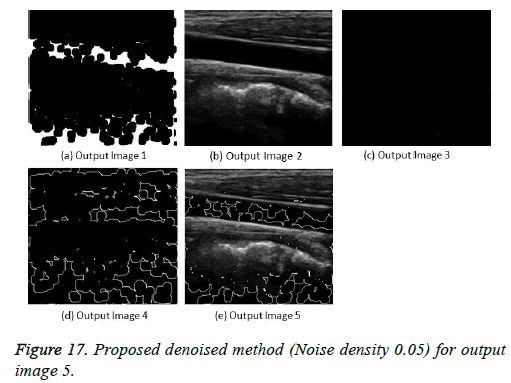
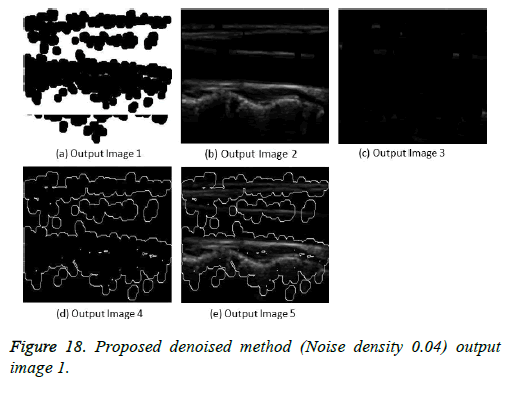
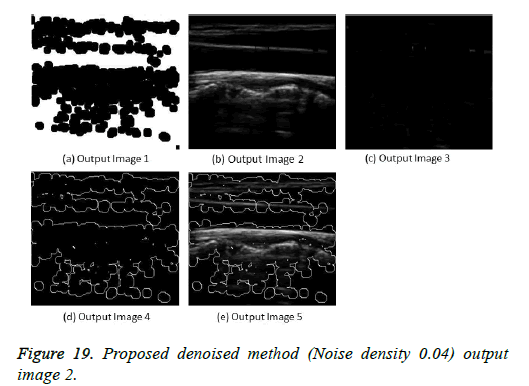
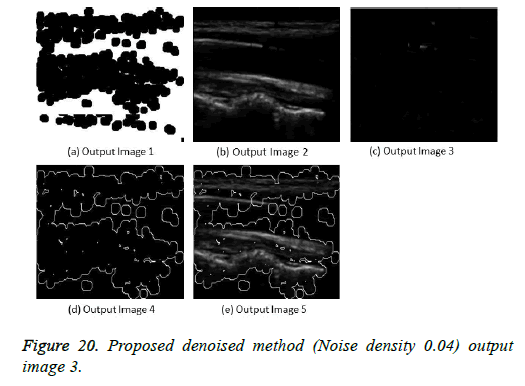
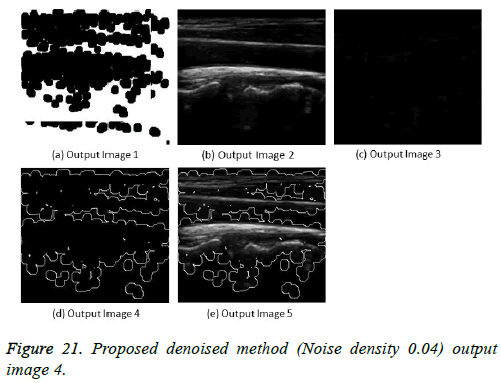
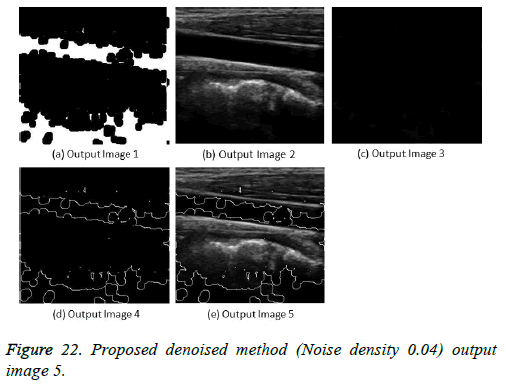
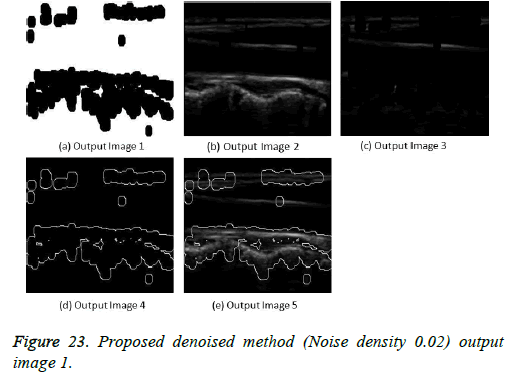
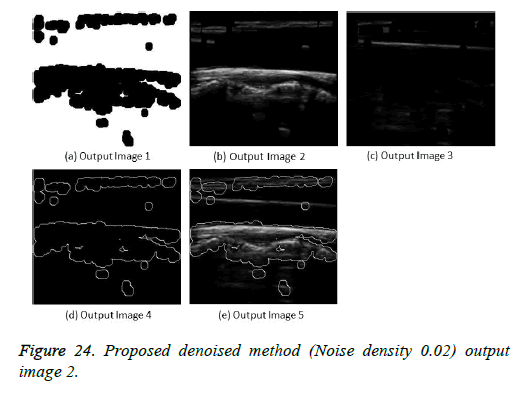
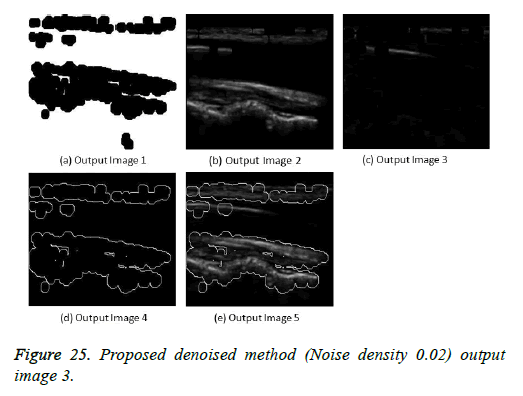
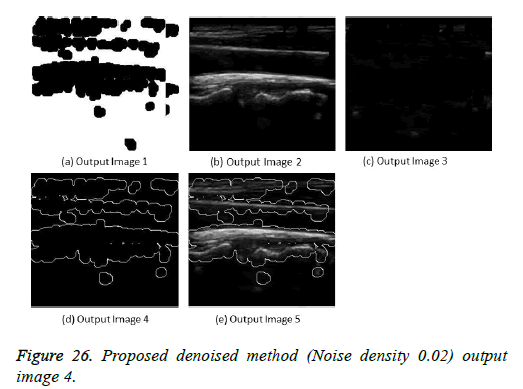
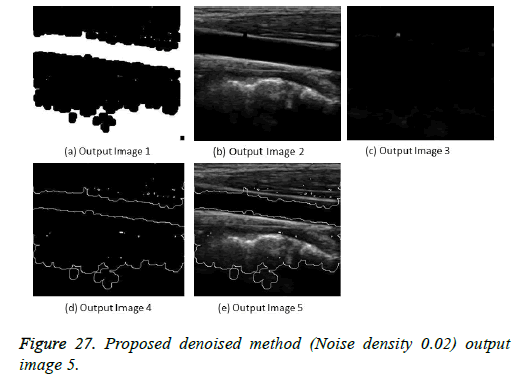
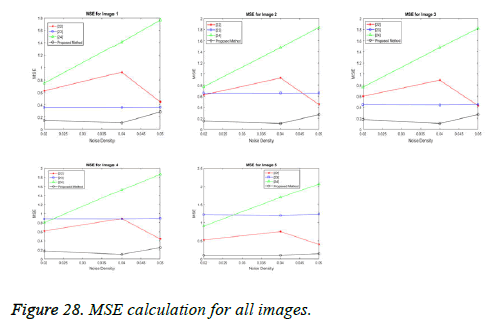
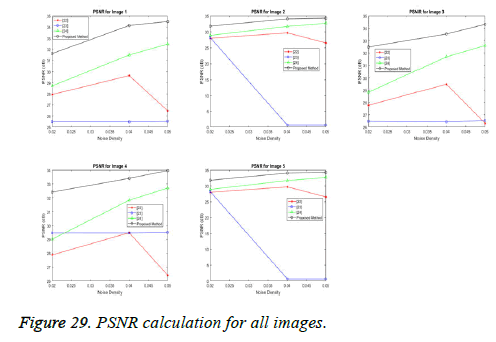
The image segmentation is the process of dividing ultrasound image with same features and attributes. Image segmentation can be done via three perspectives: region approach, edge approach and image clustering. Denoising techniques are also listed under similarity detection in which foreground, back ground regions and edge image are detected where pixels are identified and unwanted pixels are eliminated. If the output image is denoised then the process will be terminated otherwise it is executed recursively. All results are shown from Figures 4 to 29.
Figure 5: New adaptive denoised filter [22] (Noise density 0.04) output images.
Figure 6: New adaptive denoised filter [22] (Noise density 0.02) output images.
Figure 7: FFBsPCA denoised method [23] (Noise density 0.02) output images.
Figure 8: FFBsPCA denoised method [23] (Noise density 0.04) output images.
Figure 9: FFBsPCA denoised method [23] (Noise density 0.05) output images.
Figure 10: Two phase matrix decomposition denoised method [24] (Noise density 0.05) output images.
Figure 11: Two phase matrix decomposition denoised method [24] (Noise density 0.04) output images.
Figure 12: Two phase matrix decomposition denoised method [24] (Noise density 0.02) output images.
Simulation results
The performance of the proposed spliced filtering method is evaluated through the parameters PSNR, and MSE with different ultrasound image data is shown in the following figures. Five test images are considered and their corresponding values are illustrated in Table 2.
| Test image number | Noise density | Performance Comparison of Different Filters for All Images | |||||||
|---|---|---|---|---|---|---|---|---|---|
| PSNR | MSE | ||||||||
| [24] | [23] | [22] | Proposed | [24] | [23] | [22] | Proposed | ||
| Image 1 | 0.02 | 27.9424 | 25.4925 | 28.7256 | 31.6116 | 0.6226 | 0.3542 | 0.7457 | 0.1449 |
| 0.04 | 29.6482 | 25.4875 | 31.488 | 34.1339 | 0.9222 | 0.3538 | 1.4086 | 0.1038 | |
| 0.05 | 26.4739 | 25.5227 | 32.4596 | 34.4873 | 0.444 | 0.3567 | 1.7618 | 0.281 | |
| Image 2 | 0.02 | 27.9488 | 28.1582 | 28.874 | 31.7657 | 0.6236 | 0.6544 | 0.7716 | 0.1502 |
| 0.04 | 29.6758 | 0.6529 | 31.6855 | 34.041 | 0.9281 | 0.6529 | 1.4742 | 0.1038 | |
| 0.05 | 26.5254 | 0.6546 | 32.6353 | 34.2511 | 0.4493 | 0.6546 | 1.8345 | 0.2661 | |
| Image 3 | 0.02 | 27.7637 | 26.4728 | 28.8337 | 32.4811 | 0.5975 | 0.4439 | 0.7645 | 0.1771 |
| 0.04 | 29.4897 | 26.4318 | 31.6864 | 33.5379 | 0.8891 | 0.4397 | 1.4745 | 0.1038 | |
| 0.05 | 26.3125 | 26.5267 | 32.5958 | 34.3115 | 0.4278 | 0.4494 | 1.818 | 0.2699 | |
| Image 4 | 0.02 | 27.8724 | 29.4679 | 29.0102 | 32.4063 | 0.6127 | 0.8847 | 0.7962 | 0.174 |
| 0.04 | 29.478 | 29.4612 | 31.8216 | 33.3965 | 0.8867 | 0.8833 | 1.5211 | 0.1038 | |
| 0.05 | 26.4156 | 29.505 | 32.6959 | 33.9586 | 0.4381 | 0.8923 | 1.8603 | 0.2488 | |
| Image 5 | 0.02 | 27.1722 | 30.8619 | 29.5525 | 30.1607 | 0.5215 | 1.2195 | 0.9021 | 0.1038 |
| 0.04 | 28.7655 | 30.7782 | 32.3 | 31.7957 | 0.7526 | 1.1963 | 1.6982 | 0.1038 | |
| 0.05 | 26.0117 | 30.9028 | 33.1411 | 31.6968 | 0.3992 | 1.2311 | 2.0612 | 0.1478 | |
Table 2. Performance Comparison of Different Filters with PSNR and MSE values for Various Noise Density.
The denoised image can be evaluated by PSNR and MSE. The performance ratio for the denoised image must be always high in order to obtain good quality image and clear image. Denoising thus eliminates unwanted pixels in order to gain high performance ratio.
1) Mean square error (MSE): The MSE measure is popular because it correlates reasonable with subjective visual quality tests and it is mathematically controllable. Consider an original digital image f (x, y) for x=1, 2, 3,......, M and y=1, 2, 3,......, N, which is regarded as a reference image, where x and y are the spatial co-ordinates, and
f̂ (x, y) is an output image of the same spatial dimensions as f (x, y), then MSE is defined as:

2) Peak signal-to-noise ratio (PSNR): The PSNR, expressed in dB, is used instead of SNR in the case of images or video. The expression for the PSNR is essentially the same as in the case of SNR, but for the numerator, signal strength of (2B-1) is used, where B represents bits per sample. The value of (2B-1) corresponds to the maximum gray level value, such as in a pixel. For example, if B=8 bits per sample, then (28-1)=255 corresponds to the maximum gray level value. PSNR in terms of MSE can be defined as:

In our proposed spliced filtering method, PSNR is high and MSE is low when compared with existing studied method and it displays the resultant graph image with better quality and clear images are shown in Figures 28 and 29. Matrix decomposition decomposes a given matrix into two components if they have low rank and sparse properties. The FFBsPCA algorithm [23] computes the expansion coefficients of the images in a Fourier–Bessel basis efficiently using the non-uniform fast Fourier transform. Then the existing adaptive image denoising method is responsible for shrinking the noisy coefficients by utilization of an adaptive threshold. When compared with these existing techniques, the proposed spliced filtering method provides a better PSNR value and lower MSE value, since it splices the covariance matrix in PCA with the low rank matrix in LRF.
Conclusion
In this paper, a robust spliced denoising technique has been discussed. This technique can reduce noise effectively and preserve the diagnostic details of the medical ultrasound image up to a desired level. There is a thresholding strategy applied with splicing of LRF and PCA. It performs better than two phase matrix decomposition denoised filter, new adaptive denoised filter, and FFBsPCA denoised filter for all five artery ultrasound test images which have resulted in terms of output images, MSE and PSNR graphs. Its performance has compared with these methods where it shown that higher PSNR value and lower MSE value. Also, quantitative analysis has been shown in Table 1 for all artery ultrasound test images. This has shown that proposed hybridized filtering method have substantial achievement in enhancing the overall quality of medical ultrasound images. So, it has shown that proposed spliced filtering method is robust for medical ultrasound image denoising which preserves the clinical details in medical ultrasound images and minimizing the noise level.
References
- Sonika SA, Pardeep K. Analysis of various issues in non-local means image denoising algorithm. Int J Adv Res Comp Commun Eng 2016; 5: 740-745.
- Xingzheng W, Haoqian W, Jiangfeng Y, Yongbing Z. A new method for nonlocal means image denoising using multiple images. PLoS One 2016; 11.
- Hari O, Mantosh B. An improved image denoising method based on wavelet thresholding. J Sig Info Proc 2012; 3: 109-116.
- Metzler AC, Arian M, Richard GB. From denoising to compress sensing. IEEE Trans Info Theor 2016; 62: 5117-5144.
- Oymak S, Babak H. Sharp MSE bounds for proximal denoising. Found Comp Math 2016; 16: 965-1029.
- Pang J, Gene C, Antonio O, Au CO. Optimal graph Laplacian regularization for natural image denoising. IEEE International Conference on Acoustics, Speech and Signal Processing (ICASSP) 2015; 2294-2298.
- Enming L, Chan Stanley H, Nguyen Truong Q. Adaptive image denoising by targeted databases. IEEE Trans Image Proc 2015; 24: 2167-2181.
- Paras J, Vipin T. An adaptive edge-preserving image denoising technique using tetrolet transforms. Vis Comp 2015; 31: 657-674.
- Hamid AJ, Ibrahim Rabha W. Fractional alexander polynomials for image denoising. Sig Proc 2015; 107: 340-354.
- Qiang G, Caiming Z, Yunfeng Z, Hui L. An efficient SVD-based method for image denoising. IEEE Trans Circuits Sys Video Technol 2016; 26: 868-880.
- Liu Y. Image denoising method based on threshold wavelet transform and genetic algorithm. Int J Sig Proc Image Proc Patt Recogn 2015; 8: 29-40.
- Jyotsna P, Sunita J. A comparative study of image denoising techniques. Int J Innov Res Sci Eng Technol 2013; 2.
- Huang L. Improved non-local means algorithm for image denoising. J Comp Commun 2015; 3: 23-29.
- Zhao YQ, Jingxiang Y. Hyperspectral image denoising via sparse representation and low rank constraint. IEEE Trans Geosci Remote Sens 2015; 53: 296-308.
- Wei H, Hongyan Z, Liangpei Z, Huanfeng S. Hyperspectral image denoising via noise-adjusted iterative low-rank matrix approximation. IEEE J Select Top Appl Earth Observ Remote Sens 2015; 8: 3050-3061.
- Paras J, Vipin T. LAPB: locally adaptive patch-based wavelet domain edge-preserving image denoising. Info Sci 2015; 294: 164-181.
- Kai Z, Wangmeng Z, Yunjin C, Deyu M, Lei Z. Beyond a Gaussian denoiser: residual learning of deep CNN for image denoising. IEEE Trans Image Proc 2017; 26.
- Achim A, Anastasian B, Panagiotus T. Novel Bayesian multiscale method for speckle removal in medical ultrasound images. IEEE Trans Image Proc 2001; 20.
- Yong Y, Croitoru Mihai M, Akhil B, Joseph BZ, John WC. Nonlinear multiscale wavelet diffusion for speckle suppression and edge enhancement in ultrasound images. IEEE Trans Med Imag 2006; 25.
- Sumit K, Rabindra Kumar S. Study of various image noises and their behavior. Int J Comp Sci Eng 2015; 3: 13-17.
- Artery Databases| SP Lab available online at http: //splab.cz/en/research/zpracovani-medicinskych-signalu/databaze/artery.
- Mantosh B, Hari O. A new adaptive image denoising method based on neighboring coefficients. J Inst Eng (India) 2016; 97: 11-19.
- Zhizhen Z, Yoel S, Amit S. Fast steerable principal component analysis. IEEE Trans Comp Imag 2016; 2: 1-12.
- Qian L, Houqiang L, Zhenbo L, Qingbo L, Weiping L. Denoising of hyperspectral images employing two-phase matrix decomposition. IEEE J Select Top Appl Earth Observ Remote Sens 2014; 7: 3742-3754.
