ISSN: 0970-938X (Print) | 0976-1683 (Electronic)
Biomedical Research
An International Journal of Medical Sciences
Research Article - Biomedical Research (2018) Computational Life Sciences and Smarter Technological Advancement: Edition: II
Robust CDR calculation for glaucoma identification
Manju K* and Sabeenian RS
Department of Electronics and Communication Engineering, Sona College of Technology, Tamil Nadu, India
- *Corresponding Author:
- Manju K
Department of Electronics and Communication Engineering
Sona College of Technology, India
Accepted date: July 03, 2017
DOI: 10.4066/biomedicalresearch.29-17-1492
Visit for more related articles at Biomedical ResearchThe two major eye diseases that affect human eye is Glaucoma and Diabetic retinopathy. Both these diseases cause permanent eye damage and about 50% of vision loss before identification. Till date early detection of these vision loss causing diseases is challenging. These diseases can be identified only after it has damaged more than 25% of the eye. Glaucoma is caused due to increase in the intraocular pressure that damages the retinal. The inner side of the retina is viewed through a camera called the Fundus Imager. This imager is capable of recording the view of retina with respect to the patient. This procedure makes us capable to identify the damages caused by these diseases in early stages. Detecting the optic disc and cup from a fundus image and calculating the CDR value is a method used to identify glaucoma in its early stages. In this paper we have proposed an automatic process to locate the optic disc and the optic cup from the retinal image. The optic disc is located at the centre of the eyes nervous system. This is the brightest region of the fundus image. The cup which is the inner part of the optic disc is obtained by further segmenting the fundus image. For better results different color planes of the same fundus image is been used. The optic cup to disc ratio is an important factor used to identify glaucoma. Glaucoma patients have a high CDR value. This is mainly due to the increase in the cup diameter. This can also be related to the thinning of the nerve rim.
Keywords
Glaucoma, CDR, Optic disc, Optic cup
Introduction
Glaucoma is an eye disease caused by elevated intra-ocular pressure. This elevated pressure is the major cause for the damage of optic nerve. This causes enlargement (or) deepening of optic cup and further leading to loss of vision. We extract the optic disc and optic cup from the retinal images by pixel based segmentation. There are three standard methods to detect glaucoma, among which the first is finding out the increased intraocular pressure (IOP), the second is assessing the abnormal visual field in vision and the third important one is the assessment of damage of optic nerve head.
Ganglion cell axons are the cells that carry the visual data received by the photo-receptors to the brain. These cells exist where the optic nerve head or the optic disc (in short, disc) is located. Color fundus imaging (CFI) is another method used for glaucoma identification that renders support in identifying the optic disc and cup. The disc and cup are segmented from these images and the CDR is computed for glaucoma screening. Depending on the CDR value, they are classified as primary or secondary glaucoma. Glaucoma is further classified into two types namely Open Angle & Closed Angle.
In India glaucoma is consistently ranked as third, among the leading causes of blindness, and is also a serious illness. In a survey conducted by the Glaucoma Society of India 12 million people are affected by glaucoma which leads to 12.8% of the countries blindness. In the study, people from rural area are being identified as newly-discovered cases of glaucoma. There are number of latent cases of the disease in the country that have not yet been identified and treated. Damage caused by glaucoma, that is the optic nerve damage and visual field are progressive and irreversible. In glaucoma, damage caused to the patient gradually proceeds unnoticed by. Arresting or controlling the progress of vision loss can be done only by early detection and treatment of glaucoma. In recent days, there has been lot of developments in the diagnosis and treatment of glaucoma.
Glaucoma caused by the increase or decrease in the fluid pressure in not related to age. The pressure value has to be maintained just below 21 mm of Hg for normal eye. When this pressure value increases, it creates damage to the optic nerve. Further leading to permanent vision loss, this can also lead to blindness if untreated or unidentified. Glaucoma is not age related as already mentioned, it can affect humans of any age. Glaucoma patients have not been identified until it has caused some serious, unrecovered damaged to the optic nerve. Glaucoma is also hereditary.
Glaucoma is broadly classified as:
1. Primary open-angle glaucoma (broad definition)
• Primary open-angle glaucoma
• Normal-tension glaucoma, normal-pressure glaucoma
2. Primary angle-closure glaucoma
• Primary angle-closure glaucoma
• Plateau iris glaucoma
3. Mixed glaucoma
Secondary glaucoma
1. Secondary open-angle glaucoma
2. Secondary angle-closure glaucoma
The most commonly known forms of glaucoma are Primary open-angle glaucoma, Normal tension glaucoma, Angleclosure glaucoma, Acute glaucoma, Pigmentary glaucoma, Exfoliation syndrome, Trauma-related glaucoma.
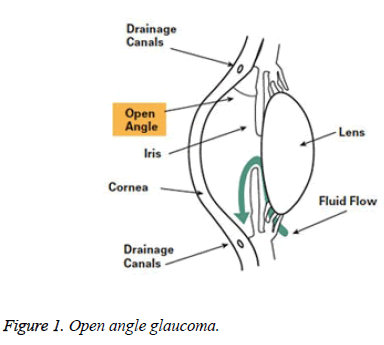
Open-angle glaucoma: 90% of all glaucoma cases are Openangle glaucoma. This is caused by the slow blocking of drainage canals, there by resulting in increase of eye pressure. It makes a wide and open angle between the iris and cornea. It develops slowly all through the life. Its symptoms and damages are not noticed mostly (Figure 1).
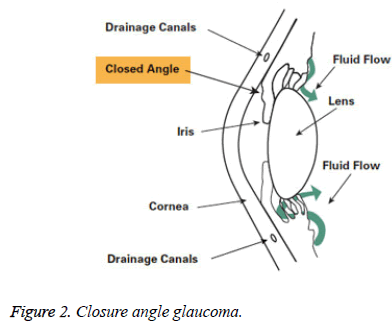
Angle-closure glaucoma: Among the different types of glaucoma angle-closure glaucoma is one. It is also called as acute glaucoma or narrow-angle glaucoma. This type is caused by the clogging of drainage canals which is one of the rare kinds. This damages the canal causing an evident increase in intraocular pressure. It makes a closed or narrow angle between the iris and cornea. The progress of this type of glaucoma is very fast and the damage caused by it is also more. The disease is identified only after 50% of vision loss (Figure 2).
An eye injury can also be a cause of Secondary Glaucoma. The other cause of this type of glaucoma is inflammation and tumour. Sometimes secondary glaucoma can occur in advanced cases of cataract or diabetes. Usage of certain drugs such as steroids can also cause glaucoma. This type can be further classified as mild or severe. When the pigment granules present in the backside of the iris (the colored part of the eye) break into the clear fluid that are produced inside the eye, pigmentary glaucoma occurs. It is a form of secondary openangle glaucoma. As these tiny pigment granules flow toward the drainage canals the eyes slowly clog, causing the eye pressure to rise and thereby lead to glaucoma.
Normal-tension glaucoma (NTG) is also called low-tension or normal-pressure glaucoma. This type of glaucoma is caused by the optic nerve damages, even though the intraocular pressure (IOP) is not very high. The cause of this state is still unknown. A family having history of normal-tension glaucoma, and systemic heart disease has more possibility to get glaucoma. Glaucoma has no age bounds. It can affect human in any age. The first step of identification of glaucoma using fundus image is pre-processing. The pre-processing steps may be, average filtering, contrast adjustment or thresholding. Normally the green component of the image is used after pre-processing step. Then by using morphological operations and edge detection techniques, the optic disc is segmented.
Existing Methods
In the existing methods, the glaucoma analysis of the eye is mainly focused on the retina. Glaucoma affects the transsynaptic nature of the fibre leading to degeneration. Thus, we have ignored a significant part of the visual system. The advances in neuroimaging, especially Diffusion Tensor Imaging (DTI), enable the identification and characterization of white matter fibres.
Features are extracted from the specific region of the DTI image. These features are grouped into three sets: Histogram, Co-Occurrence matrices, and Laws features. In another method, they use retina tomography images, and the image is processed using the Markov random field, change detection, Bayesian estimation. This estimation aims at the extracting features of smoothing the boundaries and preserving the discontinuities in the image. Lee You Tai Danny project about glaucoma, he used the principal component analysis (PCA). In his project the texture features are extracted using image processing and then processed by statistical analysis of PCA. Then the classification of glaucoma type is done using the probabilistic neural network (PNN). In the existing methods, they use the tomographic image of eye which is a process that takes long time. Due to this kind of processing, image takes more time than usual time for analysis. In another method, they use the principal component analysis (PCA), that analyse the image in different ways, if image is clear then only process can be done. It gathers static information about the process which also takes more time for processing. In Matlab programming, processing of eye using different methods should be done separately. Hence conversion of basic image to next level is high. Therefore, it is not an automated detection method.
Proposed Method
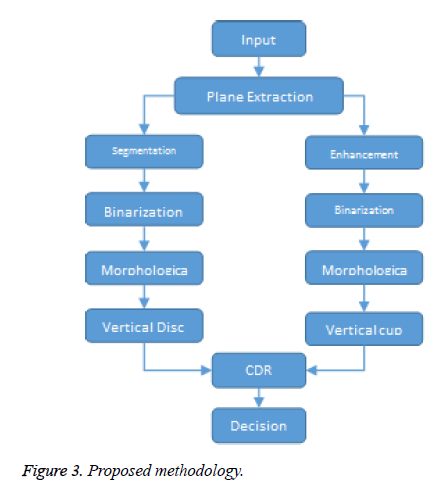
Glaucoma is not an age related issue. It can affect people of any age. Even children can be affected by glaucoma. An early detection of glaucoma can help young children from losing their eye sight. During a dilated eye examination, a strong suggestion of damage in the optic nerve can be clearly seen. While diagnosing glaucoma these kind of optic nerve damage are also required to be found. Our aim is mainly to produce the algorithm and to reduce the process time of detection of glaucoma. This work as shown in Figure 3 detects the presence of glaucoma by using the color fundus image through the computer screening. In this method the input image of a person is captured by fundus camera. The captured image is subjected to various pre-processing steps like gray level transformation, median filtering, and mathematical morphology. Image processing capabilities of Matlab are used extensively to accurately detect presence of Glaucoma in the eye. In existing method, the optic cup and optic disc are segmented by creating mask manually and glaucoma is detected. The focus of this work is to detect Glaucoma with exact CDR value to clinical examination results and reduce the processing time.
Image acquisition
Image acquisition is the foremost task of any image processing algorithm. The color fundus image used in the identification process is obtained by a fundus imager. This marks the first step of any processing. The particular goal in this step is to construct the image of the eye taken in a constrained and guided environment so as to make it readable to obtain the required information.
Unless the image acquired is perfect, it becomes very difficult to analyse the image and come to a conclusion about the eye defect. Real time image acquisition is one method used to take images automatically by the device, process and file it for future analysis. Back ground image acquisition is another one common type of real time image acquisition. Digital imaging also helps in this process. It also supports in transmission of the data from one place to another.
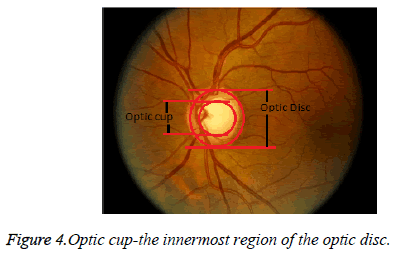
Digital image processing is eco-friendly, because there is no chemical involved in the process of image acquisition. Digital images are used to help in documentation and in maintaining record of historical, scientific and personal life events. The fundus image is obtained from a fundus imager, which captures the inner view of the eye. The fundus image has a bright centre region which is known as the nerve centre. This is the place where the nerves head forms. This is also called as the optic disc. The innermost region of the optic disc is the optic cup as shown in Figure 4.
Image pre-processing
Lowest level of abstraction is pre-processing. Preprocessing is the first step of any kind of image processing algorithms. The raw image obtained from an imager may consist of any number of artifacts. Removing them and making the image analyzable is done in this stage. The input and output images processed in Matlab are looked as intensity values. The aim of preprocessing is to improve the quality of image. The preprocessing step can be enhancement, removal of noise, removal of blur, intensity adjustment, histogram equalization and so on.
Image normalization operator can also be used as such image pre-processing step. Image normalization significantly increases the dynamic range of the histogram of the image. Image averaging can increase the brightness value in the output (O/P) image by replacing the corresponding pixel value with the average value of a small neighbourhood of pixels in an input (I/p). The intensity value in an input image is uniformly distributed throughout the image. Thus, for better visualization the contrast of the image is increased. Retinal images are darker as compared to a healthy RNFL retina. Hence we have highlighted the blue channel component in the image for computation of cup diameter. Image pre-processing methods make use of the redundancy in images. Neighbouring pixels corresponding to one object in real images have the same or similar brightness value. This paper uses this as the key point for further segmentation of optic disc and cup. Thus, an average value of neighbouring pixels will help in restoring distorted pixel.
Optic disk detection
One of the important basic steps in all automated diagnosis done by the ophthalmic pathologies is the OD segmentation. Glaucoma is identified when there is a change in the anatomical structure, color or the depth of optic disc. Thus by analysing the segmented optic disc it becomes easy to identify the adversity of glaucoma. The optic disc is considered to be elliptical in shape. Its size can also vary significantly. In the fundus images the center bright region which is yellowish in color is the optic disc. There are other factors that also affect the identification of the disc boundaries other than the variations in OD shape, size and color.
Optic disc in the retina is marked as the bright circular area. That area could also be detected by using curve operator method [1-4]. In which the author exploits the property that the optic disc being the bright region is not bright throughout. It fades moving inside. The brightness has color that is gradient from edge to the centre of the image. It is also mentioned that an 8 orientation of curve is been used for the segmentation of the optic disc. Welfer et al. [2] used the green channel of the fundus image and vascular tree to segment the disc. Sedai et al. [5] used both red and green plane information to identify and segment the optic disc. The author uses a non-overlapping sliding window in the red plane and a binary vessel mask from the green plane to locate and then use Otsu’s thresholding method to segment.
Santhakumar et al. [6] used the red channel, splits the vertical and horizontal bin, calculate the maximum intensity value of each bin set a threshold value from that and then segment the optic disc. Amruthavarshini et al. [7] has used extracted features and migraph classifier to segment the optic disc. Santhakumar et al. [8] has created a perfect mask for segmenting the foreground in the fundus image. The author has used logarithmic transformation along with Otsu’s thresholding to segment and further used morphological operation to close. Gabour and matched filters are used for enhancing the low quality fundus image for better vessel segmentation. Lu et al. [9] uses three methods namely radial symmetry transform, Hough transform and histogram method based on template for optic disc localization. Different studies used region based segmentation followed by intensity adjustment to localize the optic disc from a low illuminated fundus image [10-12]. Yin et al. [13] talks about an automatic retinal interest evaluation system where the quality of the image is analysed.
We have used brightness information of the image to morphologically identify the disc then classify the pixel to achieve accurate segmentation. In the proposed method the region of interest (ROI) can be obtained using the brightness of the image. The red channel gives a better illumination content of the disc. Segmenting the image keeping the brightness as a threshold becomes easy to obtain the optic disc of the fundus image. Then we have used a morphological operation to close [14,15].
Optic cup segmentation
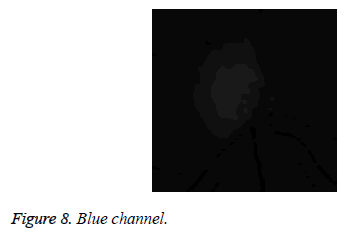
The most difficult part of cup segmentation is to find the cup boundary. Finding out the cup boundary without having any prominent edge and corresponding intensity changes is challenging. Even though knowing the vessel bends won’t help us in identifying the cup region appropriately. The pallor information can also be used along with the vessel bends to detect the cup region. In the proposed method we use the blue plane information for segmentation of OC.
Binarization of the blue plane data is done to localize the cup. Once the binarization is over the morphological operation is doneto close it to obtain the vertical diameter of the cup. Agarwal et al. [16] used the green channel, for which they have calculated the SD and mean. This has helped in thresholding, and further leading to the cup segmentation. In this paper the author has also obtained a rim to disc ratio which supports the finding of glaucoma. Agarwal et al. [17] have improved the analysis by adding a histogram analysis before thresholding the cup and disc.
Alghmdi et al. [18] uses super pixel clustering algorithm for segmenting the optic cup and disc. Dutta et al. [19] have calculated a threshold value after obtaining which the histogram of the grey scale image is found. This threshold is used on the red channel image to segment OD. For optic cup which is the brighter part of the optic disc is segmented in the same procedure but the green channel is used for it. Irene has used a random forest classifier for segmenting optic cup and disc [20]. Chih-Yin Ho uses vessel detection and vessel impainting to detect the CDR [21]. Ashish has used histogram smoothing and thresholding on green and red channel there by obtaining the optic cup and disc [22]. The threshold is fixed from the mean and standard deviation of the smoothed image. Different studies have used hybrid level set and morphological operation for optic disc segmentation and blood vessel detection followed with SVM classifiers for OC segmentation [23-30].
CDR calculation
In ophthalmology, retinal imaging and its processing plays a very important role in detecting diseases like glaucoma and diabetic retinopathy. These are abnormalities formed in the eye or ocular region. Glaucoma being the main cause of blindness all around the world is accounted as 13% of the population [24]. This is caused by the damage of the optic nerve cells. These patients contribute to the whole account of visually challenged people. The visual damage may also be due to changes in the optic nerve head. Glaucoma identification is made easy by calculating the optic disc and cup ratio. This neuro retinal CDR value is deciding factor of glaucoma. As this value increases, the severity of the disease increases.
At present this calculation has been done manually by experienced ophthalmologist. This is because the blood vessel that surrounds the optic disc makes it very difficult to be segmented, Thus making it very difficult to obtain the cup to disc ratio. The process does not stop with the cup disc segmentation various other features can also be obtained from the retinal images. In this we concentrate on the vertical cup to disc ratio only. As emphasised this ratio is a very important index in identification of glaucoma.
CDR=VCD/VDD
This CDR value helps in glaucoma identification. When CDR is greater than the given threshold, the patients eye is considered to be glaucomatous, and advised for a doctor’s consultation, otherwise healthy.
Glaucoma diagnosis
The basis test done to identify glaucoma by Optometrists, orthoptists, and ophthalmologists is usually by checking the intraocular pressure and making a fundus image analysis. Tonometry examination measures the eye pressure. The second cause of glaucoma is optic nerve damages. Thus the doctors also examine the optic nerve for glaucoma damage. Perimetry test is used to map the complete visual field. Gonioscopy test finds out the angle made by the iris and cornea. This helps in identifying whether the patient is suffering from open angle or closed angle glaucoma. Pachymetry test is used to find the thickness of cornea. Among all these the fundus image analysis, in which we calculate the CDR value is easy and fast way to identify glaucoma [31-34].
Results and Discussion
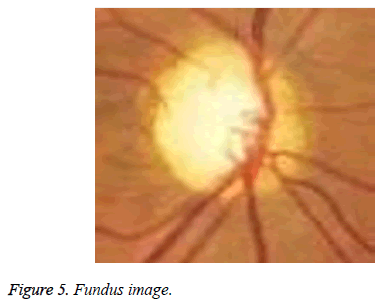
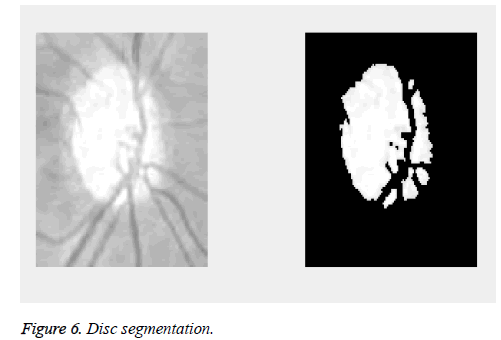
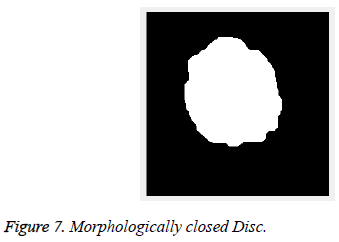
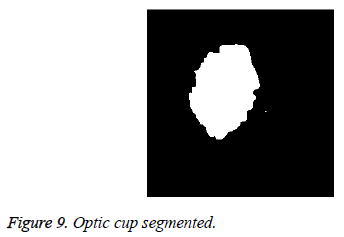
The proposed method is tested on images from DRIONS-DB [35,36]. Colour analogical fundus camera is used for acquiring the fundus image. The images are taken by centring at the optic nerve head. They are further stored in a slide format.HPPhotoSmart- S20 high resolution scanner is used to convert it to a 600x400 resolution RGB format digital image. Each pixel is represented using 8 bits. The database fundus images are used for the calculation of the cup to disc ratio. Figure 5 shows the fundus image of an eye. The image has a bright centre region. From the image it is evident that the cup is elongated in diameter and thereby reducing the retinal neural rim. The thinning of the retinal neural rim is also a damage caused by the glaucoma. Figure 6 shows the binarization output of the grey converted fundus image. After the segmentation process, morphological operations are used to close and obtain the disc, cup diameter. This is exhibited in the Figures 7-9. The optical cup and disc diameter which is obtained is the vertical diameter of the optic cup and disc. This value is used to find CDR value. The CDR value has to be less than 0.6 for a normal fundus image. If this value is found to be more than 0.6 the fundus image is considered to have been affected by glaucoma. The performance analysis of the proposed method is validated by the ground truth obtained from ophthalmologist. The true positive (TP) is the patient with glaucoma being identified as glaucomatous. True negative (TN) is a normal eye labelled as normal. False positive (FP) is normal eye being identified as glaucomatous and true negative (TN) is glaucoma eye identified as normal eye.
Sensitivity = [TP/(TP+FN)]*100 → (1)
Specificity = [TN/(TN+FP)]*100 → (2)
Accuracy = [(TP+TN)/(TN+FP+FN+TN)]*100 → (3)
Precision=TP/(TP+FP) → (4)
Recall = TP/(TP+FN) → (5)
F Score = 2 × [(Precision*Recall)/(Precision+Recall)] → (6)
The accuracy obtained in the proposed method is 73%. This is because it is very difficult to obtain the cup boundary. The cup boundary which is defined by the bending of optic nerve is very difficult to be detected. It has no evident boundary as the disc. Keeping the brightness information it is very difficult to identify the cup edges. With the calculation of the CDR value the patient is supposed to have glaucoma if his IOP is also high. The sensitivity obtain in this method is 71.4% and specificity is 75%. Thus with only the brightness value it’s difficult to identify the cup boundary which affects the CDR calculation [37-44].
Conclusion
The results obtained from the brightness based optic disc and cup segmentation is found to be less accurate then methods like Contrast Enhanced Histograms, K- Means clustering, SLIC and Gabor wavelet transformation. All these methods can be used on fundus image as the source of input for identification. These results can be further enhanced by calculating the rim to disc ratio. This value can be an added as a clarification for the accurate identification.
Future Scope
The Detection of glaucoma is based on only the optic cup to disc ratio measurement. In future, the other parameters such as neuro retinal rim width, neuro retinal area, horizontal cup-disc ratio, rim to disc ratio can also be calculated to indicate the progressive enlargement of the cup. The depth of progression of glaucoma can be calculated by using 3D reconstruction.
References
- Cheng J, Liu J, Wong DWK, Yin F, Cheung C, Baskaran M, Aung T, Wong TY. Automatic optic disc segmentation with peripapillary atrophy elimination. Int Conf IEEE Eng Med Biol Soc 2011.
- Welfer D, Scharcanski J, Kitamura CM, Pizzol MMD, Ludwig LEB, Marinho DR. Segmentation of the optic disk in color eyefundus images using an adaptive morphological approach. Computer Biol Med 2010; 40: 124-137.
- Soltani A, Battikh T, Jabri I, Mlouhi Y, Lakhoua MN. Study of contour detection methods as applied onoptic nerve’s images for glaucoma diagnosis. 2016 International Conference on Control, Decision and Information Technologies (CoDIT), St. Julian's, 2016.
- Nahid Reza M, Ahmad M. Automatic detection of optic disc in fundus images by curve operator. Proceed Int Confer Elect Informat Commun Technol 2015.
- Sedai S, Roy PK, Mahapatra D, Garnavi R. Segmentation of optic disc and optic cup in retinal fundus images using shape regression. 38th Annual International Conference of the IEEE Engineering in Medicine and Biology Society (EMBC), Orlando, FL, 2016.
- Santhakumar R, Rajkumar ER, Tandur M, Geetha KS, Rajamani KT, Haritz G. A fast algorithm for optic disc segmentation in fundus images. International Conference on Advances in Computing, Communications and Informatics (ICACCI), Jaipur, India, 2016.
- Amruthavarshini A, Venkatesan K, Geetha KS, Singh D, Rajamani KT. Multiple instance learning for the determination of appropriate images for fundus image algorithms. International Conference on Advances in Computing, Communications and Informatics (ICACCI), Jaipur, India, 2016.
- Santhakumar RI, Rajkumar ER, Tandur IM, Geetha KS, Rajamani KT, Haritz G. Novel method for automatic generation of fundus mask. 3rd International Conference on Image Information Processing, Waknaghat, India, 2015.
- Cheng-Yu L, Bing-Zhong J, Chan PPK, Xiang D, Xie W, Wang J, Yeun DS. Vessel enhancement of low quality fundus image using mathematical morphology and combination of gabor and matched filter. Proceedings of the 2016 International Conference on Wavelet Analysis and Pattern Recognition, South Korea, 2016.
- Lesay B, Pavloviová J, Oravec M, Kurilová V. Optic disc localization in fundus images. International Conference on Systems, Signals and Image Processing (IWSSIP), Bratislava, 2016.
- Sengar N, Dutta MK, Parthasarathi M, Roychowdhury S, Burget R. Fast localization of the optic disc in fundus images using region-based segmentation. 3rd International Conference on Signal Processing and Integrated Networks (SPIN), Noida, 2016.
- Abràmoff MD, Garvin MK, Sonka M. Retinal imaging and image analysis. IEEE Rev Biomed Eng 2010.
- Yin F, Wong DWK, Yow AP, Lee BH, Quan Y, Zhang Z, Gopalakrishnan K, Li R, Liu J. Automatic retinal interest evaluation system (ARIES). Conf Proc IEEE Eng Med Biol Soc 2014; 2014: 162-165.
- Roychowdhury S, Koozekanani DD, Kuchinka SN, Parhi KK. Optic disc boundary and vessel origin segmentation of fundus images. IEEE J Biomed Health Informat 2016; 20: 1562-1574.
- Maheshwari S, Pachori RB, Acharya UR, Maheshwari S, Pachori RB, Acharya UR. Automated diagnosis of glaucoma using empirical wavelet transform and correntropy features extracted from fundus images. IEEE J Biomed Health Inform. 2016; 21: 803-813.
- Agarwal A, Gulia S, Chaudhary S, Dutta MK, Travieso CM, Alonso-Hernández JB. A novel approach to detect glaucoma in retinal fundus images using cup-disk and rim-disk ratio. 4th International Work Conference on Bioinspired Intelligence (IWOBI), San Sebastian, 2015.
- Agarwal A, Gulia S, Chaudhary S, Dutta MK, Burget R, Riha K. Automatic glaucoma detection using adaptive threshold based technique in fundus image. 38th International Conference on Telecommunications and Signal Processing (TSP), Prague, 2015.
- Alghmdi H, Tang HL, Hansen M, O'Shea A, Al turk L, Peto T. Measurement of optical cup-to-disc ratio in fundus images for glaucoma screening. International Workshop on Computational Intelligence for Multimedia Understanding (IWCIM), Prague, 2015.
- Dutta MK, Mourya AK, Singh A, Parthasarathi M, Burget R, Riha K. Glaucoma detection by segmenting the super pixels from fundus colour retinal images. International Conference on Medical Imaging, m-Health and Emerging Communication Systems (MedCom), Greater Noida, 2014.
- Fondón I, Valverde JF, Sarmiento A, Abbas Q, Jiménez S, Alemany P. Automatic optic cup segmentation algorithm for retinal fundus images based on random forest classifier. IEEE EUROCON 2015 - International Conference on Computer as a Tool (EUROCON), Salamanca, 2015.
- Ho CC, Pai TW, Chang HT, Chen HY. An atomatic fundus image analysis system for clinical diagnosis of glaucoma. 2011 International Conference on Complex, Intelligent, and Software Intensive Systems, Seoul, 2011.
- Ashish I, Parthasarthi M, Dutta MK. An adaptive threshold based algorithm for optic disc and cup segmentation in fundus images. 2nd International Conference on Signal Processing and Integrated Networks (SPIN), Noida, 2015.
- Jose AM, Balakrishnan AA. A novel method for glaucoma detection usingoptic disc and cup segmentation in digital retinal fundus images. International Conference on Circuit, Power and Computing Technologies [ICCPCT], Nagercoil, India, 2015.
- Dey N, Roy AB, Das A, Chaudhuri SS. Optical cup to disc ratio measurement for glaucoma diagnosis using harris corner. Third International Conference on Computing Communication and Networking Technologies (ICCCNT 12), Coimbatore, 2012.
- Gowsalya P, Vasanthi S. Segmentation and classification of features in retinal images. International Conference on Communication and Signal Processing, Melmaruvathur, 2014.
- Devi SS, Amitha T. Offline handwritten writer independent Tamil character recognition. International Conference on Information Communication and Embedded Systems (ICICES2014), Chennai, India, 2014.
- Antony S, Julian S, Ravi S. Development of efficient image quarrying technique for mammographic image classification to detect breast cancer with supervised learning algorithm. International Conference on Advanced Computing and Communication Systems, Coimbatore, India, 2013.
- Aquino A, GegúndezArias ME, Marıń D. Detecting the optic disc boundary in digital fundus images using morphological, edge detection, and feature extraction techniques. IEEE Transact Med Imaging 2010; 29: 1860-1869.
- Issac A, Sarathi MP, Dutta MK. An adaptive threshold based image processing technique for improved glaucoma detection and classification. Comput Methods Programs Biomed 2015; 122: 229-244.
- Karkuzhali S, Manimegalai D. Computational intelligence-based decision support system for glaucoma detection. Biomed Res India 2017; 28: 4737-4748.
- Jayanthi G, Sagayee GMA. Detection of optic disc boundary based on LDA and medial axis detection. IEEE International Conference on Computational Intelligence and Computing Research, Enathi, India, 2013.
- Thulasi N, Sikamani KT. Thresholding approaches for extracting optic disc in digital fundus image. International Conference on Current Trends in Engineering and Technology (ICCTET), Coimbatore, India, 2013.
- Joshi GD, Sivaswamy J, Krishnadas SR. Optic disk and cup segmentation from monocular color retinal images for glaucoma assessment. IEEE Trans Med Imaging 2011; 30: 1192-1205.
- Singh A, Dutta MK, ParthaSarathi M, Uher V, Burget R. Image processing based automatic diagnosis of glaucoma using wavelet features of segmented optic disc from fundus image. Comput Methods Programs Biomed 2016; 124: 108-120.
- Sivaswamy J, Krishnadas SR, Chakravarty A, Joshi GD, Syed TA. A comprehensive retinal image dataset for the assessment of glaucoma from the optic nerve head analysis. JSM Biomed Imaging Data Papers 2015; 2: 1004.
- Sivaswamy J, Krishnadas SR, Joshi GD, Jain M, Syed-Tabish AU. Drishti-GS: Retinal image dataset for optic nerve head(ONH) segmentation.2014 IEEE 11th International Symposium on Biomedical Imaging (ISBI), Beijing, 2014.
- www.glaucoma.org
- www.irjet.net
- www.ijarcst.com
- www.ryokunaisho.jp
- www.ijcat.org
- www.ijret.org
- www.eugs.org
- www.arizona.pure.elsevier.com
