ISSN: 0970-938X (Print) | 0976-1683 (Electronic)
Biomedical Research
An International Journal of Medical Sciences
Research Article - Biomedical Research (2017) Volume 28, Issue 17
Real-time ultrasound elastography evaluation of the thyroid gland in adolescent patients with hashimoto thyroiditis
1Department of Radiology, Antalya Training and Research Hospital, Antalya, Turkey
2Department of Paediatric Endocrinology, Antalya Training and Research Hospital, Antalya, Turkey
- *Corresponding Author:
- Bülent Çekiç
Department of Radiology
Antalya Training and Research Hospital, Antalya, Turkey
Accepted date: August 11, 2017
Aim: The aim of this study is to evaluate and compare the values of strain index ratio as measured by real-time ultrasound elastography in healthy subjects and in adolescent patients with Hashimoto Thyroiditis (HT). Our aim is also to determine cut-off value of strain index ratio, obtain reference values and evaluate if we can use this values in diagnosis and follow-up.
Material and Methods: A total of 76 patients with HT and 46 healthy controls were included in the study group, prospectively examined by strain sonoelastography. The strain index ratio was defined as the ratio of thyroid gland strain value divided by the strap muscle strain value. Hi-Vision Preirus ultrasound device (Hitachi Tokyo, Japan) with 7-13 MHz linear-array broadband probe was used.
Results: The mean strain index ratio was higher in HT patients, 1.2 ± 0.2, than in the control group, 0.77 ± 0.18 (p<0.01). There was a positive correlation between anti-thyroid peroxidase (anti-TPO) and strain index ratio (r=0.439, p<0.01). However, there was no correlation between Anti-Thyroglobulin (ATG) and strain index ratio. The area under the Receiver Operating Characteristics (ROC) curve for HT was 0.929, and the optimal cut-off value for elastography (strain index ratio) in HT prediction was >0.98 (83% sensitivity, 93% specificity, +LR: 13, - LR: 0.18).
Conclusion: Strain index ratio index measured by real time strain elastography was significantly higher in HT than in normal thyroid parenchyma. Strain elastography methods can be used to evaluate the degree of fibrosis in patients with HT. Therefore these values can be used as an adjunct to conventional B-mode ultrasonography in the diagnosis of Hashimoto thyroiditis in adolescents.
Keywords
Strain elastography, Hashimato thyroiditis (HT), Adolescent.
Introduction
Autoimmune thyroiditis is the most common inflammatory disorder of the thyroid gland. The most common type of autoimmune thyroiditis is Hashimoto Thyroiditis (HT), which is the leading cause of hypothyroidism [1]. Autoimmune thyroiditis constitutes 55-65% of euthyroid paediatric patients and girls are far more often affected than boys [2]. The condition is clinically diagnosed by detecting increased serum level of thyroid autoantibodies (anti-thyroid peroxidase (anti- TPO), anti-thyroglobulin (ATG)) and low levels of free triiodothyronine (T3) and free thyroxine (T4) and elevated levels of thyrotropin (TSH) in cases with hypothyroidism. Sonographic diagnosis is made based on the hypoechogenicity and heterogenicity of the thyroid gland [3]. Occasionally, thyroid lymphoma may develop in the setting of thyroiditis by the time [4]. Thyroidal parenchymal stiffness takes place in patients with HT due to the lymphocytic infiltration, fibrosis and follicular destruction in the thyroid gland during the disease process [5,6].
B-mode ultrasound parameters that are used for the diagnosis and follow-up of HT are thyroid volume and echogenicity alterations but their obstacles are being quantitative and subjective [7]. Nevertheless, real time strain US elastography gives more objective and quantitative information about the increase in stiffness due to fibrosis of the thyroid parenchyma resulting from HT [8].
Real time strain US elastography is an adjunctive technique which provides an estimation of the tissue stiffness by measuring the degree of tissue displacement by exerting an external pressure [9]. In strain elastography, the ultrasonographic echoes are analyzed before and after compression of the tissues. The difference between the two signals refers to the strain value [9]. Lymphocytic infiltration and fibrosis occurring in the thyroid gland of HT increase the stiffness of the thyroid tissue [10].
There are studies in adult literature conducted on thyroid parenchymal stiffness changes using various ultrasound elastography techniques. Menzilcioğlu et al. reported that in adults the median strain index ratio values (Thyroid parenchyma/strap muscle stiffness) were higher in the Chronic Autoimmune Thyroiditis (CAT) group compared to the healthy control group [11]. Hekimoğlu et al. found 77% sensitivity and 71% specificity values for the diagnosis of chronic autoimmnue thryoditis in adult patients using Shear-Wave Elastography (SWE) [12]. In a study conducted by Sporea et al. the thyroid gland stiffness assessed by Acoustic Radiation Force Impulse Imaging (ARFI) in healthy subjects was significantly lower than in those with Graves’ disease and CAT patients [13].
To the best of our knowledge, there is no report in the literature about the utility of real-time ultrasound elastography for HT in adolescent patients. The purpose of this study was to detect the alterations in the stiffness of the thyroid tissue quantitatively using Real time strain elastography in adolescent patients with HT, determine a cut-off point by using strain elastography procedure for HT diagnosis and obtain reference values for follow-up adolescent patients with HT.
Materials and Methods
Study design
All procedures followed were in accordance with the ethical standards of the responsible committee on human experimentation (institutional and national) and with the Helsinki Declaration of 1975, as revised in 2008. Informed consent was obtained from all patients for being included in the study.
A total of 79 cases diagnosed with HT in the Paediatric Endocrinology Department between April 1, 2015 and April 15, 2016 were prospectively recruited for the study. The median value of age was 14.7 y (14-15.5) in the patient group and 15.6 y (15-16), respectively in the control group. The patients were selected by the paediatric endocrinologist per their clinical and laboratory parameters and those who met the criteria for euthyroid autoimmune thyroiditis and who were without medications for at least 6 months were included in the study. Patients with prior surgery or biopsy, parenchymal nodule, calcification or cystic lesion were excluded from the study. Overall 3 of 79 patients were excluded for various reasons (1 with thyroidal nodule, 2 with parenchymal calcification). A control group was formed of 47 adolescents who were referred to the Radiology Department after presentation at the paediatric Endocrinology Department with no evidence of thyroid disease. One of the control subjects was excluded as parenchymal nodule was determined. The Remaining control individuals were proven to be free of the any thyroid disorder by clinical, laboratory or Ultrasound (US) findings. Finally a prospective examination was made of a total of 76 patients with HT and 46 healthy control subjects.
Clinical and laboratory features
The clinical diagnosis of HT was based on increased levels of anti-TPO (normal range: 0-10 IU/mL) and/or anti-TG (normal range: 0-4 IU/mL). Since hyperthyroidism, hypothyroidism and euthyroidism are all different sub-groups the results could have been affected. Therefore, only euthyroid patients were included and this was defined as Thyroid Stimulating Hormone (TSH) and free Thyroxine (fT4) within the normal reference range (TSH: 0.36-5.8 mIU/mL, fT4: 0.61-1.12 ng/dL). Serum assays were performed in the same week with sonographic evaluation. All the blood samples were stored at the room temperature for at least 30 min to allow clotting, followed by centrifugation (2500 rpm) for 15 min at 4°C to separate sera. Hormonal parameters were immediately assayed. Additional serum was isolated from fasting blood samples and stored at -80°C prior to analysis of TSH, fT4, anti-TPO, anti-TG, which were determined using a two-site immune-enzymatic method. Serum TSH, fT4, anti-TPO and anti-TG levels were measured with a two-site immunoenzymatic method using a commercially available kit and an auto-analyzer (Beckman DxI800; Beckman Coulter Diagnostics, CA, USA). The intraand inter-assay Coefficients of Variation (CVs) for these assays were <10%.
Ultrasound imaging
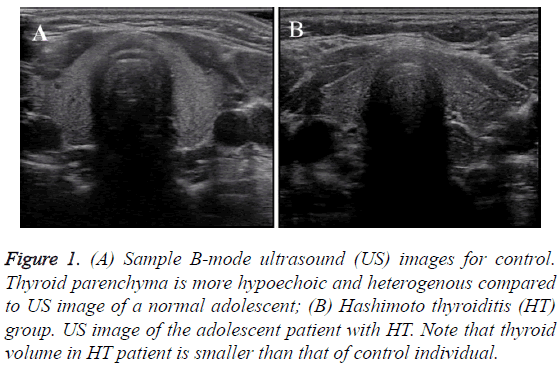
All patients were scanned using a Hitachi Hi-Vision Preirus (Tokyo, Japan) ultrasound device equipped with a 7-13 MHz linear-array broadband probe. Patients were lying supine with the neck overextended. All examinations were performed by the same radiologist (BC). The radiologist was blinded to the diagnosis. The thyroid glands of the patients were evaluated in terms of size, echogenicity and nodules on B-mode ultrasound (Figure 1). Afterwards, strain elastography were performed.
Figure 1: (A) Sample B-mode ultrasound (US) images for control. Thyroid parenchyma is more hypoechoic and heterogenous compared to US image of a normal adolescent; (B) Hashimoto thyroiditis (HT) group. US image of the adolescent patient with HT. Note that thyroid volume in HT patient is smaller than that of control individual.
Real-time elastography
Real-time strain elastography is a semi-quantitative ultrasonographic method assessing the degree of tissue displacement between compression and decompression periods when external pressure is exerted on the body parts by the transducer. Tissues are encoded according to their stiffness level (generally stiffer ones are blue, intermediate ones are green and softer ones are red). Strain Index (SI) is a ratio calculated by dividing target tissue stiffness by the reference tissue stiffness within the same level and measured by drawing a region of interest. In real time sonoelastography, the probe was gently placed on the gel over the target area and, slight, repetitive compression was maintained with free-hand technique during the study. While the images were obtained, the patients held their breath to avoid respiratory motion artefacts.
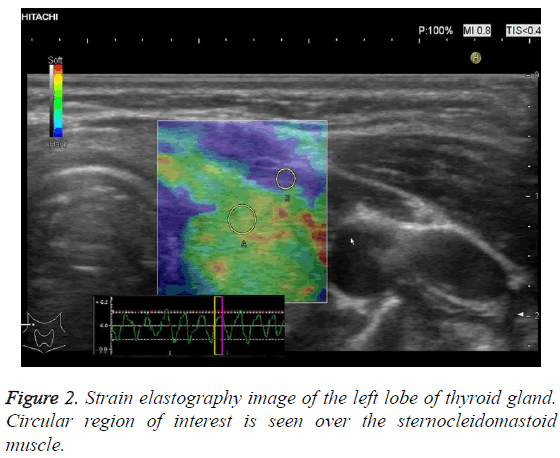
The target area was determined as the section containing the largest thyroid gland, within the same screen as the carotid artery, SCM and trachea. A circular Region of Interest (ROI) with 6 mm in diameter was placed onto the thyroid parenchyma and another ROI with 4 mm in diameter was placed on the SCM muscle to obtain the ratio (Figure 2).
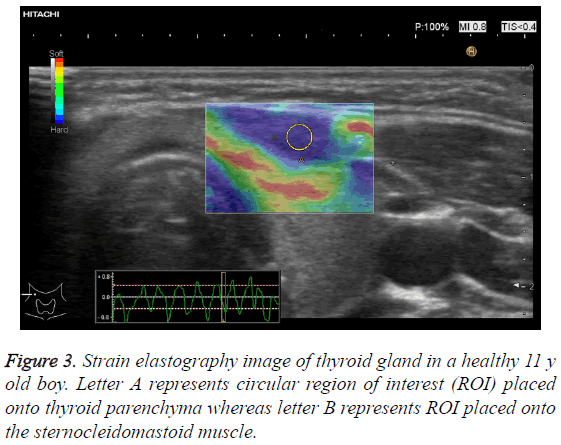
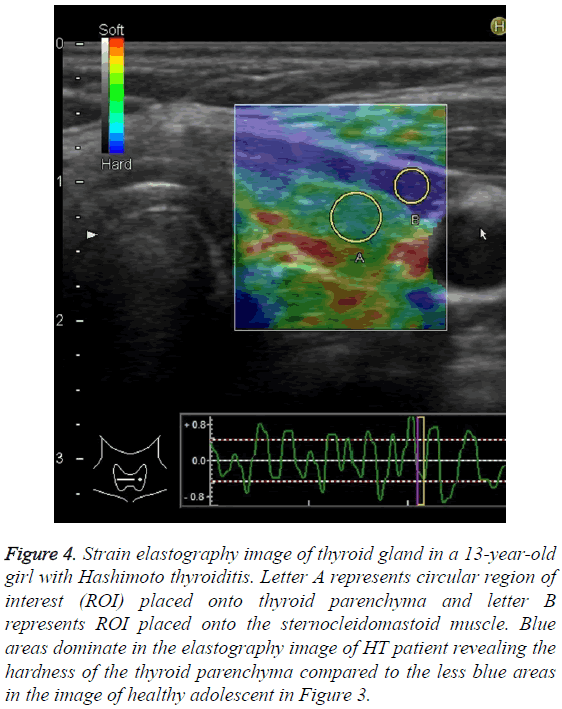
A diagram representing the real time placement of ultrasound probe in the strap muscles of the patient is shown in Figure 3. For each case, 9 to 10 consecutive sinusoidal waves composed of compression and relaxation (regular sign curve) were acquired. The strain index ratio was defined as the ratio of thyroid gland strain value divided by the strap muscle strain value. Measurements were performed from the most accurate decompression phase of the sinusoidal waves and the mean values of these measurements were recorded. There were no space occupying lesions or muscular disorders on the target strap muscles (Figure 4).
Figure 4: Strain elastography image of thyroid gland in a 13-year-old girl with Hashimoto thyroiditis. Letter A represents circular region of interest (ROI) placed onto thyroid parenchyma and letter B represents ROI placed onto the sternocleidomastoid muscle. Blue areas dominate in the elastography image of HT patient revealing the hardness of the thyroid parenchyma compared to the less blue areas in the image of healthy adolescent in Figure 3.
Statistical analysis
Data were analyzed using the Statistical Package for Social Sciences 18 for Windows (SPSS Inc., Chicago, IL, USA). Descriptive statistics included frequency, percentage, mean, median, Standard Deviation (SD), minimum (min), and maximum (max). The Mann-Whitney U test was used to compare differences between two independent groups. Fisher’s exact test was applied to non-parametric data and the Pearson correlation test was used for correlation analysis. A value of p<0.05 was considered to be statistically significant. The Kolmogorov-Smirnov test was used to determine the distribution of the data. If the data followed a normal distribution, values were stated as mean ± SD and the Student t-test was applied to analyze the data.
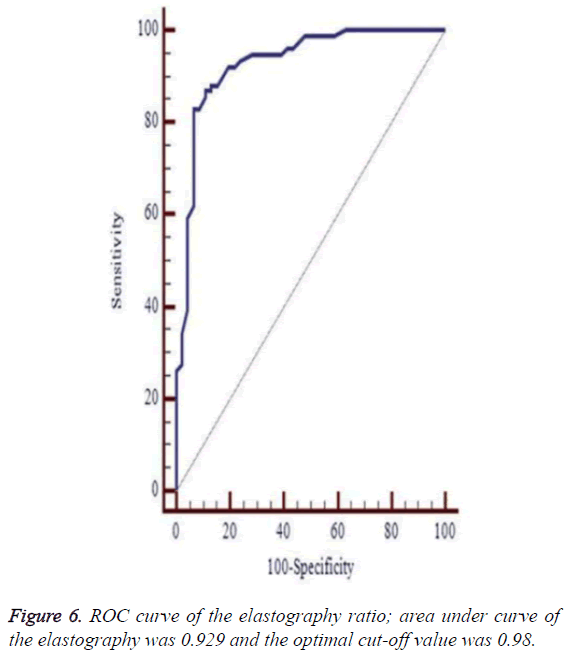
For parameters that followed non-normal distribution, values were stated as median in a 95% confidence interval and were analyzed using the Mann-Whitney-U test. The Spearman test was applied for correlation analysis. To differentiate the HT group and the Control group, different predictive models were compared using Receiver Operating Characteristic-Area under Curve (ROC-AUC) statistics. For different predictive models, Area under Curve (AUC), cut-off points, sensitivity, specificity, Positive Predictive Value (+PV), Negative Predictive Value (-PV), Positive Likelihood Ratio (+LR) and Negative Likelihood Ratio (-LR) values were determined.
Following formulas were used to compute sensitivity and specificity. Sensitivity=true positive/true positive+false negative; specificity=true negative/true negative+false positive. Data were expressed as mean ± SD or median (interquartile range), as appropriate. All differences associated with a chance probability of 0.05 or less were considered statistically significant. The area under curve values near to 1.0 represented perfect test results. Values of <0.5 were equivalent or worse results than expected by random chance. The area under curve values had the following interpretation: 0.9 to 0.99=excellent test, 0.8 to 0.89=good test, 0.7 to 0.79=fair or reasonable test and 0.51 to 0.69 means poor test.
Results
A prospective examination was made of a total of 76 patients, comprising 18 (24%) males and, 58 (76%) females with HT and 46 healthy control subjects comprising 10 (22%) males and, 36 (78%) females. The median values of age, BMI, TSH and FT4 values were 14.7 y (14-15.5), 20.7 (20.3-22.3), 2.4 (1.9-2.7) and 0.80 (0.80-0.81) respectively in the patient group and 15.6 y (15-16), 20.9 (19.4-23), 1.85 (1.6-2.2), and 0.80 (0.78-0.87) respectively in the control group. No significant difference was determined between the two groups in terms of age, gender, BMI, TSH and FT4 (p=0.07, 0.99, 0.76, 0.28, 0.81 respectively) (Table 1).
| Variables | Patient (n=76)* | Control (n=46)* | P value |
|---|---|---|---|
| Age (y) | 14.7 (14-15.5) | 15.6 (15-16) | P=0.07 |
| Gender (female) | 58 (76%) | 36 (78%) | P=0.99 |
| Gender (male) | 18 (24%) | 10 (22%) | P=0.86 |
| BMI kg/m2 | 20.7 (20.3-22.3) | 20.9 (19.4-23) | P=0.76 |
| TSH (mIU/mL) | 2.4 (1.9-2.7) | 1.85 (1.6-2.2) | P=0.28 |
| FT4 (ng/dL) | 0.80 (0.80-0,81) | 0.80 (0.78-0.87) | P=0.81 |
| Anti TG (IU/mL) | 7.3 (2.25-25.8) | 0.3 (0.2-0.7) | p<0.01 |
| Anti TPO ( IU/mL) | 267 (190-476) | 0.5 (0.3-0.6) | p<0.01 |
| Strain index ratio | 1.2 ± 0.2 | 0.77 ± 0.18 | p<0.01 |
Table 1: Comparisons of the values between HT and control groups.
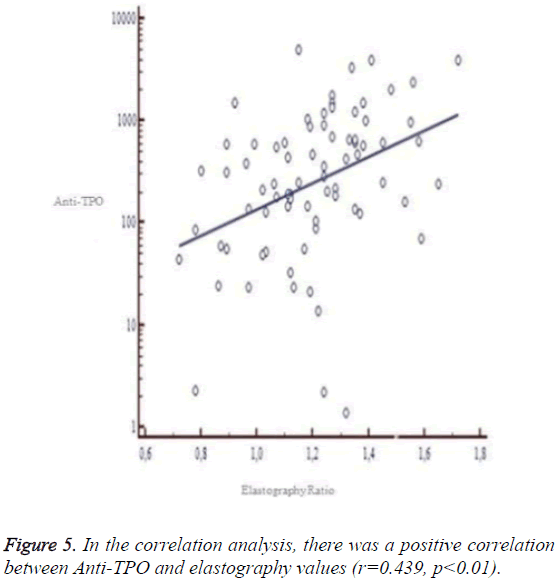
The mean anti-TG values (normal range: 0-4 IU/mL) were 7.3 (2.25-25.8) in the HT group and 0.3 (0.2-0.7) in the control group. The mean anti-TPO values of the HT and control group were (normal range: 0-10 IU/mL) 267 (190-476) and 0.5 (0.3-0.6) respectively. The mean anti-TG and anti-TPO values were significantly higher in the HT group (Table 1). There was a positive correlation between anti-TPO and elastography ratio (r=0.439, p<0.01) (Figure 5).
The mean strain index ratio was higher in HT patients, 1.2 ± 0.2, than in the control group, 0.77 ± 0.18 (p<0.01). The optimal cut-off value for elastography (strain index ratio) in HT prediction was >0.98 (83% sensitivity, 93% specificity, +LR: 13, - LR: 0.18). The area under the curve was 0.929 (Table 2 and Figure 6).
| saf | AUC | Cut-off | Sensitivity (%) | Specificity (%) | +LR | -LR |
|---|---|---|---|---|---|---|
| Strain index ratio | 0.929 | >0.98 | 83 | 93 | 13 | 0.18 |
Table 2: Estimates of diagnostic tests for the HT and control group for the differentiation of Strain index ratio.
Discussion
The results of this study revealed increased Strain Ratio Index using the sonoelastography method in the HT patient group compared to the control group. Therefore, it can be concluded that the histopathological changes (fibrosis) in the thyroid gland of HT patients cause increased stiffness and the Strain Elastography techniques can be used as adjunctive methods in the diagnosis of HT by revealing those changes in the thyroid gland.
Strain sonoelastography has a potential role in demonstrating the alterations in the viscoelasticity by measuring the degree of stiffness in the thyroid parenchyma [9]. There have been many studies which have used sonoelastography for the evaluation of the thyroid gland.
Menzilcioğlu et al. conducted a study on 31 adults diagnosed with Chronic Autoimmune Thyroiditis (CAT) and 21 controls. The median strain index ratio values (Thyroid parenchyma/ strap muscle stiffness) were found to be 1.39 ± 0.72 in the CAT group and 0.76 ± 0.55 in the control group. The median strain index ratio values were higher in the CAT group compared to the healthy control group [11].
In the current study, the strain index values of the control group were consistent with previous studies at 0.77 ± 0.18 (<0.01) and while the disease group values of 1.2 ± 0.2 (<0.01) were significantly lower in literature. These measurement differences may be attributed to the difference in the patient studied population which was adults in the previous study (mean age 39.13 ± 10.16 y) and adolescent for the current study (mean age 14.7 y). Since HT is a chronic disease, the degree of fibrosis may increase at older ages owing to the prolonged exposure to the autoantibodies, increasing the thyroid gland stiffness. Therefore, an increase in the strain index ratio is reasonable. In Menzilcioğlu et al. study that used the similar method on adults, there was a positive correlation between anti-TPO values and the thyroid tissue strain index. Similarly, there was a positive correlation between anti-TPO and elastography parameters in the current study which supports to Menzilcioğlu et al. study results (r=0.439, p<0.01). Anti-TPO autoantibodies show the degree of thyroid gland damage and lymphocytic infiltration [14,15]. This may be related with the fibrosis which is the reason for the increased strain ratio index.
Menzilcioğlu et al. determined (AUC) values to be 0.775 in the ROC curve analysis, while they were found to be 0.929 in the current study. This high result yields a higher reliability. The sensitivity and specificity values in the previous study were 96% and 67% respectively and in the current. Study values of 83% sensitivity and 93% specificity were determined. Even though the sensitivity was slightly lower, there was much higher specificity than in the previous study.
Hekimoğlu et al. performed a similar study on 50 patients and 40 healthy control group subjects using the shear-wave elastography (US-SWE) technique. The optimal cut-off value for CAT prediction was 2.42 m/s (77% sensitivity, 71% specificity). AUC was 0.849 [12]. Similarly, in another study conducted by Sporea et al. 136 patients with diffuse thyroid disease and 44 healthy controls were evaluated using the ARFI technique. The Thyroid Gland Stiffness (TGS) assessed by ARFI in healthy subjects 2 ± 0.40 m/s was significantly lower than in those with Graves’ Disease (GD) 2.67 ± 0.53 m/s (p<0.0001) and CAT patients 2.43 ± 0.58 m/s (p=0.0002), but the differences were not significant between GD vs. CAT patients (p=0.053). The optimal cut-off value for the prediction of diffuse thyroid pathology was 2.36 m/s. For this cut-off value, TGS had 62.5% sensitivity, 79.5% specificity and AUC=0.804 [13]. Even though both studies used different sonoelastography techniques, the AUC, sensitivity and specificity values of the current study were found to have a higher reliability.
The current study has some limitations. Although there is a gender imbalance, this is due to the female predilection to the disease. Thus, the study cohort reflects the true disease population. A major limitation of the study was the lack of histopathology results of the patients. However, all cases were proven to have HT based on increased serum autoantibody levels and clinical diagnosis in the outpatient practice. Another disadvantage of the study was related to the sonoelastography technique. The strain elastography method is operator dependent and it is therefore difficult to obtain standardized data compared to the new generation sonoleastography techniques. Another limitation was the low number of patients. Further studies with a greater number of patients are necessary to improve the study results. Another weakness of the present study was the lack of inter and intra-observer data. The agreement studies could better prove the reproducibility as well as improving the data analysis.
In conclusion, strain elastography methods can differentiate and quantify the normal thyroid gland and heterogenous thyroid gland with Hashimato thyroiditis in adolescent patients. These values are significantly correlated with the thyroid autoantibodies. These elastography techniques may be used as an adjunct to conventional B-mode ultrasonography in the diagnosis of Hashimoto thyroiditis in adolescents. Database set of the patients can be increased in future analysis in order to obtain better and precise conclusion. With the results of this study, reference values can be obtained and can be determined in the diagnosis of HT in adolescents.
Conflict of Interest
The authors declare that they have no conflict of interest.
References
- Hamburger JI. The various presentations of thyroiditis diagnostic considerations. Ann Intern Med 1986; 104: 219-224.
- De Luca F, Santucci S, Corica D. Hashimoto's thyroiditis in childhood: presentation modes and evolution over time. Ital J Pediatr 2013.
- Lee SJ, Lim GY, Kim JY. Diagnostic performance of thyroid ultrasonography screening in paediatric patients with a hypothyroid, hyperthyroid or euthyroid goiter. Pediatr Radio 2016; 46: 104-111.
- Troch M, Woehrer S, Streubel B. Chronic autoimmune thyroiditis (Hashimoto's thyroiditis) in patients with MALT lymphoma. Ann Oncol 2008; 19.
- Marcocci C, Vitti P, Cetani F. Thyroid ultrasonography helps to identify patients with lymphocytic thyroiditis who are prone to develop hypothyroidism. J Clin Endocrinol Metab 1991; 72: 209-213.
- Yoshida A, Adachi T, Noguchi T. Echographic findings and histological feature of the thyroid: a reverse relationship between the level of echo-amplitude and lymphocytic infiltration. Endocrinol Jpn 1985; 32: 681-690.
- Müller HW, Schröder S, Schneider C. Sonographic tissue characterization in thyroid gland diagnosis. A correlation between sonography and histology. Klin Wochenschr 1985; 63: 706-710.
- Xie P, Xiao Y, Liu F. Real-time ultrasound elastography in the diagnosis and differential diagnosis of sub-acute thyroiditis. J Clin Ultrasound 2011; 39: 435-440.
- Yang Z, Zhang H, Wang K. Assessment of diffuse thyroid disease by strain ratio in ultrasound elastography. Ultrasound Med Biol 2015; 41: 2884-2889.
- Cantisani V, Lodise P, Grazhdani H. Ultrasound elastography in the evaluation of thyroid pathology Current status. Eur J Radiol 2014; 83: 420-428.
- Menzilcioğlu MS, Duymus M, Gungor G. The value of real-time ultrasound elastography in chronic autoimmune thyroiditis. Br J Radiol 2014.
- Hekimoğlu K, Yıldırım Dönmez F, Arslan S. The role of shear wave elastography in the diagnosis of chronic autoimmune thyroiditis. Med Ultrason 2015; 322-326.
- Sporea I, Sirli R, Bota S, Vlad M, Popescu A, Zosin I. ARFI elastography for the evaluation of diffuse thyroid gland pathology: Preliminary results. World J Radiol 2012; 174-178.
- Pandit AA, Warde MV, Menon PS. Correlation of number of intra-thyroid lymphocytes with anti-microsomal antibody titer in Hashimoto’s thyroiditis. Diagnos Cytopathol 2003; 63-65.
- Fukuhara T, Matsuda E, Izawa S. Utility of shear wave elastography for diagnosing chronic autoimmune thyroiditis. J Thyroid Res 2015.
