ISSN: 0970-938X (Print) | 0976-1683 (Electronic)
Biomedical Research
An International Journal of Medical Sciences
Research Article - Biomedical Research (2017) Volume 28, Issue 7
Non-Newtonian and Newtonian blood flow in human aorta: A transient analysis
Vinoth R1,2*, Kumar D2, Raviraj Adhikari3 and Vijay Shankar CS4
1Department of Electronics and Communication Engineering, Manipal Institute of Technology, Manipal University, Manipal, Udupi, Karnataka, India
2Department of Electronics and Communication Engineering, Periyar Maniammai University, Vallam, Thanjavur, Tamil Nadu, India
3Department of Mechanical and Manufacturing Engineering, Manipal Institute of Technology, Manipal University, Manipal, Udupi, Karnataka, India
4Department of Cardio Vascular and Thoracic Surgery, Apollo Hospitals, Greams Road, Chennai, Tamil Nadu, India
- *Corresponding Author:
- Vinoth R
Department of Electronics and Communication Engineering
Periyar Maniammai University, Tamil Nadu, India
Accepted on December 15, 2016
Pulsatile blood flow in an aorta of normal subject is studied by Computational Fluid Dynamics (CFD) simulations. The main intention of this study is to determine the influence of the non-Newtonian nature of blood on a pulsatile flow through an aorta. The usual Newtonian model of blood viscosity and a non- Newtonian blood model are used to study the velocity distributions, wall pressure and wall shear stress in the aorta over the entire cardiac cycle. Realistic boundary conditions are applied at various branches of the aorta model. The difference between non-Newtonian and Newtonian blood flow models is investigated at four different time instants in the fifth cardiac cycle. This study revealed that, the overall velocity distributions and wall pressure distributions of the aorta for a non-Newtonian fluid model are similar to the same obtained from Newtonian fluid model but the non-Newtonian nature of blood caused a considerable increase in Wall Shear Stress (WSS) value. The maximum wall shear stress value in the aorta for Newtonian fluid model was 241.706 Pa and for non-Newtonian fluid model was 249.827 Pa. Based on the results; it is observed that the non-Newtonian nature of blood affects WSS value. Therefore, it is concluded that the non-Newtonian flow model for blood has to be considered for the flow simulation in aorta of normal subject.
Keywords
Computational fluid dynamics, Fluid-structure interaction, Aorta, Newtonian model, Non-Newtonian model, Wall shear stress, Wall pressure.
Introduction
The cardiovascular system maintains an adequate blood flow to all cells in the body. The flow of blood in the cardiovascular system depends upon the pumping mechanism of the heart. This mechanism induces the blood to flow in pulsatile nature. The aorta is the largest and most important artery in cardiovascular system; it carries blood from the heart to other organs in a body. The occurrence of many diseases in cardiovascular system has been associated with blood flow behaviour in the blood vessels [1]. The investigation on blood flow in aorta is crucial because the flow of blood changes hemodynamic stresses act upon the aortic wall. The relationship between hemodynamic stresses and corresponding changes in the layer of blood vessel wall is the major cause of aneurysm [2], other lesions. Therefore, the interaction between hemodynamic stresses and physiological behavior of blood vessel wall plays an important role in aneurysm formation, progression and rupture. Computational Fluid Dynamics (CFD) and Fluid-Structure Interaction (FSI) techniques have been widely used for simulating the blood flow in idealized and patient-specific aorta models.
The blood is a non-Newtonian fluid and it follows Newtonian nature when the shear rate is above 100 s-1 [3,4]. The effect of non-Newtonian behavior of flow is not significant in large blood vessels like aorta, where the shear rate is high. Considering the blood as a Newtonian fluid is a satisfactory assumption for large arteries such as aorta [3,5,6]. In transient analysis, the non-Newtonian flow effects could become significant when the shear rate is below 100 s-1 [3]. Some authors concluded that the non-Newtonian fluid approximation for flow in large arteries is crucial [7-9] while others found it is an unimportant assumption [10,11]. Gijsen et al. [9] highlighted various differences between non-Newtonian and Newtonian flow patterns when they studied flow through 90° curved tube. Li et al. [12] simulated blood flow through an Abdominal Aortic Aneurysm (AAA) model with Stent-Graft (SG) using non-Newtonian fluid assumption. They discussed about key biomechanical factors which are causing SG migration. The authors concluded that the blood flow conditions, aneurysm and SG geometries were major reasons for SG migration. Amblard et al. [13] developed a methodology using non-Newtonian fluid approximation to observe the relation between the aorta’s wall and endocraft to find when type I endoleaks could occur. They evaluated the stresses on the aorta’s wall generated by the blood flow.
In the present study, CFD approach is used to simulate the blood flow through an aorta with Newtonian fluid assumption for assessing the hemodynamic parameters. This study also depicts the influence of non-Newtonian nature of blood on various physiologically important flow parameters like velocity, wall pressure and wall shear stress (WSS). The Casson non-Newtonian model is used in this study because of its capability in representing the non-Newtonian blood rheology [14]. The blood flow through a bifurcation with an aneurysm in the cerebrovascular system was simulated with the Casson non-Newtonian model by Perktold et al. [10]. Perktold et al. [6] studied pulsatile flow characteristics through a human carotid bifurcation with the Casson model approximation. The blood assumed as power-law non-Newtonian fluid by Liepsch et al. for their flow study through renal artery and T-shaped bifurcations [15-19]. The complex flow regions could happen in the abdominal aorta segment due to bifurcations, branches and curvature of the arteries [20]. Wiwatanapataphee et al. [21] studied the effect of branching vessel on the pulsatile blood flow in the human coronary artery with non-Newtonian fluid assumption. The authors concluded that the branching of artery influences the flow in the artery substantially. Shahcheraghi et al. [22] described the influence of aortic branches on flow of blood. In this work, those aortic branches recommended by Shahcheraghi et al. are considered. The aorta model is simplified by excluding coronary arteries, intercostal arteries, gonadal artery, arteries branching from the brachiocephalic trunk, subclavian artery and celiac trunk. The inflow data to the aorta used in this study was measured at the ascending aorta past the coronary arteries and the coronary arteries carry approximately 4-5 percent of the whole cardiac output [23]. Hence, the coronary arteries are not considered in the present work. The intercostal arteries carry less than 1percent of the whole cardiac output [23] and hence these arteries are not considered in the present work. The brachiocephalic trunk, common carotid artery, left subclavian artery, celiac trunk, renal arteries, superior mesenteric artery, inferior mesenteric artery and common iliac arteries are included in the aorta model. In order to reduce the computational time the other arteries and branches are not considered in the aorta model.
There are substantial studies reported on the CFD simulation of blood flow which investigated the influence of the non- Newtonian nature of blood on a pulsatile flow in idealized aorta, coronary artery and carotid artery. The CFD analyses have been carried out by a few authors with symmetric aortic bifurcation geometry. The aortic bifurcation is not a symmetric geometry and the influence of asymmetry in geometry on flow analysis is crucial [24]. To the best of knowledge of authors, the CFD analysis of blood flow in an aorta model with Newtonian, non-Newtonian fluid assumptions had not been attempted. There are a few studies which have been conducted with realistic geometry of aorta. The purpose of this study is to find the influence of the non-Newtonian nature of blood on a pulsatile flow through an aorta. The physiologically important flow parameters such as velocity distribution, wall pressure and wall shear stress are estimated in the aorta through CFD simulation with both non-Newtonian and Newtonian fluid models.
Methodology
Aorta geometry and mesh generation
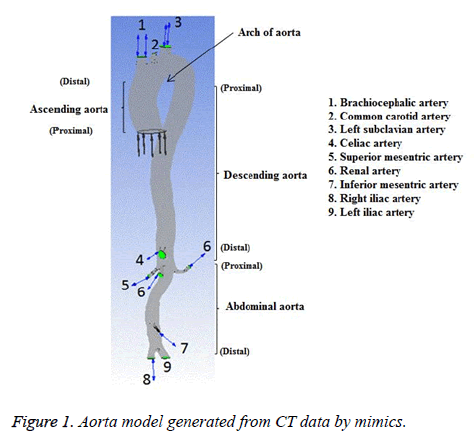
The subject was a 36 year old female without any known heart disease. The heart rate of this subject was 78 bpm and her blood pressure range was (120-160) mmHg/(62-80) mmHg. The cardiac output and blood flow can be affected by abnormal heart rate. The elevated heart rate can initiate and promote the atherosclerotic process [25] by several mechanisms and WSS is one of the mechanisms [26]. In the present study, heart rate of the subject considered was normal and there would not be any effect on blood flow. All medical data were obtained from the subject for diagnostic purposes. This study has been approved by the Institutional Ethics Committee-Clinical Studies (Apollo Hospitals, Chennai, India) and adapted to the declaration of Helsinki. The sectional image of aorta of the representative case was obtained with the aid of a 320-slice Computed Tomographic (CT) scanner (Aquilion one, Toshiba Medical System). The intravenous contrast medium was injected during imaging process to acquire good quality image. The slice thickness was 0.5 mm and pixel size was 0.5 mm. The 3D geometry of aorta was reconstructed from the dicom format files of CT image using Mimics v17.0 (Materialise,Belgium). The reconstructed 3D geometry of aorta of normal subject is shown in Figure 1.
The fluid domain geometry data of the aorta model was imported to ANSYS Workbench (v15, ANSYS, Inc.) in IGES format. The model was discretized by using tetrahedral fluid elements.
Mesh sensitivity test: Three tetrahedral meshes were created for the fluid domain geometry of the aorta model with element numbers 625456, 1037252 and 1382806. Mesh sensitivity test was performed with steady state boundary conditions using the laminar flow model by monitoring maximum value of WSS of the model.
The Navier-Stokes and continuity equation are the governing equations for the motion of three-dimensional fluid (blood). A finite volume based solver ANSYS CFX was employed to solve these equations. Laminar flow model was used for the simulation of steady flow in aorta. The RMS residual value of 10-4 was taken as maximum value to obtain the accuracy of the solution. The maximum iteration was considered as 500 and minimum iteration was considered as 100 in convergence control to achieve convergence in each simulation. The Reynolds number for blood flow was fixed at 1350 [27]. The average velocity of 0.225 m/s was obtained from the Reynolds number and imposed at the inlet of ascending aorta as boundary condition. Due to lack of pressure data, opening boundary condition was assumed at the outlet of all the branches of aorta with relative static pressure of 120 mmHg. The wall of aorta was assumed as rigid and no-slip condition was employed at the wall. Blood flowing through the aorta was approximated to be a Newtonian, homogeneous and an incompressible fluid. The blood density was taken as 1050 kg m-3 and dynamic viscosity of blood as 0.0035 Ns m-2 [3,5,28].
Particulars of mesh sensitivity test for the aorta model are shown in Table 1. The difference in maximum WSS value between fine and medium mesh was 6.23%, but between medium and coarse mesh was 15.84%. The 1382806 elements mesh model was considered for further analysis.
| Mesh | Number of elements | WSS (Pa) | Difference (%) |
|---|---|---|---|
| Coarse mesh | 625456 | 24.778 | 15.84 |
| Medium mesh | 1037252 | 28.704 | |
| 6.23 | |||
| Fine mesh | 1382806 | 30.495 |
Table 1. Mesh sensitivity test result shows maximum wall shear stress value for different mesh element numbers of aorta model.
Transient state simulation and boundary conditions
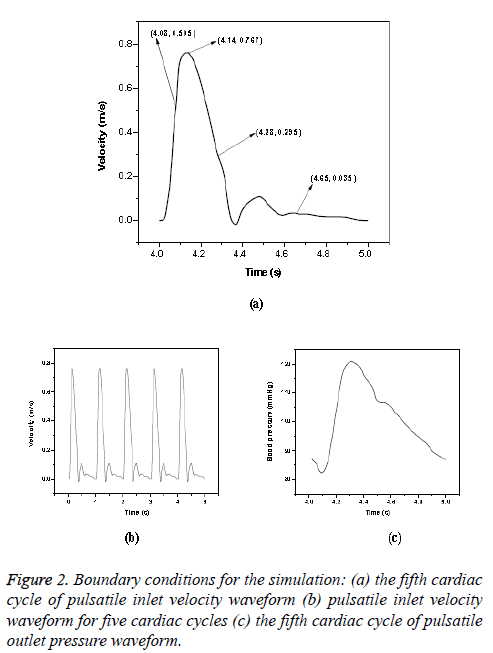
Newtonian model: The pulsatile blood flow in aorta was investigated by using transient analysis. A time varying pulsatile velocity profile at the ascending aorta inlet and pressure waveforms at the outlet of iliac arteries were imposed in simulations based on data from Olufsen et al. [23]. These waveforms are shown in Figure 2. (Figures 2a and 2c) and these conditions had been verified by several experimental data [5,29]. The cardiac cycle period was 1 s with peak blood flow occurred at 0.14 s. A fifteen percent of the inlet flow volume was assumed for brachiocephalic artery; five percent of the inlet flow volume was prescribed at common carotid artery and left subclavian artery [22]. A total proportion of ten percent of the thoracic mass flow was considered for each renal artery [30] and pulsatile pressure was fixed at other branches. Blood was treated as a homogeneous, Newtonian and an incompressible fluid. The blood flow can be considered as laminar in large blood vessels like aorta and it was found to be laminar in Abdominal Aortic Aneurysms (AAAs) during exercise [31]. In this study, the maximum Reynolds number based on the flow velocity was 3971. Since the maximum Reynolds number was lower than the threshold Reynolds number [32,33] the flow was assumed as laminar. Various cardiac cycles are required for achieving convergence for the transient analysis [22,34]. In CFD simulation, five cardiac cycles (Figure 2b) were used with time step of 0.002 s. The fifth cardiac cycle was used as the final periodic solution to obtain the hemodynamic parameters from the model. The other properties and boundary conditions were same as that of steady state analysis.
Non-Newtonian model: Shear thinning or pseudoplastic fluids are the fluids whose effective viscosity decreases with increase in shear rate. This fluid structure is time-independent. The Casson model was recommended for shear thinning liquids [35]. In the present work, the Casson model was used in transient simulation to approximate the non-Newtonian flow. The dynamic viscosity for the Casson model is given by Equation 1 [36].
√u=√τY/γ+√K → (1)
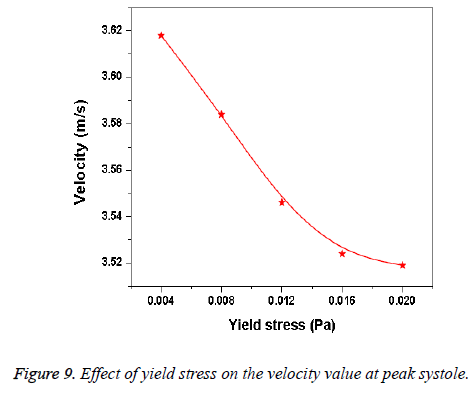
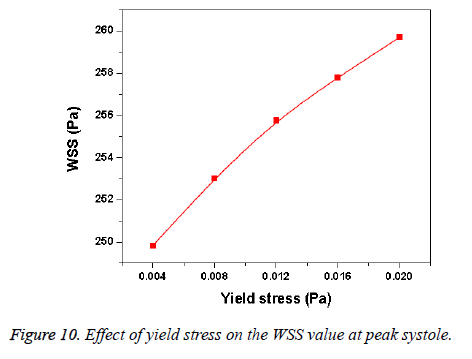
Where is the dynamic viscosity, γ the shear strain rate, yield stress and the viscosity consistency. The yield stress of human blood in normal condition is between 0.0003 Pascal and 0.02 Pascal [37]. The yield stress was taken as 0.004 Pascal. The other properties and boundary conditions were assumed same as Newtonian model simulation condition.
Results
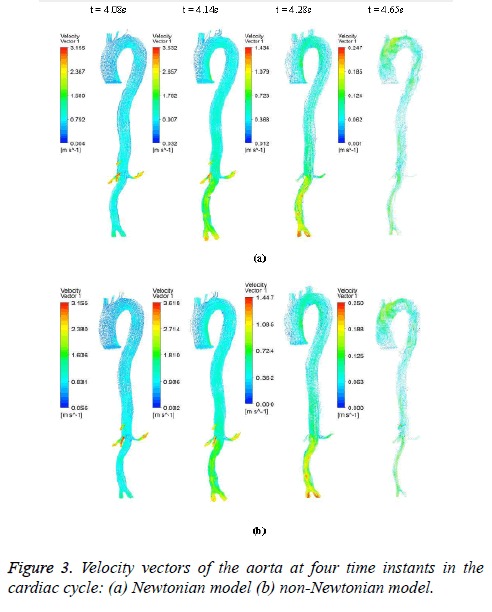
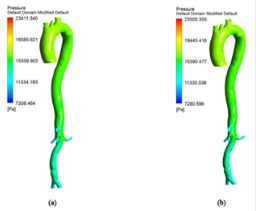
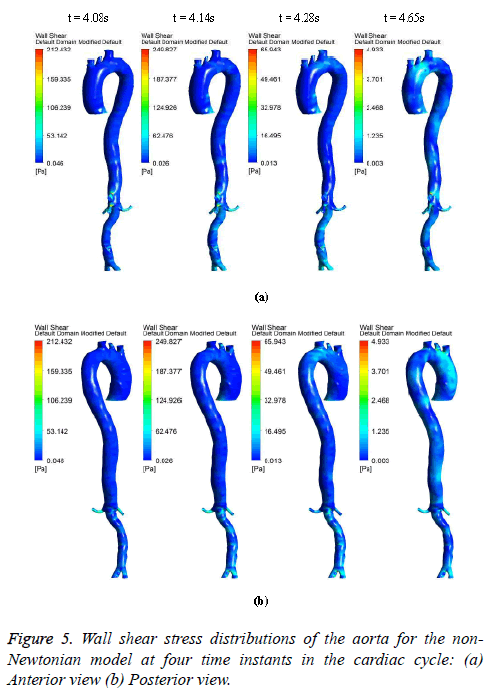
The hemodynamic parameters were measured at four different time instants during the cardiac cycle. These four time instants (t=4.08 s (maximum acceleration), 4.14 s (peak systole), 4.28 s (maximum deceleration) and 4.65 s (mid-diastole)) represent critical flow rate phases in the cardiac cycle. Figure 3 depicts velocity vectors of the aorta with a Newtonian and a non- Newtonian model at four time instants in the cardiac cycle. The velocity vector plot shows region of high velocity in aortic arch, branches of the distal portion of the aorta with Newtonian and non-Newtonian models. The region of low velocity appears in the ascending and descending aorta. The maximum velocity value at peak systole is increased insignificantly in the non-Newtonian model. The high velocity regions at middiastole are reduced in the non-Newtonian model. The overall velocity vector patterns of the aorta for a non-Newtonian fluid model are similar to velocity vector patterns of a Newtonian fluid model. Figure 4 presents the variation of wall pressure of the aorta at peak systole in the cardiac cycle. Since wall pressure contours of the aorta at all four time instants of the cardiac cycle for a non-Newtonian fluid model are similar to wall pressure contours of Newtonian model, only the wall pressure contour at peak systole is presented here. In both Newtonian and non-Newtonian models, the wall pressure diminishes in flow direction. The maximum wall pressure value of the aorta is increased in non-Newtonian model. Figure 5 shows wall shear stress pattern of the aorta for the non- Newtonian model at different time instants in the cardiac cycle. The range of wall shear stress is between 0.003 and 249.8 Pa. At time t=4.08 s of the cardiac cycle very low wall shear stress (0.046-53.142 Pa) is distributed uniformly in the ascending aorta, arch of aorta and descending aorta. Quite marked regions of low shear stress (53.142-106.239 Pa) are appeared at all the branches of abdominal aorta. At peak systole, the wall shear stress reaches its maximum value and a few patches of low wall shear stress (62.476-124.926 Pa) are appeared in the abdominal aorta region. At time t=4.28 s of the cardiac cycle few patches of low wall shear stress (16.495-32.978 Pa) are distributed in aortic arch, number of this patches are increased in the posterior view of the aortic arch and abdominal aorta. At mid-diastole, the intensity of low wall shear stress (1.235-2.468 Pa) patches has increased in the region of aortic arch and abdominal aorta (anterior and posterior view). Five intense regions of low shear stress appear in posterior view of descending aorta.
At all-time instants, the region of high wall shear stress appears at the proximal end of the branches and aortic bifurcation. This high wall shear stress exists due to sudden contraction and At all-time instants, the region of high wall shear stress appears at the proximal end of the branches and aortic bifurcation. This high wall shear stress exists due to sudden contraction and bifurcation of the artery. Since at mid-diastole the flow has almost reduced to zero, the maximum value of shear stress was only 4.933 Pa. The peak velocity of reverse flow is insignificant; hence low wall shear stress is uniformly distributed over the entire artery. During flow acceleration phases the value of wall shear stress begins to increase and patches of low wall shear stress are distributed in the aorta. As the blood flow decelerates, the value of wall shear stress begins to decrease and intensity of low wall shear stress patches are increased.
In general, the high wall shear stress regions are dominant at high flow velocities close to the distal portions of the artery and at all-time instants of the cycle the low wall shear stress regions are present close to the proximal portions of the artery [38].
In this study, at peak systole the high shear stress occurred in abdominal region and low shear stress distributed in descending aorta region. The low wall shear regions are more in descending aorta due to its larger diameter than abdominal aorta. The high wall shear stress regions are observed where there is a narrowing in the aorta geometry profile.
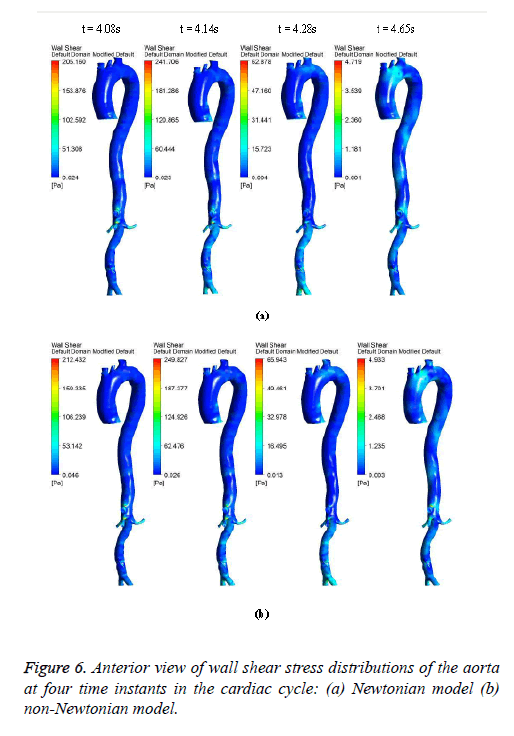
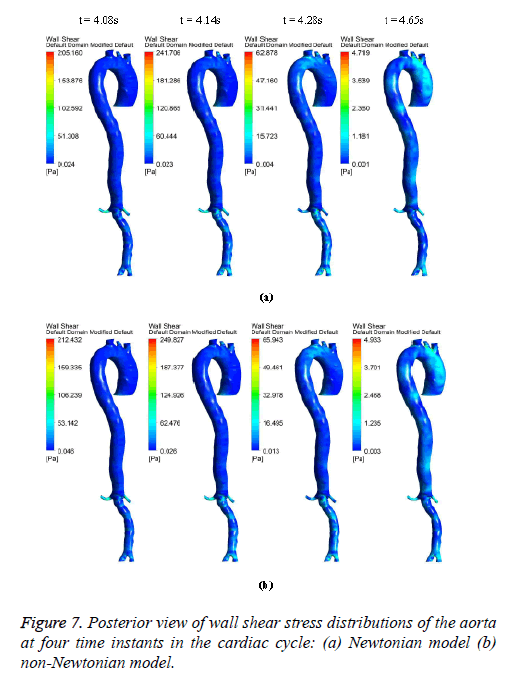
Figures 6-8 indicate the wall shear stress distribution of aorta at four time instants for a non-Newtonian and a Newtonian fluid model. It is interesting to see from Figures 6 and 7 that the wall shear stress patterns are similar in non-Newtonian and Newtonian models at time t=4.08 s of the cardiac cycle. At peak systole the shear stress pattern of non-Newtonian model is similar to the same of Newtonian model but few patches of low shear stress are distributed in aortic arch and its branches in only non-Newtonian model. It can be observed from Figures 6 and 7 that the intensity of low WSS patches in aortic arch, descending region and abdominal region is more in non- Newtonian model than Newtonian model.
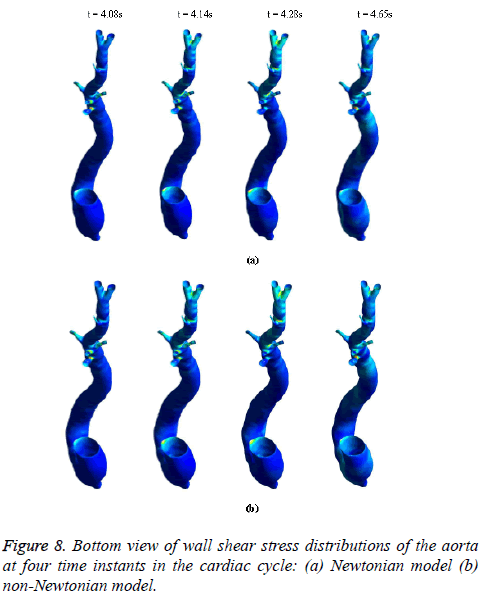
Figure 8 depicts that the intensity of WSS patches at ascending aorta inlet, bifurcation outlet and branches of aorta in non- Newtonian model is greater than in Newtonian model. Hence, the non-Newtonian nature of blood affects the inlet, outlets and branches more than inner and outer regions of aorta. This effect exists because the shear rate is lower in inlets, outlets and branches than inner and outer regions of aorta. In non- Newtonian model, the variation in viscosity is inversely proportional to variation in shear rate.
The results from Figures 6 and 7 indicate that the WSS values in non-Newtonian model are greater than WSS values in Newtonian model. It can be observed from the results that the non-Newtonian model is more significant during flow decelerating phase and also when the flow velocity is close to zero. This observation agrees to those observed by Caballero et al. [39].
Discussion
Hemodynamic parameters of blood flow in arteries are very crucial. It plays a key role in the initiation and occurrence of many diseases in arterial system. Flow recirculation, separation, low and oscillating wall shear stresses are to be considered as atheromatic factors to develop diseases in arterial system [40,41]. In many studies the blood has been assumed as Newtonian fluid but arterial flow and stress pattern can be affected by rheological properties of the blood. Gijsen et al. [42] found from their study on blood flow in a carotid bifurcation model the velocity distribution of flow could be affected by shear thinning non-Newtonian property of blood. The idea of this study was to investigate the difference between Newtonian and non-Newtonian blood flow models of aorta. Results for transient analysis of blood flow in aorta have been presented in the preceding section. Results of velocity distribution, wall pressure and WSS distribution of aorta at four different time instants in the cardiac cycle have been presented for Newtonian and non-Newtonian fluid models. This study provides an idea about whether to include non- Newtonian blood models during modelling of blood flow in aorta or not. The velocity vector plots of the aorta for a Newtonian and a non-Newtonian model are shown in Figure 3. This vector plot shows region of high velocity in distal part and branches of the distal portion of the aorta with Newtonian and non-Newtonian models. These results agree to those observed by Sheidaei et al. [43]. The overall velocity vector patterns of the aorta for a non-Newtonian fluid model are similar to velocity vector patterns of a Newtonian fluid model. The variation in yield stress ( ) within a physiological value fundamentally affects the velocity and WSS profiles. Some yield stress values for normal human blood available in the literature are taken in simulating the non-Newtonian flow through aorta. The results obtained from the simulation indicate that the velocity value decreases as the increases as shown in Figure 9. Sankar et al. [44] had obtained similar pattern of variation of velocity with respect to yield stress from their steady flow analysis on blood flow through a catheterized artery. This is because the shear thinning non-Newtonian property of blood decreases the peak velocity of the blood flow. The wall pressure distribution of aorta at peak systole is shown in Figure 4. The peak value of wall pressure for non- Newtonian model is greater than the value of Newtonian model. Figures 5-8 present the WSS distribution of aorta. At all-time instants, regions of low WSS appeared at the proximal end (ascending aorta, aortic arch and descending aorta) of the aorta and regions of high WSS predominate at the distal end (abdominal aorta) of the aorta. This type of WSS pattern occurred because of tapering of aorta towards the distal end. This result is consistent with results obtained by Kirpalani et al. [45] and Myers et al. [46]. The maximum shear stress value for Newtonian fluid model is 241.706 Pa. Zhonghua et al. [47] obtained considerably higher value than this, but their WSS distribution was almost similar to those obtained from this study. It is noticed from the result analysis, that the wall shear stress value for the non-Newtonian flow is higher than that of the Newtonian flow. This is in good agreement with results obtained by Lou et al. [48] and Chen et al. [49]. It is found that the WSS value increases marginally as the yield stress increases and it is shown in Figure 10. This effect occurred because the variation of dynamic viscosity is directly proportional to variation of yield stress. Sankar et al. [44] and Lou et al. [48] had found similar pattern of variation of WSS with respect to yield stress from their study. It is considered that the hemodynamic stresses are to have significant effects on the development of lesions in the arterial system. The WSS acts directly on the aortic wall. The mechanoreceptor converts wall shear stress into its equivalent biological signal and this signal alters the cellular function of the endothelial cells [50,51]. The wall shear stress affects the rate of mass transport throughout the arterial walls and it influences the occurrence of atherogenesis [44]. The low shear stress has been linked with thrombus formation [52], aneurysm progression [53] and aneurysm ruptures [54,55] whereas high wall shear stress has been associated with cerebral aneurysms [54,56]. The variation in wall shear stress is one of the factors to cause intimal thickening [57-59]. Fry [60], Caro et al. [61], Giddens et al. [62] and Ku et al. [63] had investigated and reported that the WSS could be a substantial factor to cause coronary artery disease. In clinical applications, the assessed WSS could assist to understand about the pathological conditions of cardiovascular system and factors affecting endothelial cells. The non-Newtonian nature of the human blood makes differences in the flow behavior according to people’s age. The shear rate in the blood circulation of elderly people is lower [64] than those of younger people. The blood acts like a Newtonian fluid in younger people due to this higher shear rate. The non-Newtonian nature of blood affects velocity, WSS values and distributions of pulsatile flow. It is very important to consider the non-Newtonian nature of blood in simulations during the assessment of relationship between arterial diseases and hemodynamic parameters of the blood flow. A Newtonian model for blood could render inappropriate interpretation of results of analysis. Based on the above discussions, it could be concluded that using a non-Newtonian model for blood is an appropriate assumption.
Limitations
In the current study, the aorta wall was assumed as rigid. In reality the aorta walls are hyper elastic. Due to this, the results of this investigation may not be generalized to realistic conditions. The outcome of this study is based on the analysis of one subject. Liu et al. [65] investigated the influence of both non-Newtonian nature and pulsatile nature of blood flow on the distributions of luminal surface Low-Density Lipoprotein (LDL) concentration and oxygen flux within luminal wall of an aorta. In this study, the aorta model constructed from Magnetic Resonance Imaging (MRI) technique. The authors compared the results of Newtonian model with non-Newtonian one under steady and transient state conditions. They reported that, WSS value could be increased in aorta by the non-Newtonian nature of blood under steady state condition. This result was obtained from the analysis of one subject. The outcome of the present investigation agrees to those observed by Liu et al. The reproducibility of results may be negatively influenced by reduced number of subjects. This may be overcome by considering more number of subjects which make the results statistically significant.
Conclusion
In this study, the CFD models of aorta are constructed to investigate the non-Newtonian nature of blood on a pulsatile flow. Results of velocity distribution, wall pressure and WSS distribution of aorta at four different time instants in the cardiac cycle have been presented for Newtonian and non- Newtonian fluid models. It is concluded that the flow patterns of Newtonian and non-Newtonian blood models are similar, but the non-Newtonian nature of blood caused a significant increase in wall Shear Stress (WSS) patterns. It is very difficult to observe the quantitative information of hemodynamic profiles like flow parameters, wall pressure and WSS in vivo. Computed profiles from the aorta model could be used as a diagnostic tool in clinical applications. For example, the measured flow profiles from a diseased subject could be compared with flow profiles from a healthy subject. The information generated from this comparative study plays an important role in understanding of the pathologic condition of diseased subject. The computed hemodynamic profiles from the CFD analysis could also be used with surgery and anesthesia simulators to train the medical professionals.
References
- Moayeri MS, Zendehbudi GR. Effects of elastic property of the wall on flow characteristics through arterial stenosis. J Biomech 2003; 36: 525-535.
- Salsac AV, Sparks SR, Chomaz JM, Lasheras JC. Evolution of the wall shear stresses during the progressive enlargement of symmetric abdominal aortic aneurysms. J Fluid Mech 2006; 560: 19-51.
- Pedley TJ. The fluid mechanics of large blood vessels. Cambridge University Press Cambridge 1980.
- Berger SA, Jou L. Flows in stenotic vessels. Ann Rev Fluid Mech 2000; 32: 347-382.
- Fung YC. Biomechanics: Circulation. Springer New York (2nd edn.) 1997.
- Perktold K, Resch M, Florian H. Pulsatile non-Newtonian flow characteristics in a three-dimensional human carotid bifurcation model. J Biomech Eng 1991; 113: 464-475.
- Rodkiewicz CM, Sinha P, Kennedy JS. On the application of a constitutive equation for whole human blood. J Biomech Eng 1990; 112: 198-206.
- Tu C, Deville M. Pulsatile flow of non-Newtonian fluids through arterial stenoses. J Biomech 1996; 29: 899-908.
- Gijsen FJH, Allanic E, van de Vosse FN, Janssen JD. The influence of the non-Newtonian properties of blood on the flow in large arteries: unsteady flow in a 90° curved tube. J Biomech 1999; 32: 705-713.
- Perktold K, Peter R, Resch M. Pulsatile non-Newtonian blood flow simulation through a bifurcation with an aneurism. Biorheology 1989; 26: 1011-1030.
- Ballyk PD, Steinman DA, Ethier CR. Simulation of non-Newtonian blood flow in an end-to-side anastomosis. Biorheology 1994; 31: 565-586.
- Lia K. Analysis of biomechanical factors affecting stent-graft migration in an abdominal aortic aneurysm model. J Biomech 2006; 39: 2264-2273.
- Amblard A, Berre HW, Bou-Said B, Brunet M. Analysis of type I endoleaks in a stented abdominal aortic aneurysm. Med Eng Phys 2009; 31: 27-33.
- Charm S, Kurland G. Viscometry of human blood for shear rates of 0-100,000 sec-1. Nature 1965; 206: 617-618.
- Moravec S, Liepsch D. Flow investigations in a model of a three-dimensional human artery with Newtonian and non-Newtonian fluids. Part I Biorheology 1983; 20: 745-759.
- Liepsch D, Moravec S. Pulsatile flow of non-Newtonian fluid in distensible models of human arteries. Biorheology 1984; 21: 571-586.
- Liepsch D. Flow patterns in elastic models of branched tubes. Physicochem Hydrodyn 1985; 6: 699-701.
- Liepsch D. Velocity measurements of viscoelastic fluids in a 90° bifurcation of a tube with rectangular cross-section. Physicochem Hydrodyn 1986; 7: 45-54.
- Liepsch D, McMillan DE. Laser-Doppler velocity measurements at a 90° bifurcation with Newtonian and non-Newtonian fluids. Proc Sixth Int Cong Biorheology 1986; 23: 221.
- Taylor HZ. Finite element modeling of three-dimensional pulsatile flow in the abdominal aorta: relevance to atherosclerosis. Ann Biomed Eng 1998; 26: 975-987.
- Benchawan W, Yong HW, Thanongchai S, Buraskorn N. Effect of branchings on blood flow in the system of human coronary arteries. Mathe Biosci Eng 2012; 9; 199-214.
- Shahcheraghi N, Dwyer HA, Cheer AY, Barakat AI, Rutaganira T. Unsteady and three-dimensional simulation of blood flow in the human aortic arch. J Biomech Eng 2002; 124: 378-387.
- Mette SO, Charles SP, Won YK, Erik MP, Ali N, Jesper L. Numerical simulation and experimental validation of blood flow in arteries with structured-tree outflow conditions. Ann Biomed Eng 2000; 28: 1281-1299.
- Friedman MH, Deters OJ, Marks FF, Bargeron CB, Hutchins CM. Arterial geometry affects hemodynamics. Atherosclerosis 1983; 46: 225-231.
- Scicchitano P, Carbonara S, Ricci G, Mandurino C, Locorotondo M. HCN channels and heart rate. Molecules 2012; 17: 4225-4235.
- Scicchitano P, Cortese F, Ricci G, Carbonara S, Moncelli M, Iacoviello M, Cecere A, Gesualdo M, Zito A, Caldarola P, Scrutinio D, Lagioia R, Riccioni G, Ciccone MM. Ivabradine, coronary artery disease, and heart failure: beyond rhythm control. Drug Design Development Therapy 2014; 8: 689-700.
- Liepsch D, Moravec S, Baumgart R. Some flow visualization and laser-Doppler velocity measurements in a true-to-scale elastic model of a human aortic arch- a new model technique. Biorheology 1992; 29: 563-580.
- Nichols WW. Blood flow in arteries: theoretical, experimental, and clinical principles. Oxford University Press Arnold London (4th edn.) 1998.
- Pedley TJ. Mathematical modelling of arterial fluid dynamics. J Engi Mathe 2003; 47: 419-444.
- Shipkowitz T, Rodgers VGJ, Frazin LJ, Chandran KB. Numerical study on the effect of secondary flow in the human aorta on local shear stresses in abdominal aortic branches. J Biomech 2000; 33: 717-728.
- Egelhoff CJ, Budwig RS, Elger DF, Khraishi TA, Johansen KH. Model studies of the flow in abdominal aortic aneurysms during resting and exercise conditions. J Biomech 1999; 32: 1319-1329.
- White FM, Fluid Mechanics. McGraw-Hill New Delhi (4th edn.) 1990.
- http://www.uio.no/studier/emner/matnat/math/MEK4450/h11/undervisningsmateriale/modul-5/Pipeflow_intro.pdf
- Kim T, Cheer AY, Dwyer HA. A simulated dye method for flow visualization with a computational model for blood flow. J Biomech 2004; 37: 1125-1136.
- Casson N. A flow equation for the pigment oil suspensions of the printing ink type. Rheol Dispers Sys 1959; 84-102.
- ANSYS CFX user guide, ANSYS, Inc. version 15.
- Charm SE, Kurland GS. Blood rheology. Cardiovascular Fluid Dynamics 1972; 2: 157-203.
- Johnston BM, Johnston PR, Corney S, Kilpatrick D. Non-Newtonian blood flow in human right coronary arteries: transient simulations. J Biomech 2006; 39: 1116-1128.
- Caballero ADL. Numerical simulation of non-Newtonian blood flow dynamics in human thoracic aorta. Comput Methods Biomech Biomed Eng 2015; 18: 1200-1216.
- Araim O, Chen AH, Sumpio B. Hemodynamic forces: effects on atherosclerosis, New Surg 2001; 1: 92-100.
- Giddens DP, Mabon RF, Cassanova RA. Measurements of disordered flows distal to subtotal vascular stenoses in the thoracic aortas of dogs. Circ Resea 1976; 39: 112-119.
- Gijsen FJH, van de Vosse FN, Janssen JD. The influence of the non-Newtonian properties of blood on the flow in large arteries: steady flow in a carotid bifurcation model. J Biomech 1999; 32: 601-608.
- Sheidaei A, Hunley SC, Zeinali-Davarani S, Raguin LG, Baek S. Simulation of abdominal aortic aneurysm growth with updating hemodynamic loads using a realistic geometry. Med Eng Phys 2011; 33: 80-88.
- Sankar DS, Hemalatha K. A non-Newtonian fluid flow model for blood flow through a catheterized artery-steady flow. App Mathe Model 2007; 31: 1847-1864.
- Kirpalani A, Park H, Butany J, Johnston KW, Ojha M. Velocity and wall shear stress patterns in the human right coronary artery. J Biomech Eng 1999; 121: 370-375.
- Myers JG, Moore JA, Ojha M, Johnston KW, Ethier CR. Factors influencing blood flow patterns in the human right coronary artery. Ann Biomed Eng 2001; 29: 109-120.
- Zhonghua S, Thanapong C, Supan T, Surasak S, Yvonne BA, David EH, Michael MD, Lawrence B, Manas S. Effect of fenestrated stents on the renal arteries: Investigation of hemodynamic changes in abdominal aortic aneurysms treated with fenestrated endovascular grafts. Int Symp Commun Inform Technol (ISCIT 2008) Vientiane Lao PDR 2008.
- Lou Z, Yang WJ. A computer simulation of the non-Newtonian blood flow at the aortic bifurcation. J Biomech 1993; 26: 37-49.
- Chen J, Lu XY, Wang W. Non-Newtonian effects of blood flow on hemodynamics in distal vascular graft anastomoses. J Biomech 2006; 39: 1983-1995.
- Gibbons GH, Dzau VJ. The emerging concept of vascular remodeling. N Engl J Med 1994; 330: 1431-1438.
- Malek AM, Alper SL, Izumo S. Hemodynamic shear stress and its role in atherosclerosis. JAMA 1999; 282: 2035-2042.
- Bluestein D, Niu L, Schoephoerster RT, Dewanjee MK. Steady flow in an aneurysm model: correlation between fluid dynamics and blood platelet deposition. J Biomech Eng-Tran ASME 1996; 118: 280-286.
- Boussel L, Rayz V, McCulloch C, Martin A, Acevedo-Bolton G, Lawton M. Aneurysm growth occurs at region of low wall shear stress patient-specific correlation of hemodynamics and growth in a longitudinal study. Stroke 2008; 39: 2997-3002.
- Shojima M, Oshima M, Takagi K, Torii R, Hayakawa M, Katada K. Magnitude and role of wall shear stress on cerebral aneurysm-computational fluid dynamic study of 20 middle cerebral artery aneurysms. Stroke 2004; 35: 2500-2505.
- Valencia A, Morales H, Rivera R, Bravo E, Galvez M. Blood flow dynamics in patient-specific cerebral aneurysm models: The relationship between wall shear stress and aneurysm area index. Med Eng Phy 2008; 30: 329-334.
- Hoi YM, Meng H, Woodward SH, Bendok BR, Hanel RA, Guterman LR. Effects of arterial geometry on aneurysm growth: three dimensional computational fluid dynamics study. J Neurosur 2004; 101: 676-681.
- Cole JS, Gillan MA, Raghunathan S, OReilly MJG. Numerical simulations of time-dependent non-Newtonian blood flow through typical human arterial bypass grafts. Sixth Irish Chem Eng Res Symp 1998.
- Ethier CR, Steinman DA, Zhang X, Karpik SR, Ojha M. Flow waveform effects on end-to-side anastomotic flow patterns. J Biomech 1998; 31: 609-617.
- Perktold K, Hofer M, Rappitsch G, Loew M, Kuban BD, Friedman MH. Validated computation of physiologic flow in a realistic coronary artery branch. J Biomech 1998; 31: 217-228.
- Fry D. Acute vascular endothelial changes associated with increased blood velocity gradients. Circ Resea 1968; 22: 165-197.
- Caro CG, Fitz-Gerald JM, Schroter RC. Atheroma and arterial wall shear: observation, correlation and proposal of a shear dependent mass transfer mechanism for atherogenesis. Proc Royal Soc London B 1971; 177: 109-159.
- Giddens DP, Zarins CK, Glagov S. Response of arteries to near wall fluid dynamic behavior. Appl Mech Rev 1990; 43: 98-102.
- Ku D, Giddens D, Zarins C, Glagov S. Pulsatile flow and atherosclerosis in the human carotid bifurcation: positive correlation between plaque and low and oscillating shear stress. Arteriosclerosis 1985; 5: 293-302.
- Reneman RS, van Merode T, Hick P, Hoeks AP. Flow velocity patterns in and distensibility of the carotid artery bulb in subjects of various ages. Circulation 1985; 71: 500-509.
- Liu X, Fan Y, Deng X, Zhan F. Effect of non-Newtonian and pulsatile blood flow on mass transport in the human aorta. J Biomech 2011; 44: 1123-1131.
