ISSN: 0970-938X (Print) | 0976-1683 (Electronic)
Biomedical Research
An International Journal of Medical Sciences
- Biomedical Research (2012) Volume 23, Issue 4
Identifying patients with diabetic nephropathy based on serum creatinine in the presence of covariates in type-2 diabetes: A retrospective study
Diabetes affects more than 170 million people worldwide and the number will rise to 370 million people by 2030. About one third of those affected, will eventually have progressive deterioration of renal function. To estimate progression of renal disease among type -2 diabetic population, with Serum Creatinine (SrCr), in the presence of covariates: fasting blood glucose (FBG), systolic blood pressure (SBP), diastolic blood pressure (DBP) and low density lipoprotein (LDL), duration of disease and age at which diabetes was diagnosed. Retrospective data collected from 132 patients, who were diagnosed as diabetic as per ADA standards with or without diabetic complications. Multiple linear regression (MLR) and logistic regression models are adopted here to estimate and predict SrCr, a well-accepted marker for the progression of diabetic nephropathy (DN). The fitted multiple linear regression models are found to be statistically significant, with p <. 001, Fitted logistic models have 88.5% and 84.7% predictive power to assess the renal disease based on mean values of predictors and last record of predictors, respectively. We conclude from the models, which are based on mean values of records, that high blood glucose and high blood pressure along with duration of diabetes are the main contributors for estimating SrCr and predicting diabetic nephropathy. Similar results are concluded from the models which are based on last records of predictors except that LDL is also a significant factor for estimating renal health and DN.
Keywords
Diabetic Nephropathy, Logistic regression, Multiple linear regression, Serum creatinine, Type 2 Diabetes.
Introduction
Diabetes mellitus (DM) is a common non-communicable disease and is reaching epidemic proportions globally. DM causes considerable morbidity and mortality due to micro and macro vascular complications [1]. Nephropathy is a life-threatening complication of diabetes mellitus and is the leading cause of end-stage renal disease (ESRD) in developed countries [2]. Estimating glomerular filtration rate (GFR) is the most rational noninvasive method of assessing the renal status in patients [3,4]. With the development of diabetic nephropathy (DN), serum creatinine (SrCr) level starts to increase and GFR starts to fall. The rate of rise in SrCr , a well-accepted marker for the progression of DN, (creatinine value 1.4 to 3.0 mg/dl) is the indicator for impaired renal function [5]. The incidence of DN is related to the duration of diabetes [6].
Renal and cardiovascular complications share common risk factors such as blood pressure, blood lipids, and glycemic control but hypertension is a major determinant of the progression of renal disease. Patients are generally treated to attain lowest safe glucose level that can be obtained to prevent or control diabetic nephropathy [3,6]. Hypertension control in patients with microalbuminuria from diabetic kidney disease shows the decline in GFR [7]. Some recent work reveals that low density lipoprotein serum cholesterol concentrations are important predictors for the development of end stage renal disease (ESRD) and overt nephropathy in patients with type -2 diabetes [8].
Previous works reveal that multiple regression and logistic regression are efficient models to estimate response variable through independent predictors. Nelson, Morgenstem and Bennett [9] have used logistic regression to estimate renal disease with birth weight in type-2 diabetic patient and analyzed by using one observation on the beginning of the study and one at the end of the study. Onyechi and Michael [10] have applied multiple regression to analyze microalbuminuria as the dependent variable and showed that patients with normal and abnormal albumin excretion are statistically different. Kenzo, Takuko and others [11] have used logistic regression in type 2 diabetic patients to show low levels of serum vitamin C is closely associated with concomitant renal dysfunction and low-grade inflammation. Spomenka , Boris and others [12] have applied multiple regression to analyze the relationship between dependent variable, renal resistance index and other analyzed variables(patient age, diabetes duration, systolic and diastolic blood pressure, albumin excretion rate, lipid values, HbA1c, creatinine clearance) as independent variables. They have concluded that systolic blood pressure, albumin excretion rate and duration of diabetes are significant for predicting renal resistance index.
In the present work retrospective data from 132 patients were collected as per ADA standards with minimum 5 years diabetic history from the data base of Dr. Lal’s Path Lab through house to house survey. We have used multiple linear regression(MLR) and logistic regression models by taking value of serum creatinine / status of renal health based on serum creatinine(SrCr) as dependent variable and fasting blood glucose(FBG), systolic blood pressure(SBP), diastolic blood pressure (DBP) , low density lipoprotein (LDL) , duration of diabetes and age at which the diabetes was diagnosed as independent variables. Firstly, multiple regression and logistic models based on all the reports from the date of diagnosis till Nov’2007(study is terminated) are used to determine the effect of diabetic complication on renal organ. Secondly, these models are applied with last available record to find the latest health of renal organ. Thus, the purpose of this paper is to observe the role of serum creatinine with known covariates for estimating renal function/ dysfunction in type -2 diabetic patients under study. Besides introduction the course of this paper is as follows. In section 2 contains material and development of the models is discussed. The models are then applied to the type -2 diabetic patients’ data and their adequacy critically assessed in section 3. We conclude this paper with a discussion in section 4.
Materials and Methods
Materials
Retrospective data from 250 patients were short – listed who were diagnosed of diabetes [as per ADA standards] from the data base of Dr. Lal’s Path Lab, a reputed NABL certified path lab. Requests were sent to patients for sharing their pathological history in terms of up-to-date reports. Out of this 164 patients responded positively. These 164 patients were contacted through a house to house survey and their pathological reports along with doctor’s prescription were collected for further verification. Reports from only 132 patients, with minimum 5 years diabetic history, were found suitable for this study as their reports indicated continuity of pathological follow- up always using the same lab. This was done to maintain benchmark of the data used. Patients included in this study were under medical supervision. ADA standards are taken as reference values for this study: FBG≥126 mg/dl for diabetes, SBP>130mmHg and DBP>90mmHg for hypertension, LDL ≥ 100 mg/dl for elevated cholesterol concentration, SrCr ≥ 1.4 mg/dl for onset of renal disease/nephropathy. Pathological history were recorded on SrCr, FBG, SBP, DBP and LDL and other details, i.e., duration of diabetes and age at which diabetes was diagnosed was also recorded. Since the study is concentrated on the renal complication arising out of type-2 diabetes only, it automatically excludes its effect on eyes, heart etc. We also excluded the cases where renal complication had preceded the onset of diabetes. Descriptive statistics of 132 patients are given in table 1.
Methods
Multiple linear regression models to estimate the value of serum creatinine
All the patients under study experienced an initial event E1 (diagnosed as diabetes as per ADA standards) but not all of them experienced complications due to diabetes, a second event E2 (onset of renal disease/diabetic nephropathy) till the study was terminated on 5thNovember, 2007. Patients under study are with different history of disease and health condition. Multiple linear regression (MLR) model is used to estimate response variables with independent predictors which is defined as follows:
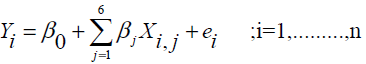 (1)
(1)
Where Yi , denoting the serum creatinine (SrCr) which is taken as an indicator for renal health, is a response variable and X1,1, X1,2, X1,3, X1,4, X1,5, X1,6, denoting FBG, SBP, DBP ,LDL, duration of the disease and age at which diabetes was diagnosed, respectively, are independent predictors for the ith (i = 1,2 …,n) patient .The parameter βo is the intercept and parameter βi’s (j = 1,2…6) are referred to as partial regression coefficients to be estimated by the method of least square; and ei is a random error assumed to be normally distributed with expectation 0 and constant variance. MLR models are based on the assumptions: Linearity of relationship, homoscedasticity, no autocorrelation and the independence of predictors [13]. Prediction equation for the model (1) is estimated by least square method. The best fitting model is the one that minimizes the sum of squared residuals. The least square line for Y is given by,
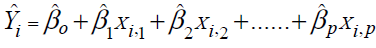 (2)
(2)
where the variables are same as defined in (1) except 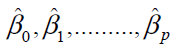 and
and  which are the estimated values of βj (j = 0,1,2…p) and Yi. The overall goodness of
fit of the regression model (i.e. whether the regression
model is at all helpful in predicting the values of Y) can
be evaluated using an F-test. Further, whether a particular
variable contributes significantly to the regression equation
can be tested through t -test.
which are the estimated values of βj (j = 0,1,2…p) and Yi. The overall goodness of
fit of the regression model (i.e. whether the regression
model is at all helpful in predicting the values of Y) can
be evaluated using an F-test. Further, whether a particular
variable contributes significantly to the regression equation
can be tested through t -test.
Logistic regression model to estimate the status of diabetic nephropathy
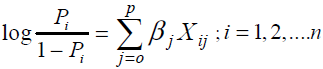
In this section, Logistic regression models have been used, to predict the status of diabetic nephropathy by a binary response variable with influence of predictors FBG, SBP, DBP, LDL, duration of the disease and age at which diabetes is diagnosed, i.e., to relate the independent variables, Xi1,………,Xip, to the dichotomous dependent variable Yi . The model is defined as follows:
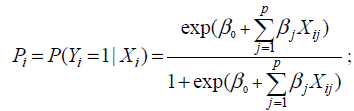 (3)
(3)
where, Pi denotes the probability of success for the ith patient, Xi = (Xi0,……,Xip),Xi0=1 and βj, βj are unknown coefficients [14]. The logistic transform of Pi or log odds are defined as follows:
 (4)
(4)
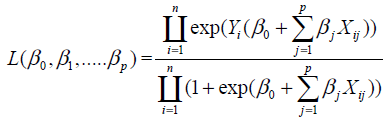
Because of the nature of the model estimation is based on the maximum likelihood principle rather than on the leastsquares principle as suggested by Cox. For estimating logistic regression coefficients βj’s, let Y1, Y2, ……Yn be the observations with dichotomous values on n patients. The likelihood function based on the binomial distribution, whenever Yi =1 and Yi =0 is defined as follows:
 (5)
(5)
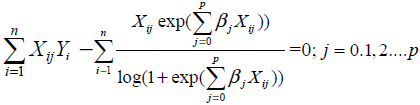
The maximum likelihood estimates of βj’s can be obtained from (5) by simultaneously solving the following p +1 equations.
 (6)
(6)
The maximum likelihood estimates of βj’s are obtained and denoted as  ( j = 0.1, 2........p) . Once the logistic
regression model (5) is fitted, the log likelihood test is
used to test the significance of coefficients βj. By defining H0 as ßj = 0, the test statistic is given by:
( j = 0.1, 2........p) . Once the logistic
regression model (5) is fitted, the log likelihood test is
used to test the significance of coefficients βj. By defining H0 as ßj = 0, the test statistic is given by:

When Ho is true, XL is asymptotically distributed as chisquare with 1 degree of freedom. Alternatively, Wald test can also be used to test the significance of the coefficients βi. In this case, by defining Ho as, βi = 0, test statistic Xw is defined as:
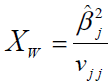
Where vjj denotes the jjth element of and Xw is distributed as chi square with one degree of freedom.
Results
According to pathological reports, the patients are divided into two groups: diabetic nephropathy (DN) group and non diabetic nephropathy (NDN) group. Out of 132 patients, 45.45% (60/132) with diabetic nephropathy and 54.55% (72/132) are found to be without diabetic nephropathy. The descriptive statistics are presented as mean ± SD. The demographic details: age at the time of diagnosis, duration of disease, FBG, DBP, SBP, LDL and SrCr are depicted in table 1. It can be observed from table 1 that patients with SrCr = 0.9982 ± 0.15084 mg/dl are in NDN group and the patients with SrCr = 1.6686 ± 0.28233 mg/dl are in DN group.

Table 1: Descriptive statistics of 132 patients giving minimum, maximum, range and mean± standard deviation of age at diagnosis, duration of diabetes, fasting blood glucose(FBG), systolic blood pressure(SBP), diastolic blood pressure( DBP), low density lipoprotein(LDL) and serum creatinine(SrCr) for two groups i.e. non diabetic nephropathy( NDN)/Group 0 and diabetic nephropathy(DN)/ Group1.
Models applied on mean record of each factor to assess the progression of diabetes
Regression models have been applied, to estimate the mean SrCr with independent predictors; mean of FBG, SBP, DBP, LDL, duration of diabetes and age at which diabetes was diagnosed for every patient. The response variable mean SrCr denoted by m(SrCr) and the predictors; mean of FBG, SBP, DBP, LDL, duration of diabetes and age at which diabetes was diagnosed are denoted by; m(LDL), Disease Dur and AgeDiag, respectively. Regression models is aimed to assess the progression of disease (starting from the date of diagnosis till the last available record till November 2007) based on the mean value of each factor with respect to each patient.
The MLR model used to estimate the progression of diabetes by estimating m(SrCr) by the predictors; m(FBG), , m(SBP) , m(DBP), m(LDL), Disease Dur and Age Diag is defined in model equation (7) , which is defined as follows:
+…….+β6(AgeDiag)i+ei;=1,2….132 (7)
The fitting of the model (7) is tested through R2, which came out to be 0.768. Thus about 77% of the variance of m(SrCr) can be explained by independent predictors. The fitted model is found to be statistically significant, F6,125 = 67.834, with p < .001. We have applied t - test to find the independent contribution of each predictor in estimating the value of serum creatinine to assess the progression of disease. The value of the regression coefficients for m(FBG), m(SBP), m(DBP) and Disease Dur give the size of the effect that variable is having on dependent variable, and the sign on the coefficient gives the direction of the effect. It has been found m(FBG), m(SBP), m(DBP) and DiseaseDur are significant contributors for estimating m(SrCr), as p < .05. The factors m(LDL) and AgeDiag are not significant factors for estimating m(SrCr).Thus, serum creatinine is significantly effected by hyperglycemia, blood pressure and duration of diabetes. Detailed results are given in Table 2. Fitted MLR model (7) on the basis of our data is given as follows:
m(SrCr) = -1.092+0.006m(FBG)+0.010m(DBP)+0.004m(SBP) + +0.001m(LDL) + 0.011(DiseaseDur)-0.003(AgeDiag) (8)

Table 2: Multiple linear regression model for estimating mean serum creatinine m(SrCr) on mean fasting blood glucosem( FBG), mean diastolic blood pressurem(DBP), mean systolic blood pressure m(SBP), mean low density lipoproteinm( LDL), duration of disease (Disease Durarion) and age at which diabetes was diagnosed(Age Diagnosis)
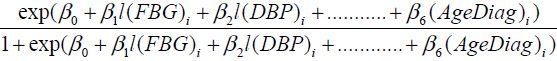
Then Logistic regression model has been applied by taking the response variable as the status of the disease depends on the mean serum creatinine value.P1, denotes the probability of diabetic nephropathy which is considered as success for the ith (i=1,2,….n) patient, depending on mean records of p predictors. In the present case, by applying logistic regression, the interest lies in deciding whether or not these predictors have the predictive efficiency of the model. The model is fitted by taking the predictors m(FBG), m(SBP), m(DBP), m(LDL), Disease Dur and AgeDiag to predict diabetic nephropathy on the basis of mean serum creatinine i.e., if m(SrCr) <1.4 mg/dl response variable takes the value 0 which means that the patient is under non diabetic nephropathy group and if m(SrCr) ≥ 1.4 mg/dl response variable takes the value 1 which means that the patient is under diabetic nephropathy group. Then the probability that response variable takes the value 1 with the given predictors is given as follows:
P( ithpatient is in DN group | all predictors) = 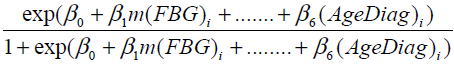 (9)
(9)
The above model (9) has overall predictive power of 88.5%, with sensitivity as 91.4% and specificity as 85%. The value of log likelihood function came out to be -38.7041. Wald z statistic shows that for estimating the probability of status of diabetic nephropathy the m(LDL) and Age Diag with p-values of 0.695 and 0.853, respectively, are non-significant, whereas the predictors; m(FBG), m(SBP), m(DBP) and DiseaseDur are significant with p< 0. 05. The detailed results are displayed in Table 3. Odd ratios (OR) are given in column 4 to assess the risk of diabetic nephropathy, in the presence of predictors. E.g. OR of m(FBG), is 1.07030, indicating that for each unit increase in m(FBG), the odds of DN increase by 0.07030, adjusting for other predictors; that is, regardless of whether other predictors are present or absent. In a similar way other OR corresponding to different predictors can be interpreted .The fitted logistic model (9) is given as follows:
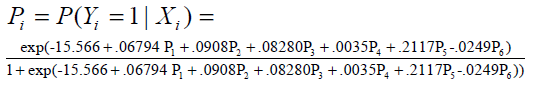

Table 3: Logistic regression model of status of diabetic nephropathy based on mean serum creatininem(SrCr) on mean fasting blood glucosem(FBG) , mean diastolic blood pressurem(DBP) , mean systolic blood pressurem( SBP) , mean low density lipoproteinm(LDL) , duration of disease (Disease Duration ) and age at which diabetes was diagnosed( AgeDiagnonis )
Where, P1 ,P2 ,P3 ,P4 ,P5 and P6 are defined predictors. The above results have been obtained by fitting MLR and logistic models, which are based on mean value of each variable, to study the progression of disease for all the patients under study. The findings of MLR and logistic model have been found to be similar. The logistic model proves that significance of high blood glucose and high blood pressure along with duration of diabetes are the main contributors of diabetic nephropathy. The findings of MLR model states that high blood glucose and high blood pressure along with duration of diabetes are significant factors for estimating SrCr among type -2 diabetic patients.
Models applied on last available record of each factor to assess the latest renal health
In this section regression models have been applied on the last available record of every variable corresponding to each patient to assess the latest renal health of type-2 diabetic patient. Therefore, the two groups are redefined on the basis of the last available record of the 132 patients under study. Firstly, the NDN group is defined whose last serum creatinine value is found to be less than 1.4 mg/dl. Secondly, the DN group is defined whose last serum creatinine value is found to be greater than or equal to1.4 mg/dl. Other information was obtained from their medical reports, including age when diabetes was diagnosed, duration of disease and last record on variables; FBG, DBP, SBP, LDL. Descriptive statistics of 132 patients giving minimum, maximum, mean and standard deviation based on last record of each factor are given in Table 4.

Table 4: Descriptive statistics of 132 patients giving minimum, maximum, mean and standard deviation based on last record of fasting blood glucose(FBG), diastolic blood pressure(DBP), systolic blood pressure(SBP), low density lipoprotein( LDL) and serum creatinine(SrCr) of two groups; L(SrCr)<1.4 (NDN) and L(SrCr)≥1.4 (DN)
The MLR model (1) is fitted to estimate the last SrCr with independent predictors; last available value of FBG, SBP, DBP, LDL, disease duration and age at which diabetes was diagnosed, for every patient. The response variable, last SrCr, is denoted by l(SrCr) and predictors, i.e., last available value of FBG, SBP, DBP, LDL, disease duration and age at which diabetes was diagnosed are denoted by l(FBG), l(SBP), l(DBP), l(LDL), Disease Dur and Age Diag, respectively. The model is aimed to assess the latest renal health based on the last value of each factor with respect to each patient. The MLR model used for the progression of diabetes in estimating latest renal health with last serum creatinine is defined as follows:
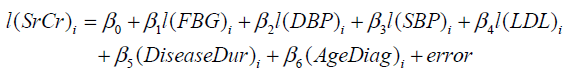 (10)
(10)
The fitting of the model (10) is tested through R2, which came out to be 0.671. Thus, about 67%of the variance of l(SrCr) can be explained by independent predictors. The fitted model is found to be statistically significant, F6,125 = 42.161 with p < .001. To assess the independent contribution of each predictor on serum creatinine indicating the latest renal health of the patient, we have applied t - test and found that l(FBG), l(SBP), l(DBP), l(LDL) and Disease Dur are significant for estimating l(SrCr), as p < .05 and the only predictor, AgeDiag is insignificant, as p = .450. The size of the regression coefficient e.g. for AgeDiag is 0.003, gives the size of the effect (not significant) that variable is having on dependent variable, and the sign ( negative) on the coefficient gives the direction of the effect. The detailed results are given in Table 5. Thus, Poor glycemic control, blood pressure, low density lipoprotein and long duration of diabetes are the risk factors for estimating latest renal health with serum creatinine. Fitted MLR model (10) of last record for each factor on the basis of the collected data is given as follows:
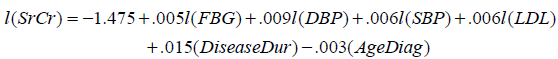 (11)
(11)

Table 5: Multiple linear regression model of last serum creatinine on last record of fasting blood glucose l(FBG) , diastolic blood pressure l(DBP) , systolic blood pressure l(SBP) , low density lipoprotein l(LDL) , duration of disease( DiseaseDuration ) and age at which diabetes was diagnosed ( AgeDiagnonis )
The logistic regression model is applied by taking the response variable as the status of the disease. Pi , denotes the probability of diabetic nephropathy based on last available record which is considered as success for the ith(i =1,2, …n) patient, depending on p predictors. We are taking the predictors l(FBG), l(SBP), l(DBP), l(LDL), Disease Dur and AgeDiag to predict probability of diabetic nephropathy on the basis of last serum creatinine i.e. if l(SrCr) <1.4 mg/dl, response variable takes the value 0 which means that the patient is under non diabetic nephropathy group and if l(SrCr) ≥ 1.4mg/dl response variable takes the value 1 which means that the patient is under diabetic nephropathy group. Then the probability that response variable takes the value 1 with the given predictors is given as follows:
P(ith patient has diabetic nephropathy | Xi )=
 (12)
(12)
The above model (12) has overall predictive power of 84.7%, with sensitivity as 85.9% and specificity as 83.3%. The value of log likelihood function came out to be – 42.117. For estimating the probability of status of diabetic nephropathy with the Wald z statistic, which is non-significant for AgeDiagnosis with p=0.819 , whereas the other factors; l(FBG), l(SBP), l(DBP), l(LDL) and DiseaseDur are significant with p < .05.
The detailed results are given in Table 6. Odd ratios are given in column 4 to assess the risk of diabetic nephropathy, in the presence of predictors. E.g. OR of DiseaseDur is 1.1433 indicating that, for each unit increase in DiseaseDur , the odds of DN increase by 0.1433, adjusting for other predictors; that is, regardless of whether other predictors are present or absent. In a similar way other OR corresponding to different predictors can be interpreted. Fitted logistic model (12) based on the last record of each factor on the collected data is given as follows:
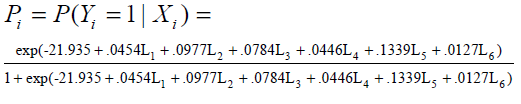

Table 6: Logistic regression model of status of renal disease based on the last record of fasting blood glucose l(FBG) , diastolic blood pressure l(DBP) , systolic blood pressure l(SBP) , low density lipoprotein l(LDL) , duration of disease( DiseaseDuration ) and age at which diabetes was diagnosed ( AgeDiagnonis )
The results are obtained by fitting MLR and logistic models, which are based on last value of each record, to study the latest renal health of diabetic patient. Findings from both the models are found to be similar, which proves that significance of high blood glucose, high blood pressure and low density lipoprotein along with duration of diabetes are the main contributors of obtaining the probability of diabetic nephropathy or high blood glucose, high blood pressure and low density lipoprotein along with duration of diabetes are significant factors for estimating last SrCr in type-2 diabetes.
Discussion
Nephropathy, a complication of type-2 DM, poses a serious problem in terms of financial load, morbidity and mortality in the developed world .The present study demonstrates nephropathy as an effect of progression of type- 2 diabetes estimated from serum creatinine, as recommended by the American Diabetes Association and the National Institutes of Health, stating that glomerular filtration rate (GFR), calculated from serum creatinine, at least once a year, for detection of renal dysfunction [15].
Regression models are used as they provide a powerful tool, allowing predictions about past, present or future events to be made with information about past or present events. Also, indicate the direction and strength of the relationship between the independent and dependent variables. The main objective in many biomedical studies is to understand and exploit the relationship between lifetime and covariates [16]. As blood sugar control, blood pressure control and low protein intake are generally recommended as the standard of care for diabetic nephropathy [17], we have applied regression models to exploit the relationship between serum creatinine/diabetic nephropathy and covariates; FBG, SBP, DBP, LDL, duration of diabetes and age at which diabetes was diagnosed.
The objective of applying regression models is (i) to assess the progression of diabetes, and (ii) to assess the latest renal health of type-2 diabetic patients. Firstly, MLR and logistic models are applied to estimate the mean value of serum creatinine (response variable) and to estimate the probability of DN based on mean value of serum creatinine with mean value of every predictor respectively. From both the models it has been found that FBG, SBP, DBP, duration of diabetes are significant predictors for estimating the progression of diabetes on renal heath. Secondly, MLR model is applied to estimate the last value of serum creatinine (response variable) and logistic regression is applied to estimate the probability of DN based on the last value of serum creatinine with last value of every predictor. Through both the models we conclude that FBG, SBP, DBP, LDL, duration of diabetes are significant factors for estimating the latest renal health of the patient.
The findings of this paper are consistent with the previous studies which suggest that hypertension is a major determinant of the progression of renal disease and the UKPDS showed that intensive control of blood glucose reduces the risk of DN in patients with type -2 diabetes [18, 19]. Also, controlled LDL cholesterol is associated with lower risk of end stage renal disease [20] and [21] study suggest that the incidence of diabetic nephropathy is related to the duration of diabetes.
References
- Viswanathan V. Prevention of diabetic nephropathy: A diabetologist’s perspective. Indian J Nephrol 2004; 14:157-162.
- Bojestig M, Arnqvist HJ , Hermansson G , Karlberg BE, Ludvigsson J. Declining incidence of nephropathy in insulin-dependent diabetes mellitus. N. Engl. J. Med. 1994; 330: 15–18.
- Gross JL, de Azevedo MJ, Silveiro SP, Canani LH, Caramori ML, Zelmanovitz T. Diabetic nephropathy: diagnosis, prevention, and treatment. Diabetes Care 2005; 28: 164-176.
- Mykkanen L, Haffner SM, Kuusisto J, Pyorala K, Laakso M. Microalbuminuria precedes the development of NIDDM. Diabetes 1994; 43: 552 –557.
- Adler AI, Stevens RJ, Manley SE, Bilous RW, Cull CA, Holman RR .Development and Progression of Nephropathy in Type 2 Diabetes: Observation and Modelling from the United Kingdom Prospective Diabetes Study. Kidney International 2003; 63:225-232.
- Molitch ME, DeFronzo RA, Franz MJ, Keane WF, Mogensen CE, Parving HH, Steffes MW. American Diabetes Association .Nephropathy in diabetes. Diabetes Care 2004; 27: S79-S83.
- Remmuzz G, Schipath A, Rugenetiti P. Nephropathy in patients with type 2 diabetes mellitus. New Eng J Med 2002; 346: 1145-51.
- Mazze, Strock, Simonson, Bergenstal: Staged -Diabetes Management, A Systematic Approach. 2nd edition, John Wiley& Sons 2005.
- Nelson RG, Knowler WC , Pettitt DJ, Hanson RL, Bennett PH. Incidence and determinants of elevated urinary albumin excretion in Pima Indians with NIDDM. Diabetes Care 1995; 18: 182–187.
- Onyechi M, Michael AM. Microalbuminuria and associated factors in Bahraini patients with type 2 diabetes mellitus. Annals of Saudi Medicine 2000; 20 (2): 157- 160.
- Kenzo KI, Takuko F, Keizo A , Masanori I, Kazuhiko K, Masaro O, Junko O, Takashi A , Mitsuo I, Kazuo T. Serum Vitamin C Levels in Type 2 Diabetic Nephropathy. Diabetes Care 2005; 28: 2808-2809.
- Spomenka L, Boris B, Zeljko M, Ivana PR. Renal Resistance Index in Type 2 Diabetes. Diabetologia Croatica 2006; 35(1): 7-13.
- Draper, Smith. Applied Regression Analysis, 3rd edition, John Wiley & Sons, New York 1998.
- Lee, ET and Wang, JW. Statistical Methods for Survival Data Analysis, third edition. John Wiley and Sons, New York 2003.
- Dabla, PK. Renal function in diabetic nephropathy. World. J. Diabetes 2010; 1(2): 48- 56.
- Lawless, JF. Statistical models and methods for Lifetime Data, Second edition, Wiley–Interscience, John Wiley and Sons, Inc. 2003.
- American Diabetes Association. Nephropathy in Diabetes. Diabetes Care 2004; 27: S79-S83.
- Rosansky SJ, Hoover DR, King L, Gibson J. The association of blood pressure levels and change in renal function in hypertensive and non-hypertensive subjects. Arch. Intern. Med. 1990; 150: 2073–2076.
- U.K. Prospective Diabetes Study (UKPDS), Group. Are Lower Fasting Plasma Glucose Levels at Diagnosis of Type 2 Diabetes Associated With Improved Outcomes? UKPDS 61, Diabetes Care 2002; 25(8): 1410- 1417.
- American Diabetes Association, Standards of Medical Care in Diabetes-2007. Diabetes Care 2007; 30 (suppl 1): S4–S41.
- Phillips CA, Molitch ME. The relationship between glucose control and the development and progression of diabetic nephropathy. Curr. Diab. Reports 2002; 2: 523-526.