ISSN: 0970-938X (Print) | 0976-1683 (Electronic)
Biomedical Research
An International Journal of Medical Sciences
Research Article - Biomedical Research (2016) Computational Life Sciences and Smarter Technological Advancement
FPGA based multi-level architecture for next generation DNA sequencing
“Next-generation DNA sequencing technology” has developed biomedical research, making genome and Protein sequencing an affordable and frequently used tool for a wide variety of research applications such as DNA Searching , DNA Sequencing, Drug Discovery, etc., objective of this work is to propose space and power efficient hardware architecture for micro sequence identification. Bloom filter, PCR, SRA, DFT and Phylogeny Aware are the recent related works for micro sequence identification. We propose an FPGA based multilevel sequence similarity identification to reduce the computational overhead, time and data complexity, GENIE, UNI, dbGap are the benchmarked database considered for the validation of the proposed method. Micro sequence identification uses a pattern mining technique. First this method generates number of patterns or sequences from the dimension 2 to the dimension N. The patterns are generated at each dimension and with varying size of dimension. The generated patterns are stored in the pattern set and for the input sequence which generates the similar set of pattern set. Based on generated pattern set, the proposed method computes the sequence similarity at each level and finally a cumulative similarity value is computed. Performance of the proposed method is compared with existing Bloom filter, PSR, SRA and DFT.
Keywords
Bioinformatics, Pattern matching, FPGA implementation, Micro sequence identification.
Introduction
Bioinformatics is a developing interdisciplinary area of Science and Technology about a systematic development and application of Information Technology solutions to handle biological information by addressing biological data, warehousing, data mining, database searches, analyses and interpretation [1]. Bioinformatics is the computational research of biological data, consisting of information stored in the form of DNA and protein sequences in various biological databases. NCBI defines bioinformatics as: “Bioinformatics is the field of science in which biology, computer science and information technology merges into a single discipline [2,3]. There are Some important sub- disciplines within bioinformatics: the development of new algorithms and statistics which assess relationships among members of large data sets [4], the analysis and interpretation of various types of data including nucleotide and amino acid sequences, protein domains, and protein structures; and the development and implementation of tools that enable efficient access and management of different types of information”.
Bioinformatics is defined broadly as the study of the inherent structure of biological information. It is the amalgamation of two major disciplines such as biological and computational sciences. Recently, bioinformatics has become indispensable to biological scientists and current bioinformatics research include the analysis of gene [5,6] and protein sequences to reveal protein evaluation and alternative splicing, the development of computational approaches to study and predict protein structure to further understanding of function [7], the analysis of mass spectrometry data to understand the connection between phosphorylation and cancer, the development of computational methods to utilize expression data to reverse engineer gene networks in order to more completely model cellular biology, and the study of population genetics and its connection to human disease.
People with similar sequence of DNA species have similar habits and other features. So in order to classify a person according to his habits or based on some other factor, the DNA sequences could be used. Similarly the classification of DNA sequence could be used to perform various activities. Not only could this but the protein sequence be used by different organization in identifying the exact food type based on the result of protein classification. However identifying such similar sequences is quite challenging task and to perform such task will take more time.
This paper works over the FPGA implementation and how the efficiency of FPGA can be adapted to the problem of bioinformatics problems. We focus on the micro sequence identification of DNA sequences and Amino Acid Sequences. Regarding the problem of sequence identification, the pattern matching solution can be adapted and capable of producing efficient results. The pattern matching is the process of identifying the presence of similar sequence in the DNA sequence or Amino acid sequence. For example, the amino acids can be classified into three groups namely Alpha A, Beta B and Gamma G. The Alpha group covers the acids namely G, H, I and the Beta group covers the acids namely B and E. The gamma group covers the remaining acids from the acid sequence.
Micro sequence identification is to identify the sequence matching in different level for example from two set sequence to the maximum size. The acid sequence may match at different number of levels and based on the matching in different sequence levels the similar sequence can be identified and used for classification. Such multi-level sequence identification can be used for DNA classification and for other bioinformatics solutions.
Related Works
There are number of methods has been described earlier for the problem of sequence identification and we discuss some of the method here in this section.
FPGA based Agrep for DNA Microarray Sequence Searching [8,9], utilizes the capability of FPGA to parallelize such processes and introduces a hardware-based implementation of Agrep, a fast text searching algorithm capable to allow approximate matches. The design was implemented in Opal Kelly® XEM3010 and was tested using DNA microarray sequences from the NCBI virus probe database. Results indicate significant improvement in performance in terms of runtime and throughput as compared to a software-based Agrep [9,10].
Low Power Bloom Filter Architectures Using Multi Stage Lookup Techniques [8], introduce a low power Bloom filter architecture, which is space and power effective in hardware platforms. Instead of working on programming phase or technology, This work concentrates on lookup techniques of Bloom filters [6,11]. In this paper, they propose a new multistage lookup technique for Bloom filters and the theoretical power analysis of the proposed lookup techniques was presented. Power analysis shows that a decrease in the number of hash functions per stage results in power gain [12].
Rapid identification of multi-strain HBV infection in patient by high-throughput DNA sequencing [11], describe a method based on Selective Region Amplification (SRA) [12] of viral genome and deep sequencing, which may be used for rapid identification of multi-strain Hepatitis B Virus (HBV) infection in patients. The method works even with significantly low amounts of patients’ serum samples, where the wet-lab procedures take about 1.5 days, followed by a quick bioinformatics analysis to reveal the final results. This method can potentially be applied to the rapid and reliable identification of multi-strain HBV infection and help improve treatment regiments.
In Molecular detection of Leishmania DNA and identification of blood meals in wild caught Phlebotomine Sand Flies (PCR) [13], the anthropophagic behaviour of S. minuta together with the detection of Leishmania DNA highlights the need to determine the role played by this species in the transmission of Leishmania parasites to humans. In addition, on-going surveillance on Leishmania vectors is crucial as the increased migration and travelling flow elevate the risk of introduction and spread of infections by Leishmania species which are nonendemic.
Prediction of protein coding regions in DNA sequences using signal processing methods [9], investigate the location of exons in DNA strand using directly the DFT approach. By using this method, background noise in the period-3 DNA spectrum has been present. In order to eliminate this noise and for improve the quality of detection, they used an efficient algorithm based on notch filter [14]. Simulation results represent that by using this simple algorithm, the exon location in DNA sequence can be detected as well as possible and the background noise is removes. In this paper, we have also developed a useful user friendly package to analyse DNA sequences.
All the above discussed methods have the problem of time complexity and power overhead in the sequence identification.
Proposed Method
Micro sequence identification using pattern mining (MSI-PM)
The micro sequence identification approach reads the input sequence and for each class of amino acid sequence, the method generates number of pattern from 2 to N, where N is the size of sequence. For each class according to the patterns being generated, the method computes the Multi-Level Sequence Similarity Measure (MLSSM) which represents how far the input sequence is close to the sequences belongs to the different classes. The entire process can be split into number stages namely Multi Level Pattern Generation, Multi Level sequence similarity measure computation, Sequence Identification.
The Figure 1 shows the architecture of multi-level micro sequence identification and shows the components of the proposed approach.

Figure 1: Architecture of multi-level micro sequence identification.
Multi-level pattern generations
The multi-level pattern is the combination of different pattern for different dimension. For given DNA sequence or Amino acid sequence with dimension D, the method generates N number of Dn dimensional sequence from 2 to D. For each class of DNA sequence, the method generates number of different sequence pattern at different levels. The pattern is generated from different dimension and generated pattern will be used to compute the sequence similarity measure.
Pseudo Code of MLP Generation:
Input: DNA Sequence Ds
Output: Pattern Set Ps.
Start
Compute the size of sequence ss.
Ss = ∫size (Ds)
For each dimension Di from SS
Generate Pattern Pi.
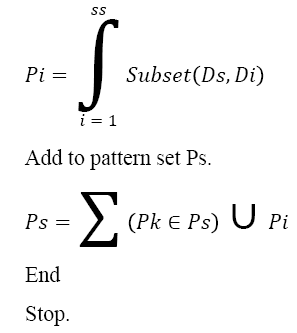
The above discussed algorithm generates the multi-level pattern set from given DNA sequence and generated sequence will be used to compute the sequence similarity measure. For example, from the given Amino Acid sequence “MEKLLDEVLAPGGPYNLTVGSWVRDHVRSIVEGAWEVR”, the pattern generation approach can generate the following patterns as follows:
According to the representation and the class of amino acids the input sequence is represented as follows:
“CBCCCBCCCCAACCCCCCACCCCCACCACCBCC”.
The Table 2 shows the example pattern being generated by the proposed algorithm.
The Table 1 and Table 2, shows the set of patterns being identified from the starting position and similarly the patterns can be generated from the remaining dimensions which produce enormous number of patterns. The method generates such patterns and will be used to compute the sequence similarity measure.
| CB | CC | CCC | CCCC | CBCCCB | CCAACCCC | CCACCACCBCC | CCCCACCCCCACCA |
| CC | CC | CCC | ACCC | CCCCAA | CCACCCCC | CBCCCBCCCCAA | CBCCCBCCCCAACCC |
| BC | AC | ACC | CACC | CCCCCC | ACCACCBC | CCCCCCACCCCC | CCCACCCCCACCACC |
| CC | CA | CCA | ACCB | ACCCCC | CBCCCBCCC | CBCCCBCCCCAA | CBCCCBCCCCAACCCC |
| CC | CC | CCA | ACCACC | CAACCCCCC | CCCCCCACCCCC | CCACCCCCACCACCBC | |
| AA | BC | CCB | CBCCC | CBCCCBC | ACCCCCACC | CBCCCBCCCCAA | CBCCCBCCCCAACCCCC |
| CC | CBC | BCC | BCCCC | CCCAACC | ACCCCCCACCC | CCCCCCACCCCC | CBCCCBCCCCAACCCCCC |
| CC | CCB | CBCC | AACCC | CCCCACC | CBCCCBCCCC | CBCCCBCCCCAAC | CBCCCBCCCCAACCCCCCA |
Table 1. Example pattern generated.
| CBCCCBCCCCAACCCCCCACCCC |
| CBCCCBCCCCAACCCCCCACCCCC |
| CBCCCBCCCCAACCCCCCACCCCCA |
| CBCCCBCCCCAACCCCCCACCCCCAC |
| CBCCCBCCCCAACCCCCCACCCCCACC |
| CBCCCBCCCCAACCCCCCACCCCCACCA |
| CBCCCBCCCCAACCCCCCACCCCCACCAC |
| CBCCCBCCCCAACCCCCCACCCCCACCACC |
| CBCCCBCCCCAACCCCCCACCCCCACCACCBCC |
Table 2. Example pattern generated.
Multi-level sequence similarity measure
The multi-level sequence similarity measure shows the similarity of the sequences at different levels and the number of levels is depending on the dimension of the sequence. For each level using the pattern set being generated, the method computes the sequence similarity measure. For each dimension the method computes the similarity measure and then finally the method computes the multi-level similarity measure which will be used to identify the sequence.
Sequence identification
At this stage, the method generates the sequence set for the given sequence and based on the pattern set being generated the method computes the multi-level sequence similarity. For each level of the DNA sequence, the method computes the sequence similarity and finally the method computes the cumulative sequence similarity measure. For each class the method maintains different sequence and the method computes multi-level sequence similarity for each class. Based on the sequence similarity measure the method selects a single class and identifies the most sequence similar.
Pseudo Code of Sequence Identification:
Input: DNA sequence Ds, Pattern Set Ps
Output: Sequence S.
Start
Pattern set Dps = Multi level pattern generation (Ds).
For each class Ci
For each Level l
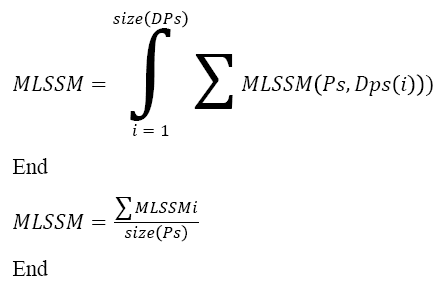
Compute MLSSM.
Choose the class with maximum MLSSM.
Choose the sequence with maximum MLSSM.
Stop
The above discussed algorithm computes the multi-level sequence similarity measure and selects the class and sequence with maximum sequence similarity measure.
Results and Discussion
The proposed multi-level micro sequence has been implemented and evaluated for its efficiency using the model simulator and has been evaluated using the FPGA test bench. The method has been validated for its efficiency using various DNA sequence and amino acid sequence. The efficiency of the method has been validated by computing the sequence detection accuracy and the time complexity produced.
The Table 3 shows the details of data set being used to evaluate the performance of the proposed approach. The method has been validated for its efficiency using different data sets and the method has been validated for its efficiency in sequence identification and its time complexity.
| Data set | size |
|---|---|
| GENIE | 793 |
| UCI | 2500 |
| dbGap | 4300 |
Table 3. Details of data set used.
The Figure 2 shows the comparison of sequence identification efficiency produced by different methods and it shows that the proposed method has produces higher efficiency than other methods.

Figure 2: Comparison of sequence identification efficiency
The Figure 3 shows the comparison of time complexity produced by different methods in identifying the sequence and the result shows that the proposed method has produced less time complexity than other methods.

Figure 3: Comparison of time complexity.
The Figure 4 shows the comparison of space occupied by the different methods and it shows that the proposed method has produced less space complexity than other methods.

Figure 4: Comparison of space complexity.
Conclusion
DNA Sequencing is an area where improving the performance of string matching has great significance. In this paper, we have improved the efficiency, time and space of Micro sequence identification by using a hardware software co-design approach. In addition, we compare proposed method with Bloom filter, PCR, SRA, DFT and Phylogeny Aware. As FPGA-based designs exhibit high performance for parallel computing and fine-grained pipelining, we can expect obvious performance improvements of other applications in Bioinformatics. According to the results we could conclude that hardware software co-design implementation could obtain a maximum of 15 times boost in space complexity with SRA, 15 times boost in time complexity compared to Bloom filter.
References
- Christopher MA, Thomas KFW, Lam TW, Hon WK, Sadakane K, Yiu SM. An efficient alignment algorithm for searching simple pseudoknots over long genomic sequence. Ieee/Acm Trans ComputBiolBioinform 2012; 9.
- Che S, Boyer M, Meng J, Tarjan D, Sheaffer JW, Lee SH, Skadron K. Rodinia-A benchmark suite for heterogeneous computing. IeeeParalDistrProc 2009.
- Euripides S, Christos K, Apostolos D. Some initial results on hardware BLAST acceleration with a reconfigurable architecture. Ieee 2006.
- Grigorios C, Agathokl P, Geore P. Opportunities from the use of FPGAS as platforms for bioinformatics algorithms. BioinformBioeng 2012.
- Alachiotis N, Berger SA, Stamatakis A. Accelerating phylogeny-aware short DNA read alignment with FPGAs. Field Program Cust Comp Mach 2011.
- Gabriel FV, Mark OLO, Mary GCDJ, Emilyn BE. FPGA based Agrep for DNA microarray sequence searching. Conf Comp EngApplIacsit 2011; 2.
- Arun M, Krishnan A. Functional verification of signature detect ion architectures for high speed network applications. Int J Autom Comp Spr 2011; 9: 395-402.
- Arun M, Krishnan A. Low power bloom filter architectures using multi stage lookup techniques. Austr J ElecElectrEng 2011; 8: 1-10.
- Carla M, Ricardo P, Jose MC, Ferdinando BF, Maria OA, Lenea C. Molecular detection of Leishmania DNA and identification of blood meals in wild caught phlebotomine sand flies (Diptera: Psychodidae) from southern Portugal. Sprparactvect 2015; 8.
- Tan L, Sherwood T. A high throughput string matching architecture for intrusion detect ion and prevention. Comp Arch 2005.
- Pall M, Jonathan KP. Efficient counting of k -mers in DNA sequences using a bloom filter. BmcBioinform 2011; 12: 333.
- Timothy O, Bertil S, Douglas M. Hyper customized processors for bio-sequence database scanning on FPGAs. Monterey CA 2005.
- Yongchang Z, Masood R, Ting FZ. Rapid identification of multi-strain HBV infection in patient by high-throughput DNA sequencing. Spr Quant Biol 2015; 3: 103-106.
- Hamidreza S, Tabriz I, Mousa S, Mohammad HS, Faegheh G. Prediction of protein coding regions in DNA sequences using signal processing methods. Indust Elect Appl 2012.