ISSN: 0970-938X (Print) | 0976-1683 (Electronic)
Biomedical Research
An International Journal of Medical Sciences
Research Article - Biomedical Research (2018) Computational Life Sciences and Smarter Technological Advancement: Edition: II
Diagnosis of heart disease with particle bee-neural network
S Silvia Priscila* and M Hemalatha
Bharathiar University, Coimbatore, Tamil Nadu, India
Accepted date: February 01, 2017
DOI: 10.4066/biomedicalresearch.29-16-2322
Visit for more related articles at Biomedical ResearchAutomatic detection and classification of different types of arrhythmias by analyzing the ECG signal is essential for diagnosis of cardiac defects. Thus the focus of this paper is to propose an efficient classifier to classify the ECG signal into different arrhythmias such as Normal, VE, VF, LBBB and APB to support in diagnosis. Initially Histogram features are extracted from RR interval, PT interval, PR interval, TT interval, ST interval, QT interval of the ECG signal. Then the Real Coded Genetic Algorithm (RCGA) is applied to identify the optimal feature set from the extracted histogram features. After that the Multilayer feed forward neural network (MFFNN) evolved using Particle Bee approach. The performance of the proposed RCGA-PBNN has been evaluated in terms of classification accuracy, sensitivity and specificity using the MIT-BIH arrhythmias ECG Database.
Keywords
ECG, Classification, Arrhythmias, Histogram features, RCGA, MFNN, Particle swarm optimization, Artificial bee colony optimization
Introduction
Cardiac arrhythmia is one of the important heart disease which lead to human death. The disease is a group of unconditional electrical activities in which the heart beats are varied from fast, slow and irregular heart-beats [1]. These unconditional heartbeats create several effects in the human body like, the heart can not to be pump blood effectively, damage of the brain function. Sometimes, it has no symptoms at all but when it has cardiac problem, it has serious problems like, passing out, shortness of the breath, chest pain which leads to arrest the cardiac [2]. Then the cardiac arrest will be monitored with the help of the Electrocardiogram (ECG) because it measures the complete electrical activities of the human heart by placing the electrodes on the chest [3].
The ECG measures the single electrical change present in the heartbeat during the cardiac cycle recording process. The recording process monitored the electrical activity in twelve different angles, so it captures all the details and characters of the heartbeat [4]. The characteristics of the ECG are used to analyze the different types of arrhythmias like, Premature Beats, Supraventricular Arrhythmias, Atrial Fibrillation, Atrial Flutter, Ventricular Arrhythmias and Brady arrhythmias [5]. These Arrhythmias are mainly identified by the QRS complex waveform. So, the ECG signal analysis QRS waveform using several approaches. During the ECG analysis, processing, the manual approach needs longer time for analyzing and it requires experts to make the decision regarding the cardiac arrhythmias [6].
In addition the ECG analysis difficult in the minimum set-up so, the automatic classification approaches are used to analyze the ECG characteristics and the behavior of the heart-beat which is used in the emergency case and the immediate action is to be taken at the time. Then the captured ECG is analyzing includes the QRS wave detection process [7], feature extraction, feature selection and the disease classification stages. These stages use the several methods such as Hidden Markov Model (HMM), Wavelet Transform (WT), Hermite Function (HF), Support Vector Machine (SVM), Neural Networks (NN) [8].
In this paper the automatic cardiac arrhythmias detection and classification is performed by using the MIT-BIH arrhythmias ECG database. The recorded ECG is preprocessed to remove the unwanted noise and the histogram features are extracted in different waveform intervals. Then the optimal features are selected by applying the hybrid feature selection method and the selected features are classified by using the hybrid optimized method based Neural Networks. The performance evaluation is made with the several existing methods such as Particle swarm optimization, Genetic Algorithm. The rest of the paper is organized as follows: Section 2 provides the related discussion and researches about the cardiac arrhythmias analysis methods, section 4 explains that the proposed methodology-methods and discussions, section 5 discuss the experimental results of the proposed system and finally, conclusion.
Related Works
This section discusses that the various discussions about the cardiac disease because it is one of the leading death disease. Zhu et al. [9] proposed a new system that used to integrate the mobile system with the capturing ECG recording system. The integrated system used to monitor the patient activities with the help of the Crowdsourcing method. Thus the system ensures the patient activities in 24 × 7 time period, which reduces the difficulties during the emergency time. Sherbakova et al. [10] proposed a method based on the electrocardiosignal for analyzing the condition of the human heart. The analyzed heart condition is transmitted via the wireless electrocardiosignal transfer system which is used during the emergency condition. Jeen-Shing Wang et al. [11] classifies the ECG heartbeats into eight different classes using the efficient feature reduction and classification method. The captured ECG signal consists of 200 samplings from the samplings the R peak value is extracted and the best optimized features are selected by applying the Principal Component Analysis and the Linear Discriminate Analysis method. Then the ECG is classified by using the Probabilistic Neural Networks (PNN) and the performance is evaluated with performance metrics which gives the efficient classification accuracy.
Eduardo et al. [12] uses the graph based pattern classifier such as optimal path forest classifier method to detect the cardiac Arrhythmia. The classification is performed on the MIT BIH arrhythmia database using the preprocessing, segmentation, feature extraction and classification steps. The extracted ECG features are classified into cardiac and normal heart beat using the Optimal path forest classifier and then the comparison is made with three different classifiers, namely support vector machine, multilayer neural networks and Bayesian classifier. Thus the performance of the proposed system ensures the better classification accuracy. Rameshwari et al. [13] detecting and classifying different cardiac arrhythmia diseases such as premature ventricular contracture, left bundle branch block and right bundle branch block cardiac by extracting the various features from the vital intervals. The simulation system is implemented in the Python 2.6 simulation tool for identifying the various cardiac diseases. Then the proposed system is implemented by using the MIT BIH-arrhythmia database and the performance is evaluated using the classification accuracy.
Sarkaleh et al. [14] two types of cardiac arrhythmias diseases are classified by applying the ECG recording, feature extraction and classification steps. The significant features are extracted from the recorded ECG by applying the discrete wavelet transformation and the classification is performed by using the Multilayer neural network (MLP). The performance of the system is evaluated by using the MIT- BIH cardiac arrhythmia database which gives the efficient classification accuracy than compared to other existing methods. Alonso- Atienza et al. [15] cardiac arrhythmia diseases are classified by using the efficient feature selection and classification methods. The different temporal, spectral and complex features are extracted from the ECG recordings and the 13 different optimum features are extracted by applying the filter type feature selection method. Then the performance of the proposed system is evaluated by using the sensitivity and specificity performance metrics. This paper uses the hybrid feature selection and the hybrid classification method for detecting the different cardiac arrhythmia diseases in recorded ECG. The following section describes that the detail description about the proposed system.
Proposed Methodology
In this paper the Cardiac Arrhythmia disease is classified by applying the hybrid classification techniques. The proposed system uses the MIH-BIT Cardiac Arrhythmia database for detecting and classifying the cardiac disease. The cardiac diseases are identified by using the following phases such as, preprocessing, feature extraction, feature selection and classification which are used during the emergency case. The proposed system block diagram is shown in following Figure 1.

Figure 1: Proposed system block diagram.
The above Figure 1 describes that the proposed system uses the Multilayer feed forward neural network and Particle Bee approach for classifying the cardiac arrhythmia disease from the ECG. The recorded ECG has some of the baseline wandering noise which has been removed by applying the morphology filtering. Then the histogram features are extracted from the different ECG intervals such as RR interval, PT interval, PR interval, TT interval, ST interval, QT interval. The extracted features are reduced and the optimal features are selected by Real Code Genetic Algorithm. Finally the selected features are fed into the Multilayer Feed Forward Neural Network which classifies the cardiac arrhythmia diseases into the Ventricular Escape (VE), Ventricular Flutter (VF), Left Bundle Branch Block (LBBB) and Atrial Premature beat(APB). The classification is performed by a Particle Bee approach based training data which improves the classification accuracy.
Preprocessing
The baseline wandering noise has been removed by using the morphology filter [16] because it removes the baseline drift and high frequency noise from the original ECG signal with effective manner. The ECG signal has 0.5 Hz less than baseline wandering and 50-60 Hz AC interferences which has been removed by applying the morphology filter as follows,

Where f0 is the original ECG signal with noise components
fbc is ECG signal without having the baseline drift
B0.Bc is structural elements presents in the ECG.
After removing the baseline drifts, the high frequency components are removed as follows,
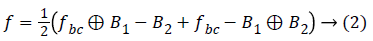
Where, B1,B2 is the structural elements and the f is the removed frequency.
The above process removes the unwanted frequency and baseline and filter the ECG with the cut off frequency range 0.5 to 50 Hz which is used in further detection processing.
Feature extraction
The next important step is feature extraction which reduces the pattern vector dimensionality from the original ECG signal. In the proposed system different type of features such as temporal, statistical and morphology features [17] are extracted from the RR interval, PT interval, PR interval, TT interval, ST interval, QT interval of the ECG signal which is described as follows,
Temporal features: The ECG signal consists of two different temporal features, namely heart rate and the interval between the features. Initially the RR interval features have been calculated which the interval between the two successive heartbeats is. From the RR interval pre-RR interval, post RRinterval, average RR interval local average RR interval and mean RR interval is calculated. Then the heartbeat is estimated as follows,
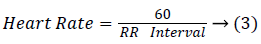
Similarly the remaining temporal features are calculated, TT interval is the time difference between the given heartbeat and the previous heartbeat, PT interval is the time difference between the Toffset given heartbeat and the previous Toffset heartbeat.
Morphological features: The Morphological features give the details about the ECG signal coefficient in the time domain which is calculated as follows,
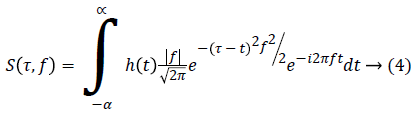
S(τ,f) is the ST interval feature based on the given ECG signal. h(t) is the windowing function which may be the Gaussian function.
After extracting the ST interval feature the statistical features such as mean, variance, standard deviation features are extracted for detecting the cardiac arrhythmia diseases. Thus the numerous number of features is extracted from the baseline wandering removed ECG signal.
Feature selection
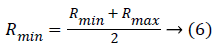
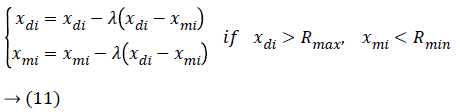
The next step is feature selection in which the dimensionality of the feature has been reduced by using the Real Coded Genetic Algorithm (RCGA) [18]. The selected optimal features are used to classify the cardiac arrhythmia disease in an effective manner. The Real Coded Genetic Algorithm selects the features in the most efficient way by considering the chromosome as the real number which is organized as a structure during the feature selection process. During the selection process, the higher level features are considered as the control genes and the lower level features are parameter genes which are used to identify whether the feature is active or inactive the feature. The control and parameter genes are coded into the real number with the range of the (Rmin,Rmax) where,
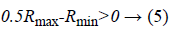
After choosing the real code value of the control and parameter genes the threshold value has been determined to stop the operations in the feature selection process. When the selected feature value is maximum then the Rmid value then the feature considered as the active state else inactive state. Rmid is calculated as follows,
After selecting those initial parameters, the parameters considered as the chromosome which is considered as the initial population and each represented as the real numbers. Then the fitness function has been chosen for further mutation and crossover operations.
The fitness value is defined s follows,
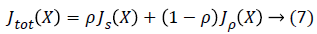
Where Js is the normalized structure index and Jp is the normalized performance index whose value belongs to the [0,1].
Then the feature searching algorithm is calculated by using the below fitness function which is one the linear equation.
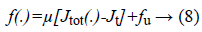
Where,
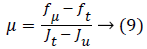
Jt and Ju is the largest and smallest value of the features. fμ and ft is the minimum and maximum value of the fitness function. Based on the values the best chromosomes or feature values have been selected in the selection process.
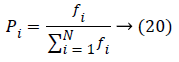
In the selection process, the optimal initial feature has been selected based on the fitness function probability value that is used to produce the best off-string feature in the next generation process. The probability value is defined as follows,
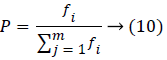
Where fi is the fitness value of the ith member and m population.
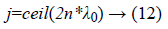
After selecting the particular chromosomes, the crossover operation has been taking place for combining the two different chromosomes in a particular place. The chromosome crossover operation is done with the help of the crossover probability which is usually in the range of 0.5 ≤ pc ≤ 0.9. Then the crossover operation is determined as follows,
The above cross over operation is performed in the crossover point which is defined as follows,
Finally the mutation operation has been performed for producing the individuals which is varied from the mutation probability 0<pm<1. Then the mutation operation should be performed as follows,
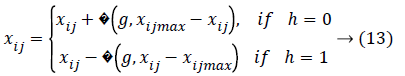
This operation evaluated each features presents in the control gene and parameter gene and identify the optimal features based on the probability, min and max value which is repeated until to reach the termination condition. The optimum feature has been chosen based on the maximum fitness value. The selected features are used to classify the different type of the cardiac arrhythmia disease.
Classification
The last stage is Cardiac Arrhythmia classification which is performed with the help of the Multilayer Feed Forward Neural Network (MFFNN) [19] trained by Particle Bee approach. The neural network consists of three different layers, namely input layer, hidden layer and output layer. In this paper the neural network is trained and optimized by using the Particle Bee approach because the normal neural network produce error while train the input vector which reduces the accuracy when cardiac classification. So, the optimization algorithm used to optimize the structure and weight of the neural network for getting the efficient classification result.
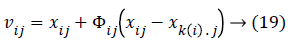
Representation of multilayer feed forward neural networks: The selected features are fed into the MFFNN network because it does not need the prior probability information. Each layer presents in the network have weights (ω) and bias (b) value which is used during the feature training and output calculation. The output of the each neuron is calculated as follows,
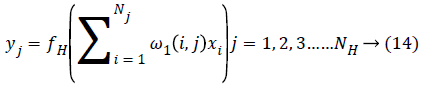
Where xi is input variable, yj is output of the each neuron in the hidden layer, fH is activation function used in the neural network and ω1 is weight presents in the neuron.
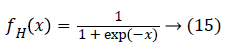
In the hidden layer the sigmoid function is used as the activation function as defined as follows,
And the final output is calculated as follows,
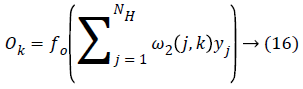
Where f0 is the activation function of the output layer and the performance of the system is evaluated using the mean square error value which is depends on the weights and bias adjustment value. Based on the value the features are classified into the different cardiac arrhythamia.
MFFNN Training using particle bee approach: Each input presents in the MFFNN network have particular weight and bias which is trained and updated by using the particle bee approach [20], for reducing the error during the classification. Initially, each vector position, velocity is defined as follows,

Where i is the feature (particle) index, Np-total number of particle, f is the fitness function and P is the position of the particle, Vis velocity of the particle.
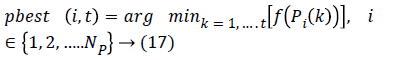
Based on the position and velocity the feature weights are chosen to reduce the error rate and the particle position, velocity is updated using the Bee approach method which means it selecting the optimal solution using the probability fitness function as defined as,
k(i) is the best selected weight, which is having the random number from [-1, 1]
Based on the above equation 10 and 11 the new weights and bias values are chosen and update their position and velocity as follows,
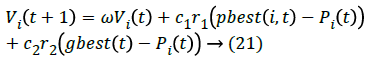

The weights and bias updating process repeated until to reach its maximum termination condition which means it has to be selected the optimized near weight and bias values.
Experimental Results
In the proposed system MIT-BIH arrhythmia database [21] is used to classify the cardiac arrhythmia disease. The database consists of 250 recordings which are collected from the outpatient and inner patient for analyzing the various cardiac diseases. The recordings are performed 30 minutes and which comprises of 109,000 beat labels. These records involves 23 of NSR (Normal Sinus Rhythm) itemized from 100 to 124 and the other 25 of cardiac abnormalities itemized from 200 to 234. The performance of the proposed system is evaluated in terms of the accuracy, sensitivity and specificity.
Performance metrics
Sensitivity: Sensitivity [22] is also called as the true positive rate, which is used to measure how the proposed system correctly classify the true positive.
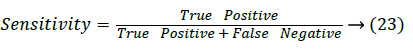
Where True positive is successfully or correctly identified value and the False Negative is successfully rejected value.
Specificity: Specificity [23] is also called as the true negative rate, which is used to measure how the proposed system correctly classify the false values.

Where True negative is successfully or correctly rejected value and False positive is successfully rejected value.
Classification: Classification accuracy [24] is the measure which is used to estimate how the proposed system successfully classified the number of heart beats in the correct manner which is determined as follows,
Performance analysis
The performance of the proposed system is compared with the existing methods such as particle swarm optimization [25], Genetic Algorithm [26] and the proposed feature selection method. The feature selection process improves the cardiac arrhythmia detection process and the following Figure 2 shows that how the proposed feature selection approach selects the feature from the different type of heartbeats.

Figure 2: Performance of various feature selection methods.
Figure 2 clearly explains that the proposed Real Coded Genetic Algorithm (RCGA) feature selection method selects the optimized features and minimize the dimensionality of the feature set than compared to the existing method because the proposed system select the features based on the selection, crossover and mutation which is done with other selection method. This combined feature selection method selects the optimal features with minimum error rate [27]. Then the feature selection methods Mean square error analyzes is shown in following Figure 3 that helps to identify how the proposed system exactly selects the optimized features from the huge amount of feature set.

Figure 3: Error value of the various feature selection methods.
The above Figure 3 explains that the proposed selection method has the minimum mean square error which means it correctly identify and select the optimized features of the set of population and the sensitivity, specificity of the proposed system is discussed as follows with respect to the different type of heartbeats. The proposed system ensures the 97.56% sensitivities overall, while the other classification methods such as Multi-Layer Feed Forward Network (MFNN), SVM attains the 95.32%, 93.64% which is shown in the Figure 4. Thus the proposed system classifies the cardiac arrhythmia diseases in an efficient manner when compared to the existing methods such as Multi-Layer Feed Forward Neural Network (MFNN) and the Support Vector Machine (SVM) [28]. In addition, the proposed system overcomes the existing classification system problem like error rate during the classification and the maximum number of features.

Figure 4: Sensitivity of different classes.
Figure 5 shows the specificity of different classification techniques with respect to different types of heart beats. The proposed approach PBNN attains 97.63% sensitivity overall, while the MFNN, SVM attains 94.362% and 93.126%.

Figure 5: Specificity of different classes.
Figure 6 shows the accuracy of different classification techniques with respect to different types of heart beats. The proposed approach PBNN attains 98.62% sensitivity overall, while the MFNN, SVM attains 95.6%, 93.37%.

Figure 6: Accuracy of different classes.
The dimensionality of the feature reduced by the optimal feature selection method and the reduced features is trained with the help of the optimized neural network which reduces the mean error rate during the classification [29]. So, the proposed system classifies the cardiac arrhythmia diseases with highest accuracy 98.62% with minimum error rate.
Conclusion
This paper proposes an effective approach RCGA and PBNN for classifying the different type of arrhythmia diseases based on the selected ECG features. Initially the ECG signal is preprocessed by using the Morphological Filter which removes the unwanted baseline wanders. Then the temporal, statistical and morphological features are extracted from the preprocessed ECG with different intervals like RR interval, TT interval, PR interval. The dimensionality of the features is reduced by using the Real Coded Genetic Algorithm and the selected features are classified by applying the proposed PBNN network. The PBNN classifier is used to classify the different type of arrhythmias like Normal N, LBBB, APB, VE and VF. The classifier ensures the highest classification accuracy because the network error value is optimized via the particle bee approach. The performance of the proposed system is evaluated with the help of the experimental results and discussions.
References
- Rawther NN, Cheriyan J. Detection and classification of cardiac arrhythmias based on ECG and PCG using temporal and wavelet features. In J Adv Res Comput Commun Eng 2015.
- Bera R, Narayanan B. Cardiac arrhythmia detection using dynamic time warping of ECG beats in e-healthcare systems. IEEE International Symposium World Wireless Mobile Multimedia Networks (WoWMoM) 2011.
- Jadhav SM, Nalbalwar SL, GhatolA. Artificial neural network based cardiac arrhythmia classification using ECG signal data. International Conference Electronics Information Engineering (ICEIE) IEEE 2010.
- Obeid D, Zaharia G, Sadek S, El Zein G. ECG vs. single-antenna system for heartbeat activity detection. ISABEL '11 Proc 4th Int Symp Appl Sci Biomed Commun Technol ACM 2011.
- Sameni R, Clifford GD. A review of fetal ECG signal processing; issues and promising directions. Open Pacing Electrophysiol Ther J 2011.
- Mukhopadhyay S, Biswas S, Roy AB, Dey N. Wavelet based QRS complex Detection of ECG signal. Int J Eng Res Appl (IJERA) 2012; 2: 2361-2365.
- Bushra J, Olivier L, Eric F, Ouadi B. Detection of QRS complex in ECG signal based on classification approach. IEEE Int Conference Image Processing (ICIP) 2010.
- Coast DA, Stern RM, CanoGC, Briller SA. An approach to cardiac arrhythmia analysis using hidden Markov models. IEEE Trans Biomed Eng 1990; 37: 826-836.
- Zhu T, Osipov M, Papastylianou T, Oster J, Clifton DA, Clifford GD. An intelligent cardiac health monitoring and review system. Appropriate Healthcare Technologies Low Resource Settings IEEE 2014.
- Sherbakova TF, Sherbakov GI, Sedov SS. Cardiac arrhythmia analysis used in the system of electrocardiosignal transmission to the supervision center. Int Conference Antenna Theory Techniques (ICATT) IEEE 2015.
- Jeen-Shing W, Wei-Chun C, Ya-Ting CY, Yu-Liang H. An effective ECG arrhythmia classification algorithm. Bio-Inspired Comput Appl 2011.
- José Da Luz ES, Nunes TM, Hugo De VC, Menotti D. ECG arrhythmia classification based on optimum-path forest. J Expert Syst Appl Int J 2013.
- Mane RS, Vaibhav C, Rani P. Cardiac arrhythmia detection by ECG feature extraction. Int J Eng Res Appl 2013.
- Sarkaleh MK, Shahbahrami A. Classification of ECG arrhythmias using discrete wavelet transform and neural networks. Int J Comput Sci Eng Appl (IJCSEA) 2012.
- Alonso-Atienza F, Morgado E, Fernández-Martínez L, García-Alberola A, Rojo-Álvarez JL. Detection of life-threatening arrhythmias using feature selection and support vector machine. IEEE Trans Biomed Eng 2014; 61: 832-840.
- Sivaraks H, Ratanamahatana CA. Robust and accurate anomaly detection in ECG artifacts using time series motif discovery. Comput Math Method Med 2015.
- Mazomenos EB, Biswas D, Acharyya A, Chen T. A low-complexity ECG feature extraction algorithm for mobile healthcare applications. IEEE Trans Informa Technol Biomed 2013.
- Zhu J, Zhou D, Li F, Fu T. Improved real coded genetic algorithm and its simulation. J Software 2014.
- http://www.rjpbcs.com/pdf/2016
- Dilmac S, Korurek M. A new ECG arrhythmia clustering method based on modified Artificial bee colony algorithm, comparison with GA and PSO classifiers. IEEE Int Symp Innov Intel Sys Appl (INISTA) 2013.
- Mark RG, Schluter PS, Moody GB, Devlin, PH, Chernoff D. An annotated ECG database for evaluating arrhythmia detectors. IEEE Trans Biomed Eng 1982; 29: 600.
- Jadhav SM, Nalbalwar SL, Ghatol AA. Modular neural network based arrhythmiaclassification system using ECG signal data. Int J Informa Technol Knowl Manag 2011; 4: 205-209.
- Sakthivel K, Jayanthiladevi A, Kavitha C. Automatic detection of lung cancer nodules by employing intelligent fuzzy cmeans and support vector machine. Biomed Res 2016; 27: 123-127.
- Gupta KO, Chatur PN. ECG signal analysis and classification using data-mining and artificial neural networks. Int J Emerg Technol Adv Eng 2012; 2: 56-60.
- Muthulakshmi S, Latha K. Classification of ECG waveform using feature selection algorithm. IEEE Int Conf Adv Commun Control Comput Technol (ICACCCT) 2012.
- http://www.cs.bilkent.edu.tr/~guvenir/publications/IS0003401.pdf
- Fornari JF, Sanchez JIP. Bundle branch blocks classification via ECG using MLP neural networks. Found Appl Intel Sys Springer Berlin 2013.
- Rajan C, Shanthi N. Genetic based optimization for multicast routing algorithm for Manet. Sadhana Acad Proceed Eng Sci 2015; 40: 2341-2352.
- Barhumi R. ECG signal classification using support vector machine based on wavelet multiresolution analysis. IEEE Int Conf Inform Sci Sig Proc Appl (ISSPA) 2012.